2797
Quantitative & qualitative evaluation of accelerated T2 mapping technique using Deep Learning reconstruction in knee cartilage1GE Healthcare, Madrid, Spain, 2Rey Juan Carlos University, Madrid, Spain, 3GE Healthcare, New York, NY, United States, 4GE Healthcare, Colorado, CO, United States, 5GE Healthcare, Calgary, AB, Canada, 6GE Healthcare, Waukesha, WI, United States, 7Clínica Cemtro, Madrid, Spain
Synopsis
MRI-based cartilage imaging shows biochemical and microstructural changes at early stages of osteoarthritis before changes become visible with structural MRI and arthroscopy. However, clinical application of T2 mapping is driven by high variability and suboptimal reproducibility, besides long examination times. The purpose of this study is to accelerate T2 mapping technique and apply a novel DL reconstruction method to develop a fast and robust way to access T2 relaxometry. Phantom and in-vivo testing demonstrated that DL reconstructed accelerated images provide increased consistency compared to conventional reconstruction and implies a great step into an extensive clinical adoption.
Introduction
Breakdown of articular cartilage is an important feature of knee osteoarthritis (OA). The earliest alterations in the biochemical composition of the extracellular matrix (ECM), a network of collagen fibrils and glycoproteins, may lead to the development of focal defects which may result in more diffuse cartilage loss associated with established OA1.MRI-based cartilage compositional analysis shows biochemical and microstructural changes at early stages of osteoarthritis before changes become visible with structural MRI sequences and arthroscopy. It also allows to monitor the response to regeneration or repair cartilage treatments2.
T2 mapping is one of the best-established MRI techniques for assessing cartilage composition, with a large body of literature mostly at the knee articular cartilage research3,4,5. T2 reflects the water content, collagen content and fiber orientation in the ECM, with longer T2 values associated to cartilage degeneration. However, the lack of standardization to reduce measurement variability and achieve comparable outcomes with different scanners, is preventing the transition to the clinical setting. Moreover, to get a reliable sampling of the T2 decay, a very long acquisition is required2,6.
Recently the use of deep learning (DL) reconstruction methods has become available in the MR environment to improve image quality and signal-to-noise ratio (SNR), providing consistent images with reduced acquisition times7.
The purpose of this study is to implement a T2 mapping accelerated sequence with a novel DL reconstruction method to check its combined performance and feasibility to be included in the clinical practice.
Data acquisition and analysis
For this work, we have implemented an accelerated version of CartiGram (GE Healthcare, Waukesha, WI, USA), a multi-echo fast spin echo sequence that acquires up to 8 echoes per single acquisition, by enabling two acceleration techniques through parallel imaging: a coil sensitivity-based method, ASSET (Array coil Spatial Sensitivity Encoding)8 and a “data-driven” method, ARC (Autocalibrating Reconstruction for Cartesian imaging)9. These techniques exploit the data redundancy generated by multiple receiver coils to recover missing k-space samples, reducing scan time and improving T2 mapping diagnostic utility.A T2 phantom (six compartments with different concentrations of agarose gels (eg. 2%, 3%, 4%), GE Healthcare) was used to assess the accuracy of the fitted T2 relaxation times between different acceleration factors and methods. Reference T2 values from this phantom are: 2%-65.5ms, 3%-44.9ms and 4%-34.9ms.
T2 phantom scanning MRI was conducted on a 3T SIGNA™ Premier (GE Healthcare, Waukesha, WI) scanner with a 18-Ch Tx/Rx knee coil (QED, Hannover, Germany) using same parameters as in the baseline phantom experiment shown in Table 1, with different acceleration factors: no acceleration, ASSET (=2,3) and ARC (=2,3,4).
In addition, under an IRB-approved study, three volunteers were scanned to assess in vivo knee T2 values. Cartigram product sequence (no acceleration by default) and an accelerated sequence with ARC=3 (as defined from the phantom results) were conducted also on a 3T SIGNA™ Architect scanner with a 18-Ch Tx/Rx knee coil using protocol from Table 1 for each one. Only some slices from one condyle were acquired on both sequences, to reduce conventional Cartigram sequence scan time.
Images from phantom and volunteers were reconstructed with the conventional method and with a novel DL reconstruction method that uses a DL residual encoder network trained to reconstruct images with minimal noise (tuned to 75% denoising for this work)7.
Estimation of T2 relaxation values from vials/cartilage regions was performed by mono-exponential curve fitting of the signal intensity of each echo-time on a pixel-by-pixel basis10. Making use of the GE AW workstation (GE Healthcare, Waukesha, WI), a colour-coded T2 map was generated, and regions of interest (ROIs) were depicted to measure average T2 values.
Results
By using higher acceleration factors, we achieved a substantial scan time reduction. Thanks to DL reconstruction, we could recover SNR and improve image quality on the resulting T2 maps. Results reveal higher SNR and less aliasing artifacts using ARC versus ASSET (Figure 1) on quantitative T2 maps at higher acceleration factors. The best trade-off between SNR, artifacts and scan time reduction corresponds to ARC=3.In T2mapping, the reduction of SNR usually causes overestimation of T2 fitting because of the noise floor, comparing average T2 values measured at the different vials, DL reconstruction provided more consistent values across different acceleration factors (Figure 2) compared to conventional reconstruction thanks to denoising.
Accordingly, DL reconstruction allowed to get denoised, and therefore minimized standard deviation, T2 maps and almost identical results between non-accelerated and ARC3 for the in vivo scans (Figure 3, Table 2) compared to conventional reconstruction.
Discussion
From the phantom testing, computed T2 values at the lower agarose concentration compartment, with a higher water concentration, showed a higher difference with the reference T2 value compared to the other vials. This could be associated with a degradation of the vial composition throughout time or temperature variations, since the baseline experiment was done in 2017.More phantom data will be needed to check reproducibility and validate accuracy of these techniques.
Conclusion
Our findings demonstrate that thanks to DL reconstruction, accelerated T2 mapping technique would significantly shorten the examination time and would make T2 mapping feasible in clinical practice providing consistent quantitative cartilage information. This implies a great step for an extensive clinical exploration of the proposed method.Acknowledgements
No acknowledgement found.References
1. Guermazi A, Alizai H, Crema M, Trattnig S, Regatte R, Roemer F. Compositional MRI techniques for evaluation of cartilage degeneration in osteoarthritis. Osteoarthritis Cartilage. 2015;23(10):1639-1653. 2. Chalian M, Li X, Guermazi A et al. The QIBA Profile for MRI-based Compositional Imaging of Knee Cartilage. Radiology. 2021;301(2):423-432.
3. Joseph G, Baum T, Alizai H et al. Baseline mean and heterogeneity of MR cartilage T2 are associated with morphologic degeneration of cartilage, meniscus, and bone marrow over 3years – data from the Osteoarthritis Initiative. Osteoarthritis Cartilage. 2012;20(7):727-735.
4. Li X, Pedoia V, Kumar D, et al. Cartilage T1r and T2 relaxation times: longitudinal reproducibility and variations using different coils, MR systems and sites. Osteoarthritis Cartilage 2015;23(12):2214–2223.
5. Baum T, Joseph G, Karampinos D, Jungmann P, Link T, Bauer J. Cartilage and meniscal T2 relaxation time as non-invasive biomarker for knee osteoarthritis and cartilage repair procedures. Osteoarthritis Cartilage. 2013;21(10):1474-1484.
6. Hilbert T, Sumpf T, Weiland E et al. Accelerated T2 mapping combining parallel MRI and model-based reconstruction: GRAPPATINI. Journal of Magnetic Resonance Imaging. 2018;48(2):359-368.
7. Lebel R. Performance characterization of a novel deep learning-based MR image reconstruction pipeline. https://arxiv.org/abs/2008.06559. Published 2020. Accessed Nov 2021.
8. Pruessmann KP, Weiger M, Scheidegger MB, Boesiger P. SENSE: Sensitivity encoding for fast MRI. Magn Reson Med 1999; 42:952-962.
9. Griswold MA, Jakob PM, Heidemann RM, et al. Generalized autocalibrating partially parallel acquisitions (GRAPPA). Magn Reson Med 2002; 47:1202-1210
10. David-Vaudey E, Ghosh S, Ries M, Majumdar S. T2 relaxation time measurements in osteoarthritis. Magn Reson Imaging 2004;22(5):673–682.
Figures
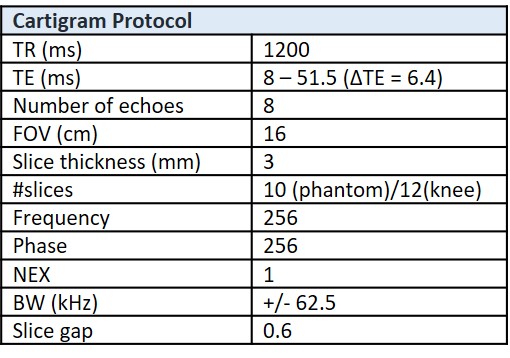
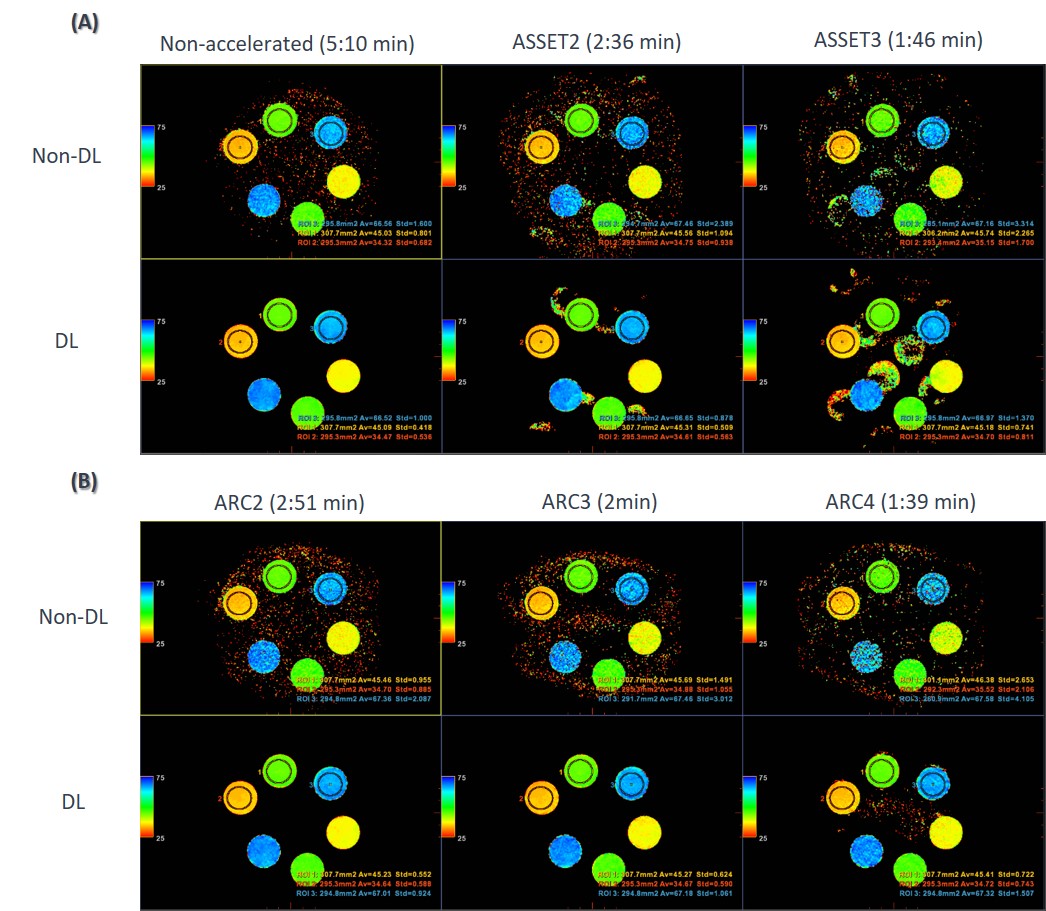
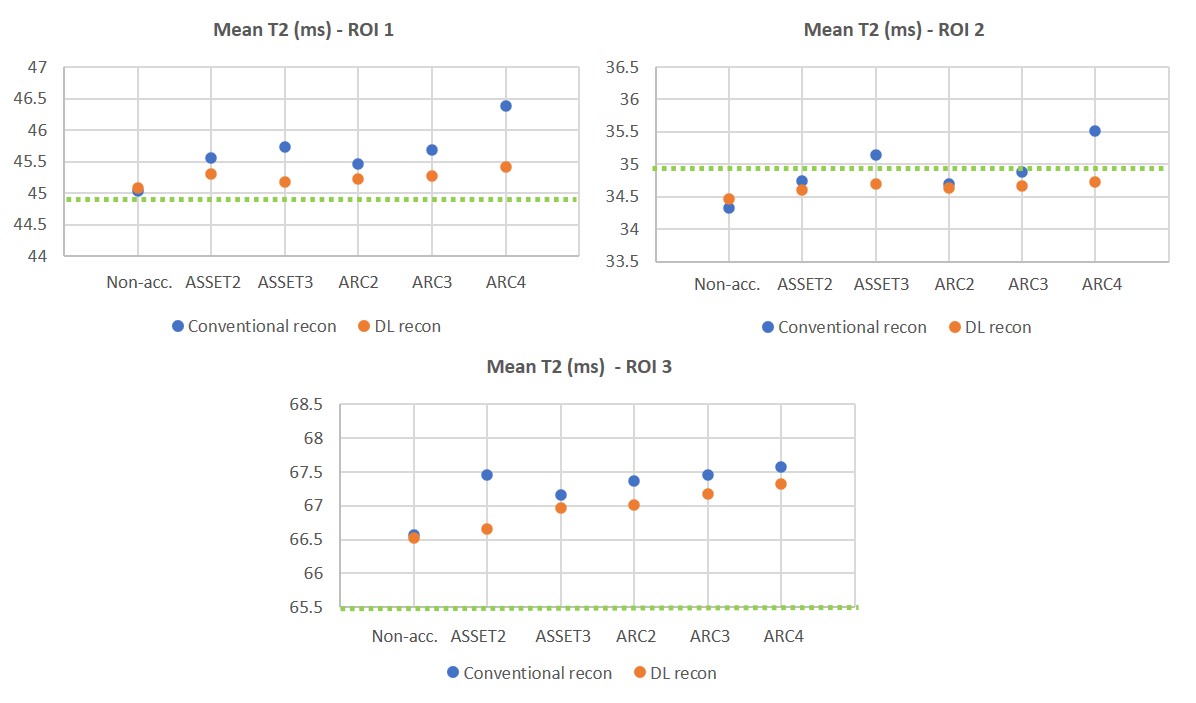
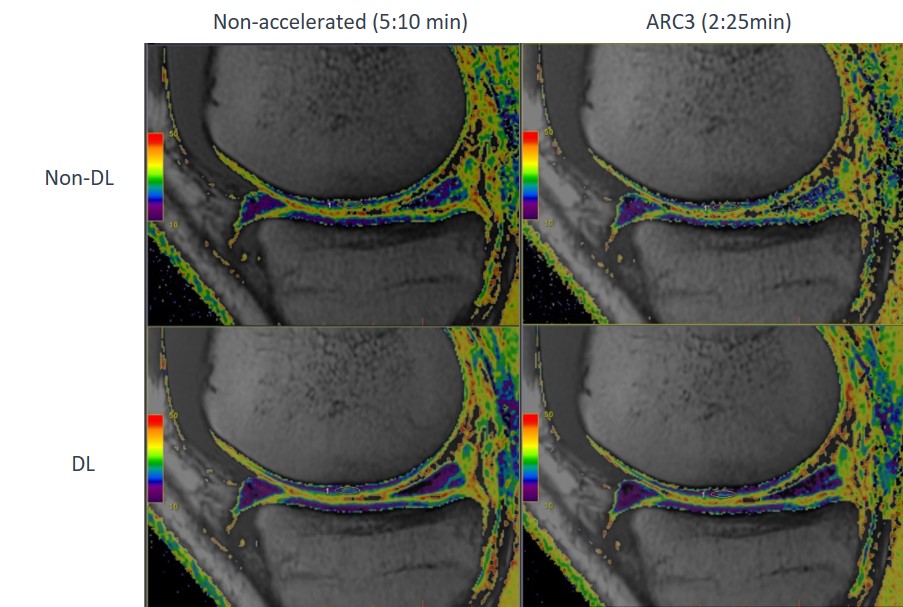
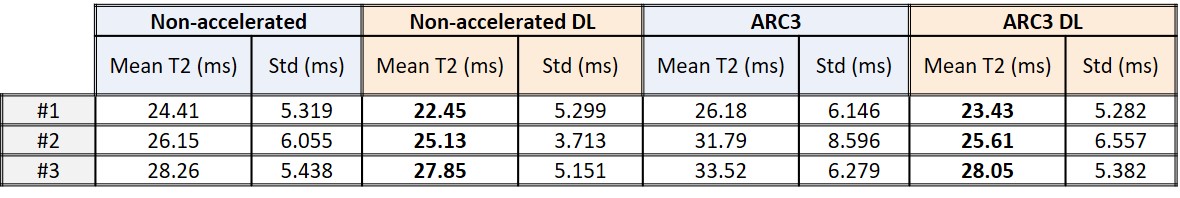
Table 2. Comparison of average T2 values and its standard deviation (std) computed at the medial condyle ROI at different acceleration factors, with and without DL, for each volunteer.