2796
Repeatability and accuracy of MR-STAT quantitative T1 and T2 measurements1Computational Imaging Group for MR Diagnostics and Therapy, Center for Image Sciences, University Medical Center Utrecht, Utrecht, Netherlands, 2Department of Radiology, Division of Imaging and Oncology, University Medical Center Utrecht, Utrecht, Netherlands
Synopsis
MR-STAT is a quantitative MRI technique that obtains multiple tissue parameter maps (e.g. T1, T2) from a single, short scan. In this study we perform an accuracy and repeatability study of MR-STAT using a Cartesian FISP-based sequence by repeatedly scanning Eurospin gel tubes and comparing the results against reference measurements. We observe coefficients of variation between 0.5 % and 1.5 % for T1 and between 2.0 % and 7.2 % for T2. The mean relative errors as compared to the reference measurements are -1.5 % for T1 and 5.8 % for T2.
Introduction
MR-STAT1 is a quantitative MRI technique that allows multiple quantitative tissue parameter maps (e.g. T1, T2 and proton density) to be reconstructed from a single, short transient-state scan. A large-scale non-linear inversion problem is solved in which the parameter maps are fitted directly against the measured time-domain data. In previous work, the feasibility of the MR-STAT approach has been demonstrated in-vivo.2 For clinical adoption of MR-STAT, accuracy, repeatability and reproducibility of reconstructed quantitative values is of high importance.3 In this study we perform an accuracy and repeatability study of MR-STAT using a Cartesian FISP-based sequence by scanning a phantom consisting of gel tubes over multiple sessions and comparing the results against reference measurements.Methods
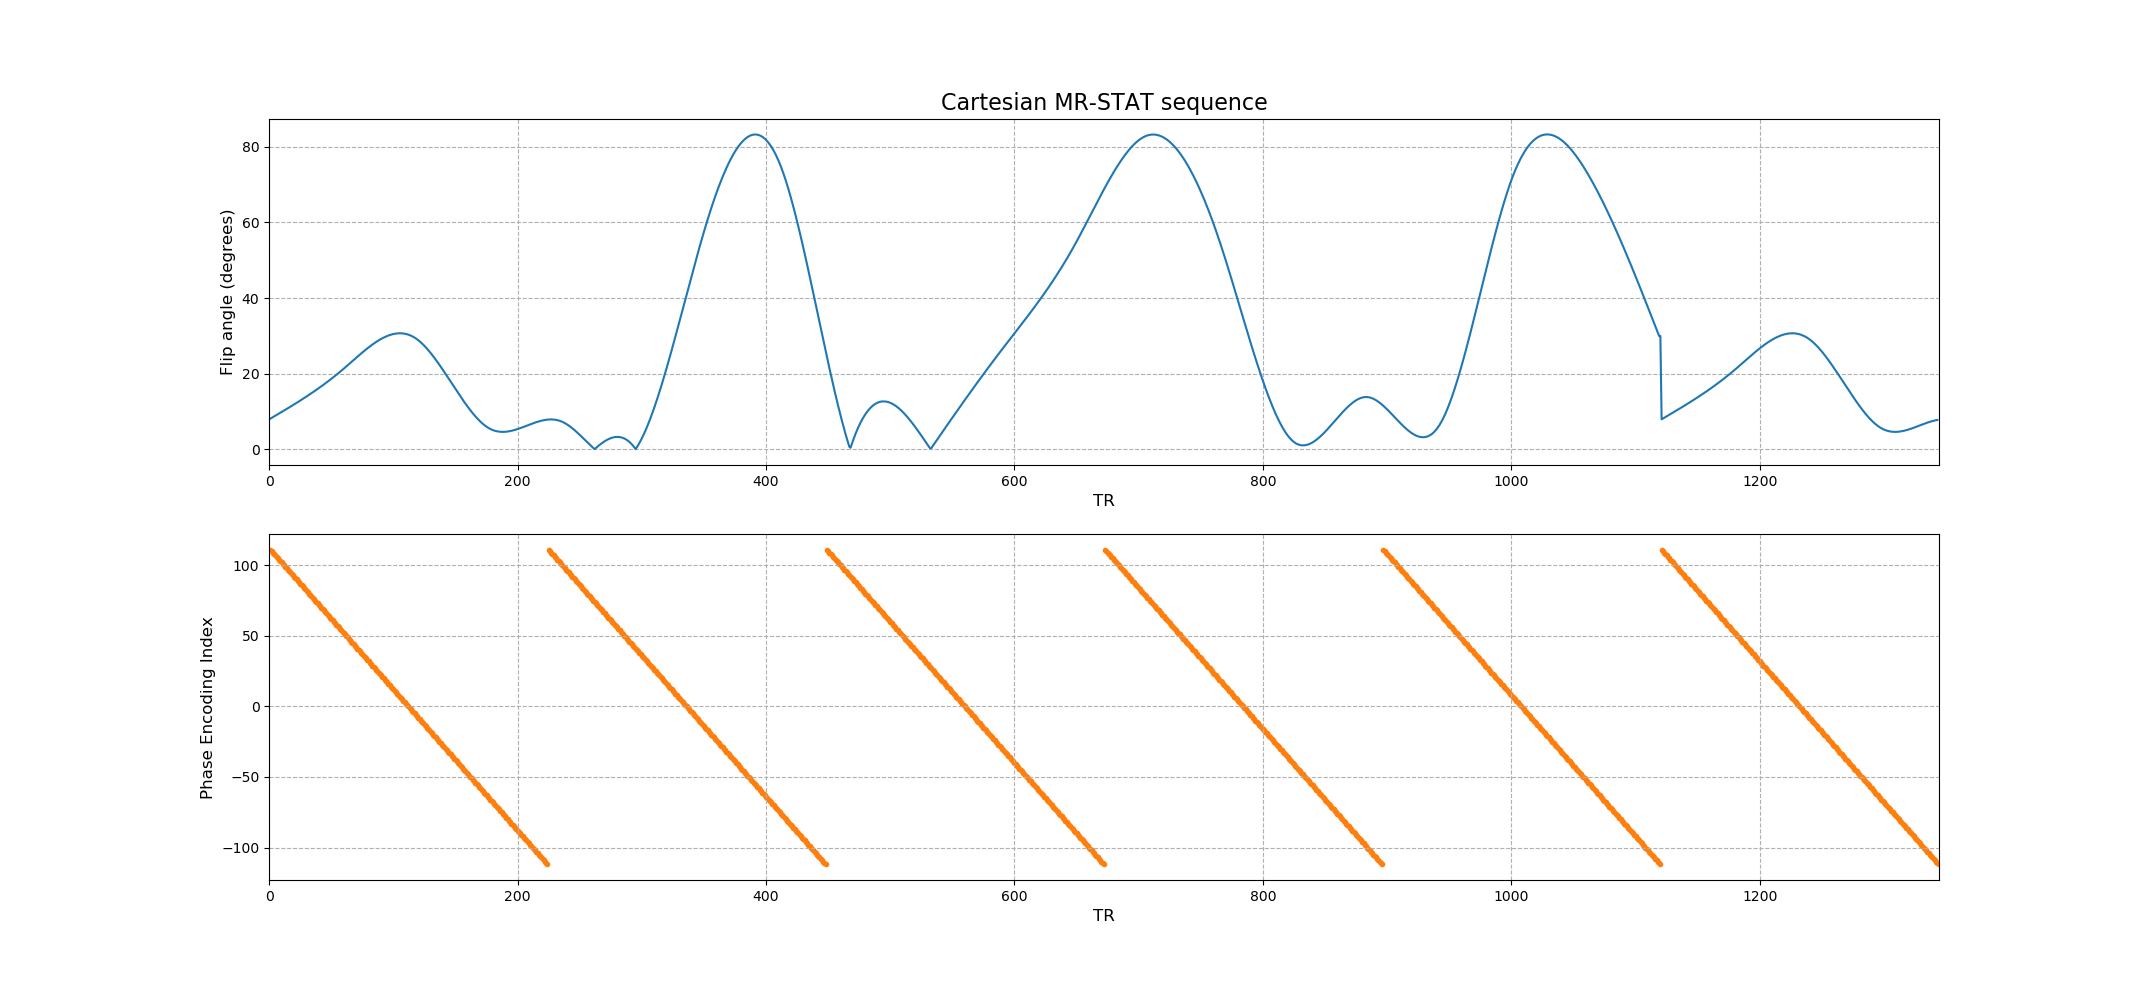
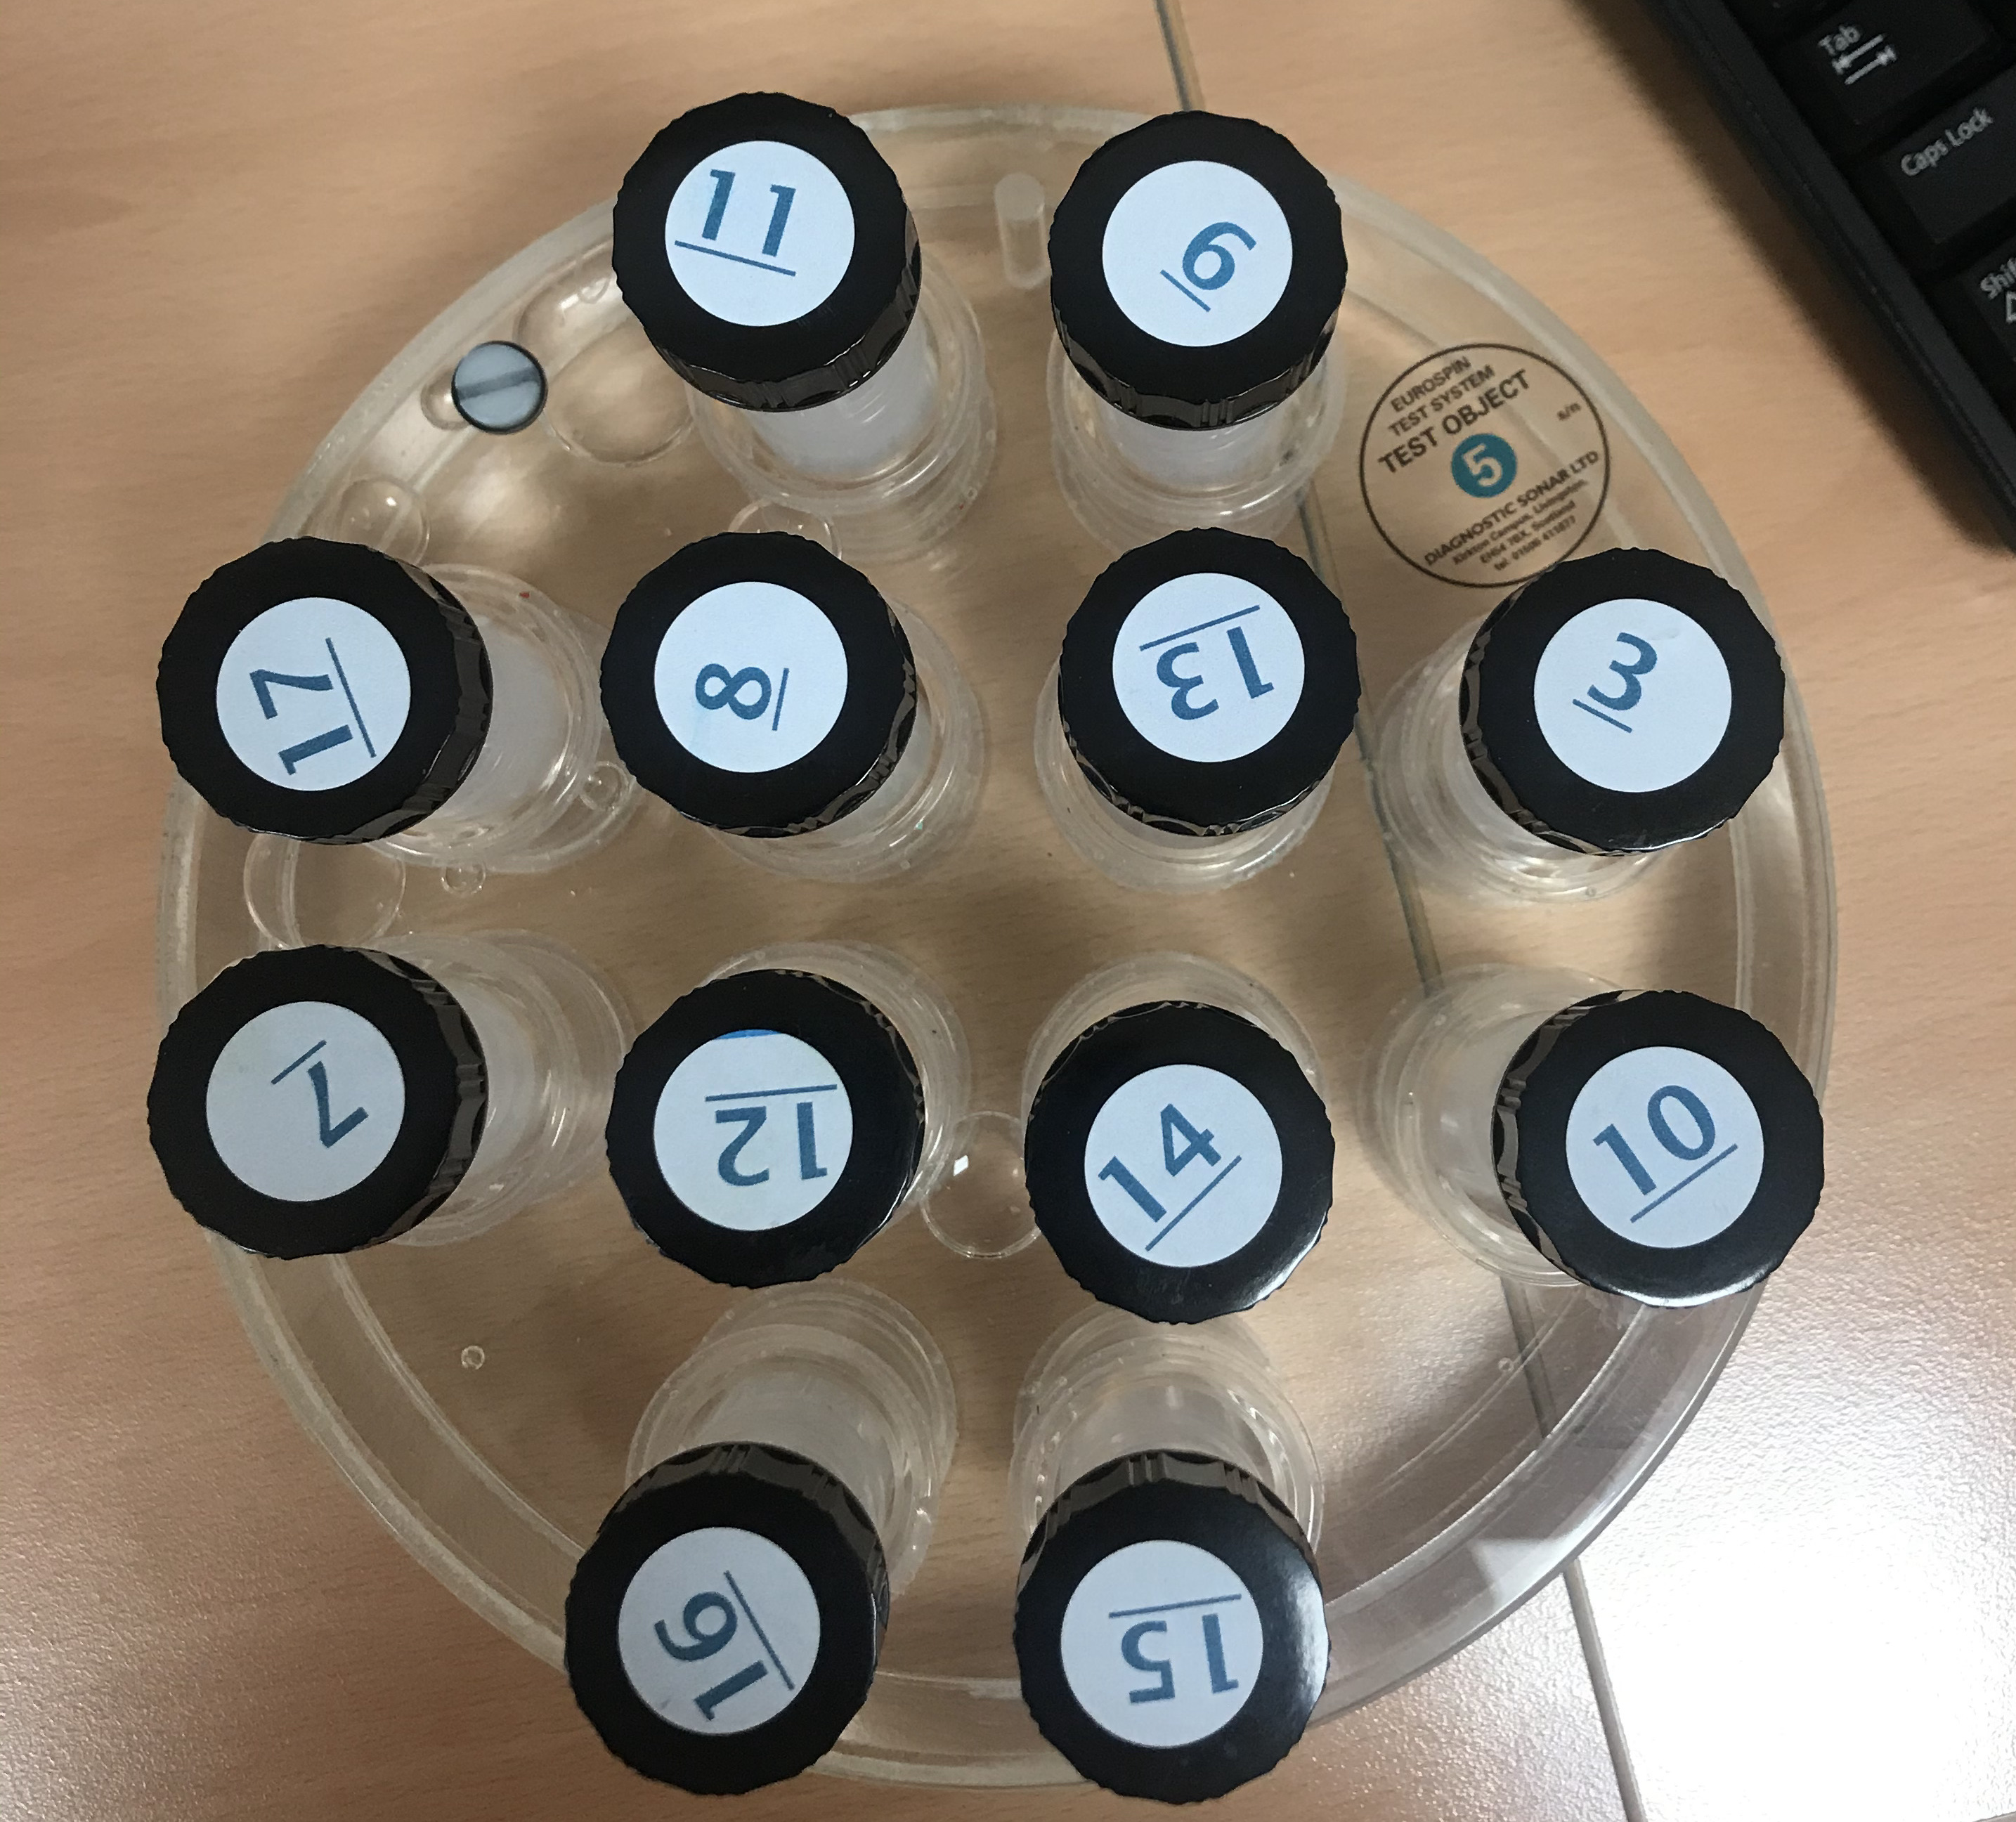
A 2D gradient-spoiled gradient-echo pulse sequence with a linear, Cartesian gradient encoding scheme was employed. At each TR, the flip angle changed according to an optimized pattern that was generated using the BLAKjac4 technique (Fig. 1). The TR and TE remain fixed throughout the sequence at 7.5 ms and 3.8 ms, respectively. The sequence was preceded by a non-selective adiabatic inversion pulse. Per scan, a total of 1344 readouts were acquired in 10 s.Twelve tubes with gadolinium-doped gel (TO5, Eurospin II test system, Scotland, Fig. 2) were scanned on two different days on a 3 MR system (Elition, Philips Healthcare, Best, The Netherlands) using thirteen channels of the the vendors receive headcoil. Each day, the gel phantoms was scanned four times over two separate sessions. Between the session the phantom was removed and repositioned resulting in sixteen separate measurements. The scanner room temperature was measured at approximately 22 degrees celsius each session.
Prior to reconstruction, an SVD compression was used to combine the measured data of all channels to single virtual coil data. The MR-STAT reconstructions were then performed on a NVIDIA Tesla V100-PCIE-16GB GPU card5 and the reconstruction software was written in the Julia programming language6. Flip angle-dependent slice profile corrections were applied as well as a B1 correction based on a separate B1 reference measurement.7 ROIs were drawn manually in the T1 and T2 maps to compute mean values per tube.
Gold standard measurements to obtain reference values for T1 and T2 were also performed. To obtain reference values for T1, a single-echo inversion recovery scan with inversion times of [100, 200, 400, 700, 1100, 1600, 2200, 2900] ms was performed. To obtain reference values for T2, a single-echo spin-echo scan with echo times of [20, 30, 50, 80, 120, 170, 230, 300] ms was performed. The T1 and T2 maps were obtained by voxel-wise fitting of a mono-exponential signal model to the data.
Results
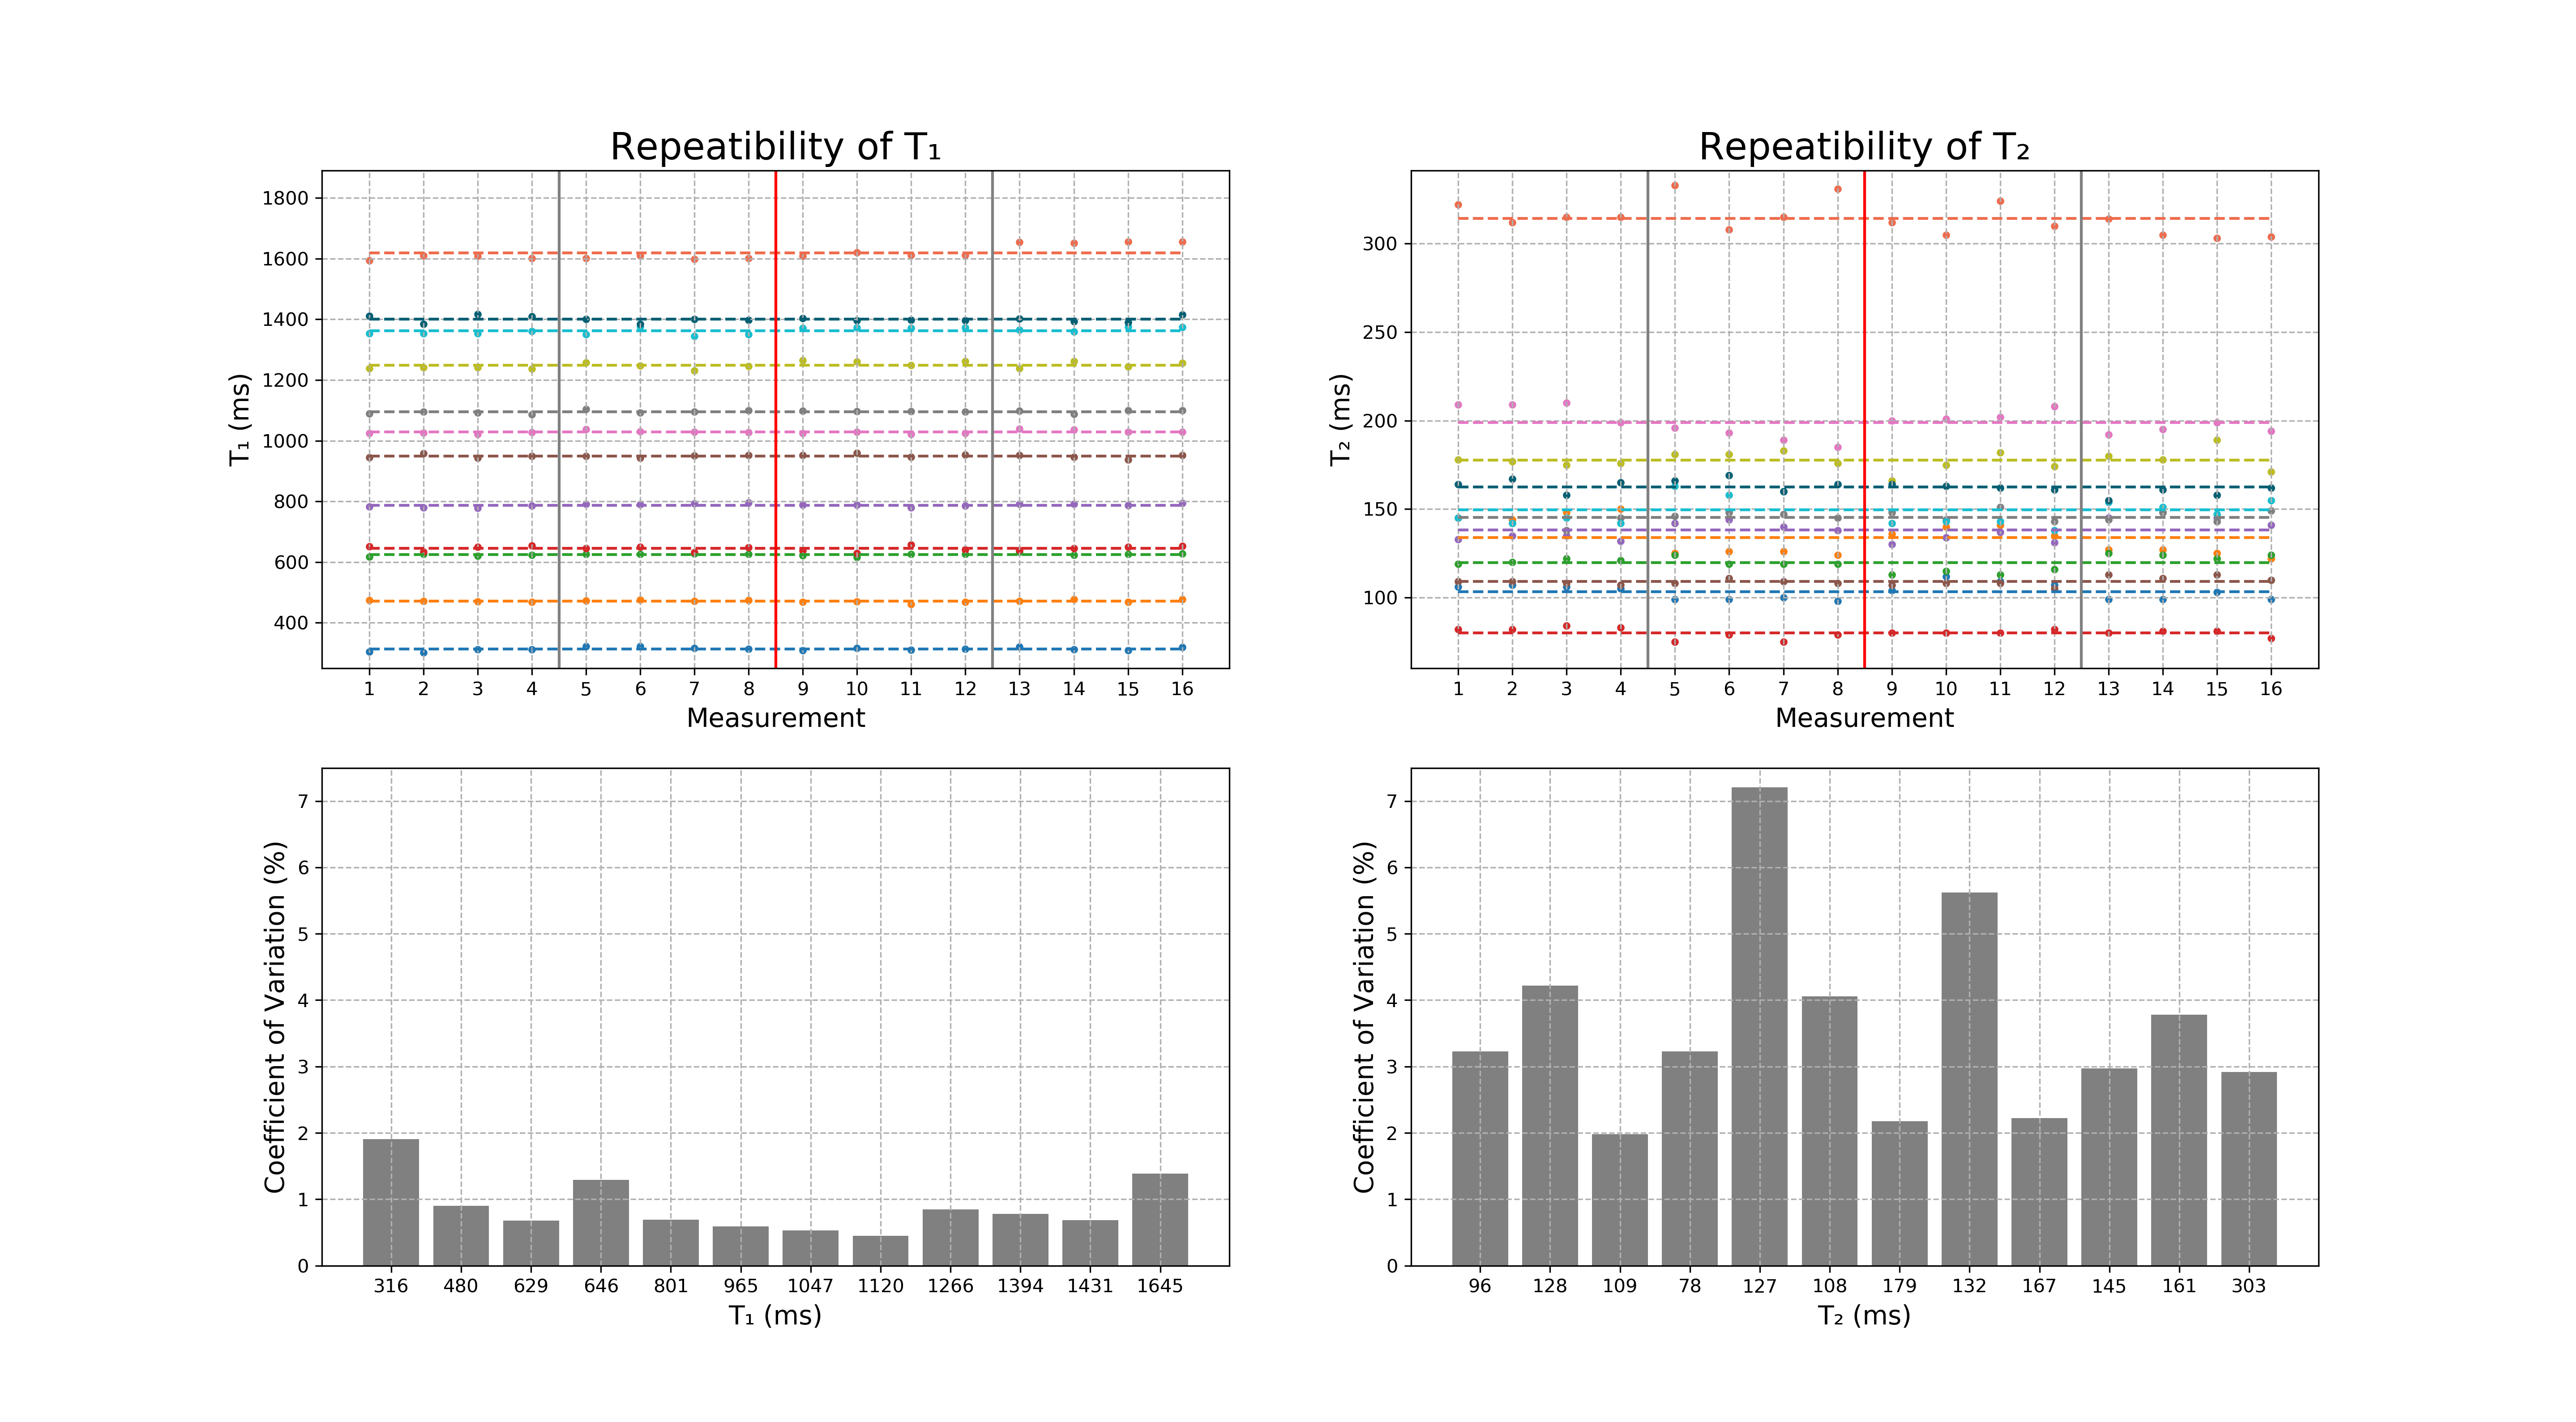
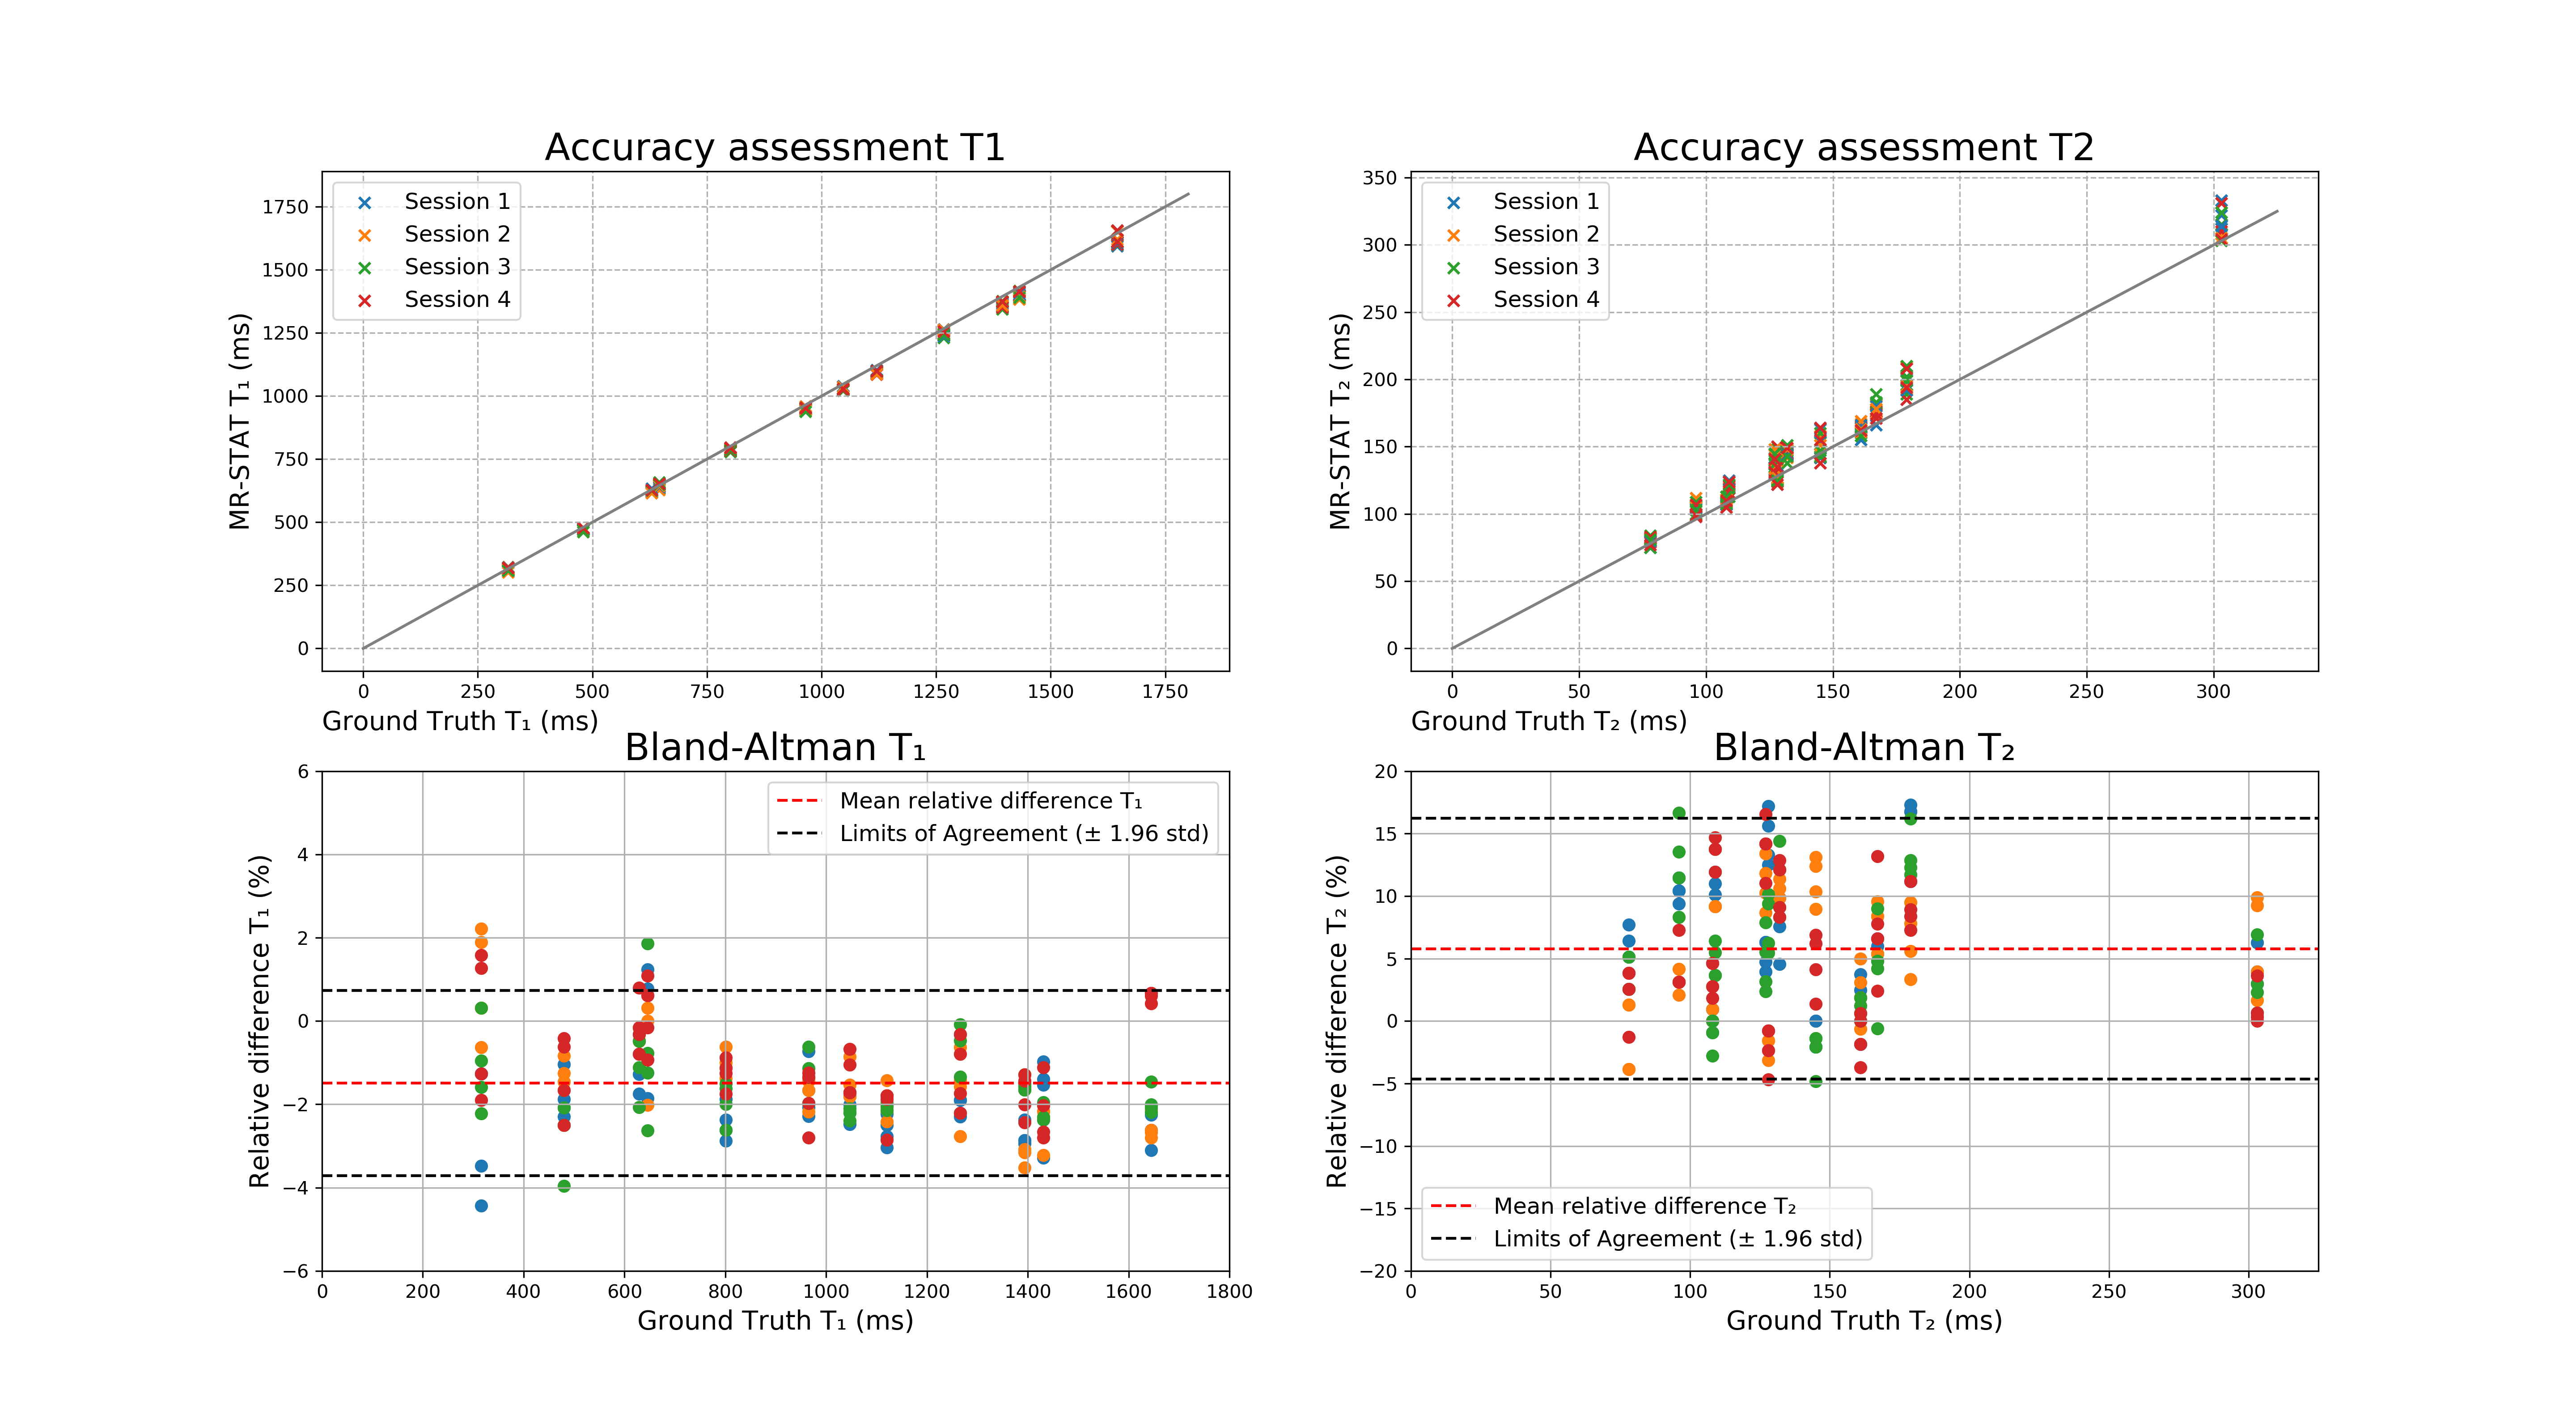
In Fig. 3 mean T1 and T2 values in the ROIs in each tube are plotted for the sixteen measurements. For each tube, the coefficient of variation is computed as the standard deviation of these values, divided by the mean. The coefficients of variations are between 0.5% and 1.9% for T1 and between 2.0% and 7.2% for T2.In Fig. 4 Bland-Altman plots of relative differences of the mean values per ROI as compared to the ground truth reference measurements are shown. The mean bias for T1 is -1.5 % and for 5.8 % for T2. Almost measurements fall within the 95 % limits of agreement, which is determined as the mean difference +- 1.96 times the standard deviation.
Discussion
The coefficients of variation as well as the mean relative errors for T1 are generally lower than for T2. We hypothesise that, on the one hand, this is due to the strong T1 encoding coming from the inversion pre-pulse. On the other hand, residual T1 and T2 sensitivity of the B1 mapping sequence will result in T1 and T2 correlated inaccuracies, that through the B1 correction propagate in the final T2 values. Since repositioning the phantom changes the B1 field in each tube, higher errors compared to the reference method as well as higher variations between the MR-STAT scans are therefore expected for T2. Furthermore, inaccuracies in the slice profile estimation also have a stronger impact T2 than on T1. The results for T2 could potentially be improved by using a more accurate B1 mapping technique8, using a more comprehensive EPG model that also takes into account T1 and T2 effects during the RF pulses9, employing T2-prep pulses10 and/or incorporating phase based T2 mapping techniques11.In future work, the reproducibility of MR-STAT on the Eurospin phantom across different MR systems will also be assessed, as well as a comparison study against other qMRI methods like MR Fingerprinting.12 In-vivo assessments will also be performed because, compared to gel phantom scans, additional signal model imperfections are present (due to e.g. flow, motion, partial volume effects) that may impact the outcomes.
Conclusion
The MR-STAT scans show high repeatability (coefficients of variation between 0.5% and 1.9% for T1 and between 2.0% and 7.2% for T2) and accuracy (mean relative error of -1.5 % for T1 and 5.8 % for T2) across a wide range of T1 and T2 values in gel phantom measurements.Acknowledgements
The authors would like to thank Mariya Doneva for fruitful discussion regarding the experimental setup. This research has been financed by NWO under grant #17986.References
[1] Sbrizzi, A et al. Fast quantitative MRI as a nonlinear tomography problem. Magnetic Resonance Imaging 46 (2018): 56-63.
[2] van der Heide, O et al. High‐resolution in vivo MR‐STAT using a matrix‐free and parallelized reconstruction algorithm. NMR in Biomedicine 33.4 (2020): e4251.
[3] QIBA Technical Performance Working Group. Quantitative Imaging Biomarkers: A Review of Statistical Methods for Technical Performance Assessment. Stat Methods Med Res. 24.1 (2015): 27–67.
[4] Fuderer, M et al. BLAKJac - A computationally efficient noise-propagation performance metric for the analysis and optimization of MR-STAT sequences. Proc. Intl. Soc. Mag. Reson. Med., 2021: 3059.
[5] van der Heide, O et al. Faster Bloch simulations and MR-STAT reconstructions on GPU using the Julia programming language. Proc. Intl. Soc. Mag. Reson. Med., 2021: 3063.
[6] Bezanson, J et al. Julia: A fresh approach to numerical computing. SIAM review 59.1 (2017): 65-98.
[7] Nehrke, K et al. DREAM - a novel approach for robust, ultrafast, multislice B1 mapping. Magn Reson Med 68.5 (2012): 1517-1526.
[8] Sacolic, L.I. et al. B1 Mapping by Bloch-Siegert Shift. Magn Reson Med. 63.5 (2010): 1315–1322.
[9] Liu, H. et al. Fast and accurate modeling of transient-state, gradient-spoiled sequences by recurrent neural networks. NMR in Biomedicine 34.7 (2021): e4527
[10] Hamilton. J.I. et al. MR fingerprinting for rapid quantification of myocardial T1, T2, and proton spin density. Magn Reson Med. 77 (2017):1446–1458.
[11] Wang, X et al. Phase-based T2 mapping with gradient echo imaging. Magn Reson Med 84 (2020):609–619.
[12] Ma, D et al. Magnetic resonance fingerprinting. Nature 495 (2013): 187–192.
Figures