2795
Test-retest and inter-vendor variability of brain segmentation using 3D synthetic MRI in volunteers at 3T1Radiology, Universitair Ziekenhuis Brussel, Brussels, Belgium
Synopsis
Six volunteers were
scanned two times on two different 3T scanners (GE, Philips) using the 3D-QALAS
sequence. The intracranial and brain parenchymal volume and myelin content were
determined and the brain segmented in cerebrospinal fluid and white and grey
matter using synthetic MRI. Bland-Altman plots, Dice coefficient and
coefficient of variation indicate that the test-retest variability is very
small, but there is an inter-vendor bias for CSF, GM and WM. MyC, BPV and ICV
have only a very limited inter-vendor bias. At least for GM and BPV, the expected inter-scanner variation, besides
the bias, is below the clinically relevant threshold.
Introduction
Measuring relaxometric properties in the brain has become possible due to a number of new sequences which were introduced, first in 2D 1,2, but now also in 3D such as the 3D-QALAS sequence 3. This relaxometry data can be used to segment the brain and create synthetic images. The increased resolution of the 3D sequences results in less partial volume effect, significantly increasing the accuracy of the measured values and the possibility for clinically relevant applications.It is important to know the accuracy of these sequences, as well as the influence of the scanner, in order to correctly assess deviations from previous or normative values. To this end, a test-retest was done on volunteers in this research, on two different scanners, such that both inter- and intra-scanner variability could be determined.
Methods
Six healthy volunteers (3 male, age range 28-69 years, average 47 years) were scanned twice using the 3D-QALAS sequence on two different 3T scanners (Philips Ingenia and GE Premier), for a total of four scans, each time with repositioning between scans and with a random order of the scans for each subject. Parameters were kept the same where possible. Common parameters of the scans were: axial scans, resolution: 1x1x1.2 mm³, FoV 25.6x25.6x16.3 cm³, TI=100ms, echo train length=150, flip angle=4°. GE specific settings were: TE=2.032ms, TR=5.372ms, bandwidth=390.6Hz/pixel, 48 channel head coil, acceleration 2.6 using hypersense, acquisition time = 6min 38s. Philips specific settings were TE=2.129ms, TR=4.710ms, bandwidth=431 Hz/pixel, 32 channel head coil, acceleration factor 2 using CSense, acquisition time = 6min 57s.Segmentation in cerebrospinal fluid (CSF) and grey and white matter (GM, WM), and determination of myelin content (MyC), intracranial volume (ICV), and brain parenchymal volume (BPV) was done using SyMRI prototype version 21Q1 4,5 (SyntheticMR AB, Linköping, Sweden). Synthetic T1-weighted images with TE=5ms and TR=100ms were constructed and coregistered to a randomly chosen T1-weighted image using SPM12 6. The segmentation maps were warped along with their respective T1 images. Dice scores were then calculated between the binarized segmentation maps.
The coefficient of variation (CV) was calculated for test-retest variability, using the two measurements per scanner per volunteer. For the inter-scanner variability, the CV was calculated using the average of the two measurements per scanner as input values.
Results
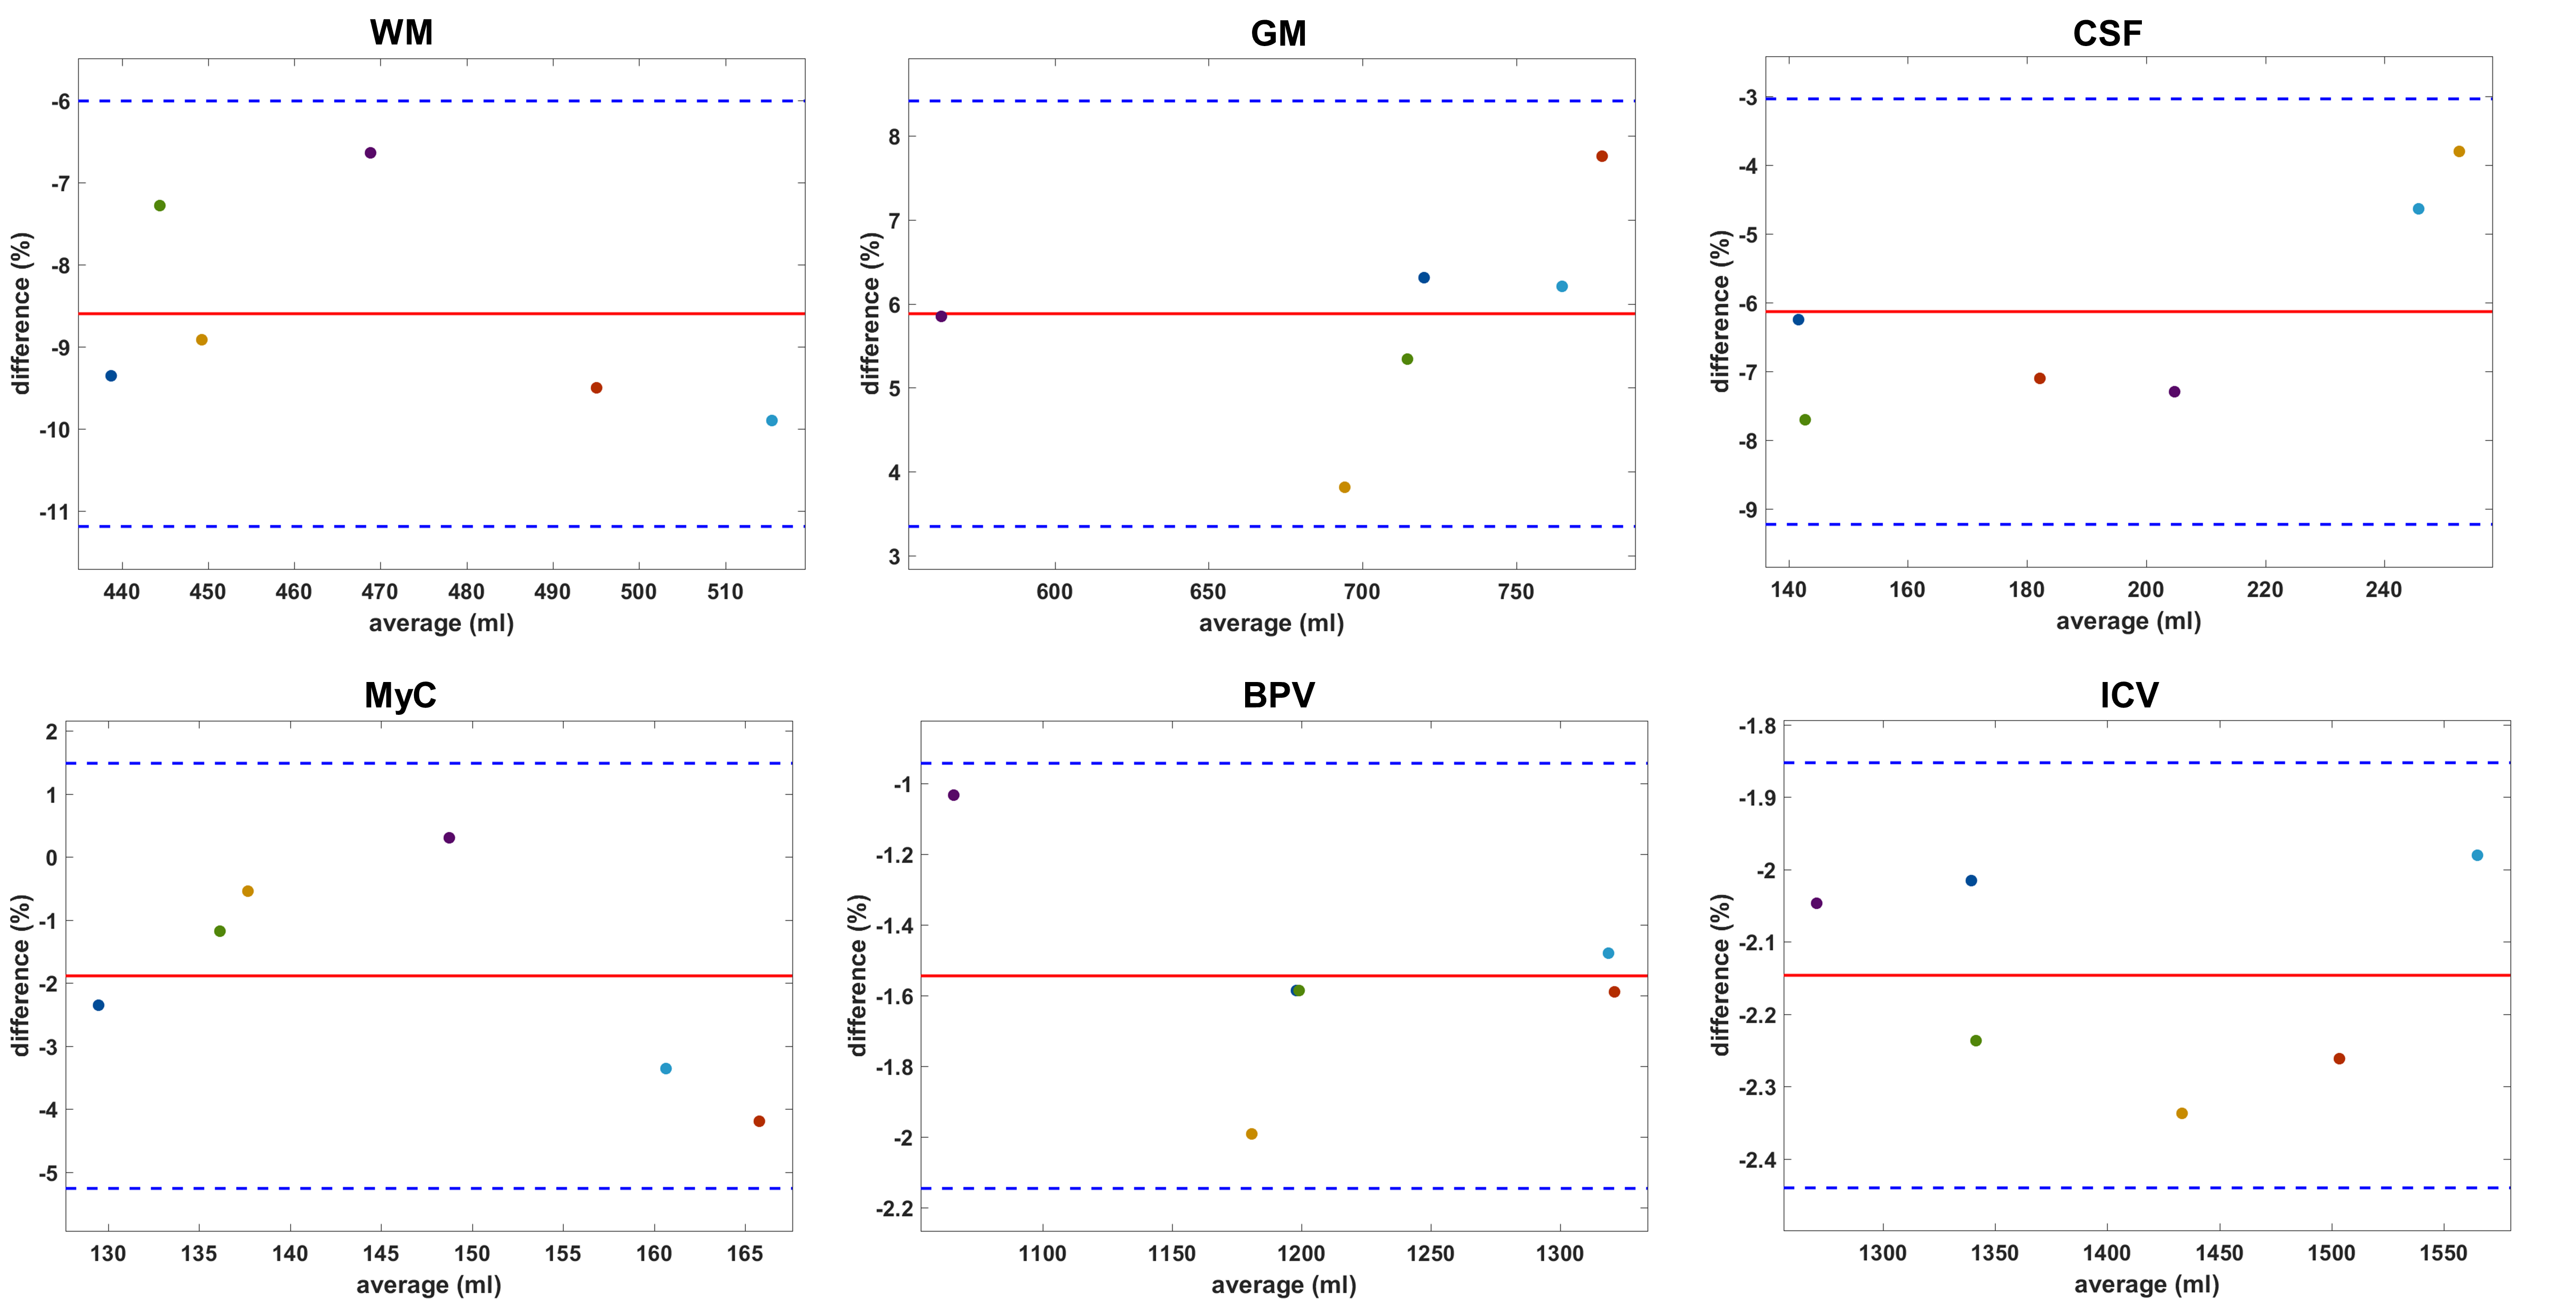
The Bland-Altman plots for the intra-scanner results are shown in figure 1. The bias is -1.38% for WM, 1.38% for GM, and <0.1% for the other segments. The limits of agreement (LA) are largest for CSF (-3.53% to 3.73%), WM (-4.58% to 1.83%),GM (-0.67% to 3.43%) and MyC (-3.31% to 3.23%). For BPV and ICV they are <1%.The inter-scanner Bland-Altman plots are shown in figure 2. For WM there is -8.60% difference on average, while this is 5.88% and -6.13% for GM and CSF respectively. For MyC the bias is -1.89%, BPV has -1.54%, and for the ICV it is -2.15%. The LA are smaller as in the test-retest results for WM, CSF, MyC, BPV and ICV but larger for GM.
The Dice scores are shown in table 1 and indicate better agreement with the GE retest compared to the Philips measurements, except for MyC. The Dice score indicates good to excellent levels of agreement, with the lowest score in MyC.
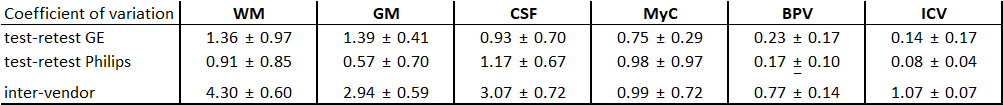
The CVs are shown in table 2. Both vendors score similarly in the test-retest comparisons, with the ICV and BPV masks being extremely similar, and MyC having CV<1% in all cases. For the inter-scanner results, the largest variability is observed for WM, followed by CSF, GM, ICV, MyC and BPV.
Discussion
The Bland-Altman plots, CV and Dice similarity score all indicate that the intra-scanner variability is very low, yielding very similar volumetric results and segmented maps, with the CV being lower than the expected yearly GM and BPV atrophy in AD 7,8. These results are also in line with earlier findings at 1.5T 9. The slight biases seen in the plots for WM and GM are likely statistical noise.The CV and Bland-Altman plots indicate an inter-vendor bias: using Philips, more GM is found, but less WM and CSF. For MyC, BPV and ICV the bias is not clinically relevant. The Dice scores from different scanners are slightly lower, except for MyC. These facts indicate that MyC might be a robust quantitative measure across scanners. If the bias is taken into account, both the standard deviations of the CV and the LA in the plots are within clinical limits 7,8. The lower Dice scores for the MyC segments are natural, due to its complexity 10. The reason for the bias will be investigated further, but previous work in phantoms found a slight inter-vendor effect in the T1 estimations 11, used for the tissue segmentation. A possible improvement of the sequence would be prospective motion correction.
Conclusion
The first inter-vendor results for 3D-QALAS in volunteers at 3T are presented. Our test-retest results show that 3D-QALAS reliably estimates WM, GM, CSF and MyC, in line with results at 1.5T. Despite a bias between the vendors for GM, WM and CSF, with up to 8.60% difference on average for WM, the standard deviations are within clinical limits. MyC, BPV and ICV are estimated reliably.Acknowledgements
We thank GE and Philips for making their sequences available, and SyMRI for their prototype software.References
1. Ma, D., Gulani, V., Seiberlich, N., Duerk, J. & Griswold, M. MR Fingerprinting : Rapid Simultaneous Quantification of T1, T2, Proton Density and Off-resonance using a Spiral Trajectory. in Proceedings of the International Society of Magnetic Resonance in Medicine annual meeting 21, 0018 (2013).
2. Blystad, I. et al. Synthetic MRI of the brain in a clinical setting. Acta radiol. 53, 1158–1163 (2012).
3. Kvernby, S. et al. Simultaneous three-dimensional myocardial T1 and T2 mapping in one breath hold with 3D-QALAS. J. Cardiovasc. Magn. Reson. 16, 102 (2014).
4. Warntjes, M. et al. Modeling the Presence of Myelin and Edema in the Brain Based on Multi-Parametric Quantitative MRI. Front. Neurol. 7, 1–15 (2016).
5. West, J., Warntjes, J. B. M. & Lundberg, P. Novel whole brain segmentation and volume estimation using quantitative MRI. Eur. Radiol. 22, 998–1007 (2012).
6. Statistical Parametric Mapping. (Elsevier, 2007). doi:10.1016/B978-0-12-372560-8.X5000-1
7. Anderson, V. M. et al. Gray matter atrophy rate as a marker of disease progression in AD. Neurobiol. Aging 33, 1194–1202 (2012).
8. Sluimer, J. D. et al. Whole-brain atrophy rate in Alzheimer disease: Identifying fast progressors. Neurology 70, 1836–1841 (2008).
9. Fujita, S. et al. Three-dimensional high-resolution simultaneous quantitative mapping of the whole brain with 3D-QALAS: An accuracy and repeatability study. Magn. Reson. Imaging 63, 235–243 (2019).
10. Taha, A. A. & Hanbury, A. Metrics for evaluating 3D medical image segmentation: analysis, selection, and tool. BMC Med. Imaging 15, 29 (2015).
11. Naeyaert, M., Vanderhasselt, T., Warntjes, M. J. B. & Raeymaekers, H. Reproducibility and Multi-vendor Comparison of Simultaneous T1- and T2- Mapping Using 2D and 3D Synthetic MRI with GRAPPA, SENSE and Compressed Sense at 3T. in Proceedings 29th Scientific Meeting, International Society for Magnetic Resonance in Medicine 1288 (2021).
Figures
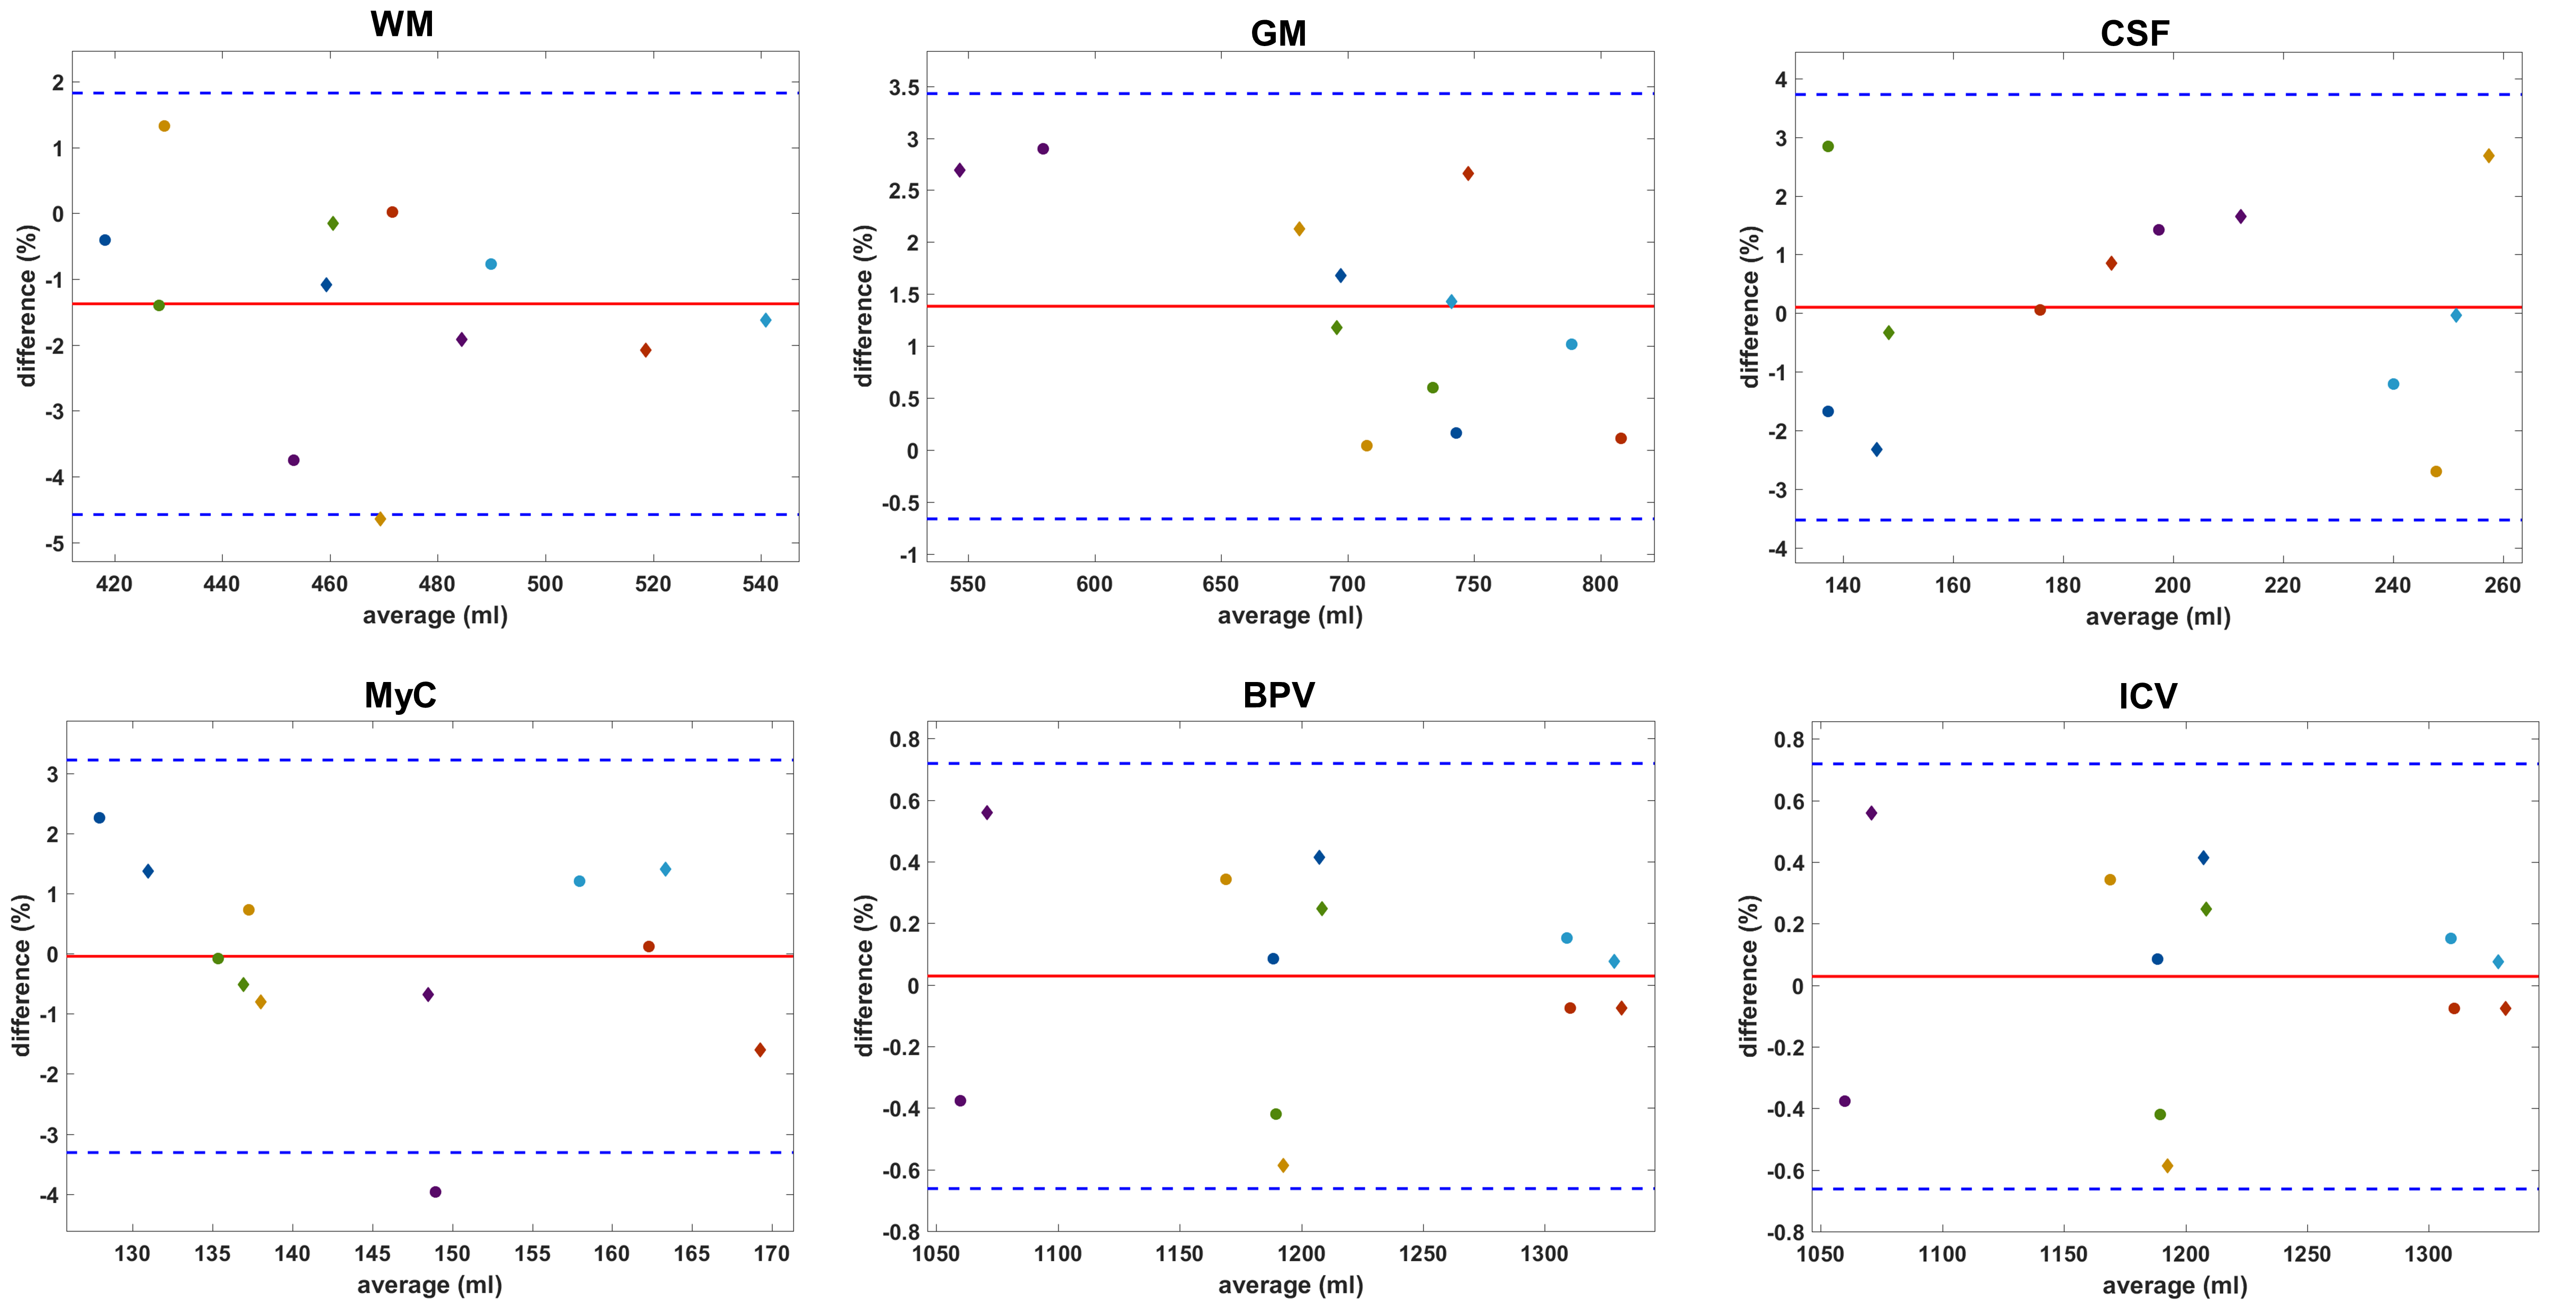
Figure 1: Bland-Altman plots showing the test-retest results, with different colours denoting different volunteers. The red line indicates the average difference (bias), the blue dotted lines are the limits of agreement, at bias ± 1.96 x standard deviation. Diamonds indicate the GE measurements, circles are used for Philips. The biases are <1.5%, indicating excellent test-retest variability, with the limits of agreement for BPV and ICV being <1.0% and well under 5% for the other segments.