2794
Psychophysical evaluation of radiologic vs. deep-learning based identification of multiple sclerosis brain lesions1Biomedical Engineering, Tel Aviv University, Tel Aviv, Israel, 2Department of Diagnostic Imaging, Sheba Medical Center, Ramat Gan, Israel, 3Tel Aviv University, Tel Aviv, Israel, 4Brain Imaging Research Center, Soroka Medical Center, Beer Sheva, Israel, 5University Medical Center, Ben Gurion University, Beer Sheva, Israel, 6Center for Advanced Imaging Innovation and Research (CAI2R), New-York University Langone Medical Center, New York, NY, United States, 7Sagol School of Neuroscience, Tel Aviv University, Tel Aviv, Israel
Synopsis
Computer assisted detection (CAD) of pathology in MRI scans may provide higher sensitivity to tissue changes. We present rigorous comparison of CAD vs. conventional radiologic evaluation of multiple sclerosis (MS) lesions. A psychophysical experiment was performed, where radiologists and a deep neural-network were asked to detect artificial MS lesions, synthetically simulated on T2-weighted FLAIR images, and at 8 levels of severity. Odds ratio analysis indicated that the human vision is less sensitive to low-severity lesions. This suggests that CAD can improve early detection of tissue abnormalities in the brain.
Introduction
MRI diagnosis is traditionally done via a time-consuming visual interpretation of contrast-weighted images. Visual detection, however, is limited to changes covering large enough tissue regions, and above a certain level of severity. New tools for diagnosis are constantly underway.A key aspect of assessing new diagnostic tools is testing whether they improve sensitivity to pathological changes. Previous works compared human visual analysis with computer aided diagnosis (CAD) where ground truth was available using other diagnostic modalities1; evaluated performance of radiologists2; and evaluated the utility of CAD, where ground truth was based on radiologist readings3.
In this work, a psychophysical test was performed where visual radiologic detection of multiple sclerosis (MS) lesions was compared to CAD using a deep neural network (DNN). Our goal was to test whether CAD can improve the detection of subtle tissue alterations (e.g., in normal-appearing brain tissues). Inflammatory MS lesions were chosen as a model due to the relatively simple radiologic manifestation of this disease, and its known effect of elevating T2 values within white matter (WM) lesions4,5. Lesions were artificially added to synthetic FLAIR images by altering the value of the underlying T2 relaxation times in lesioned areas. The use of simulated abnormalities enabled accurate adjustment of lesions’ severity, and prior knowledge of ground truth.
Methods
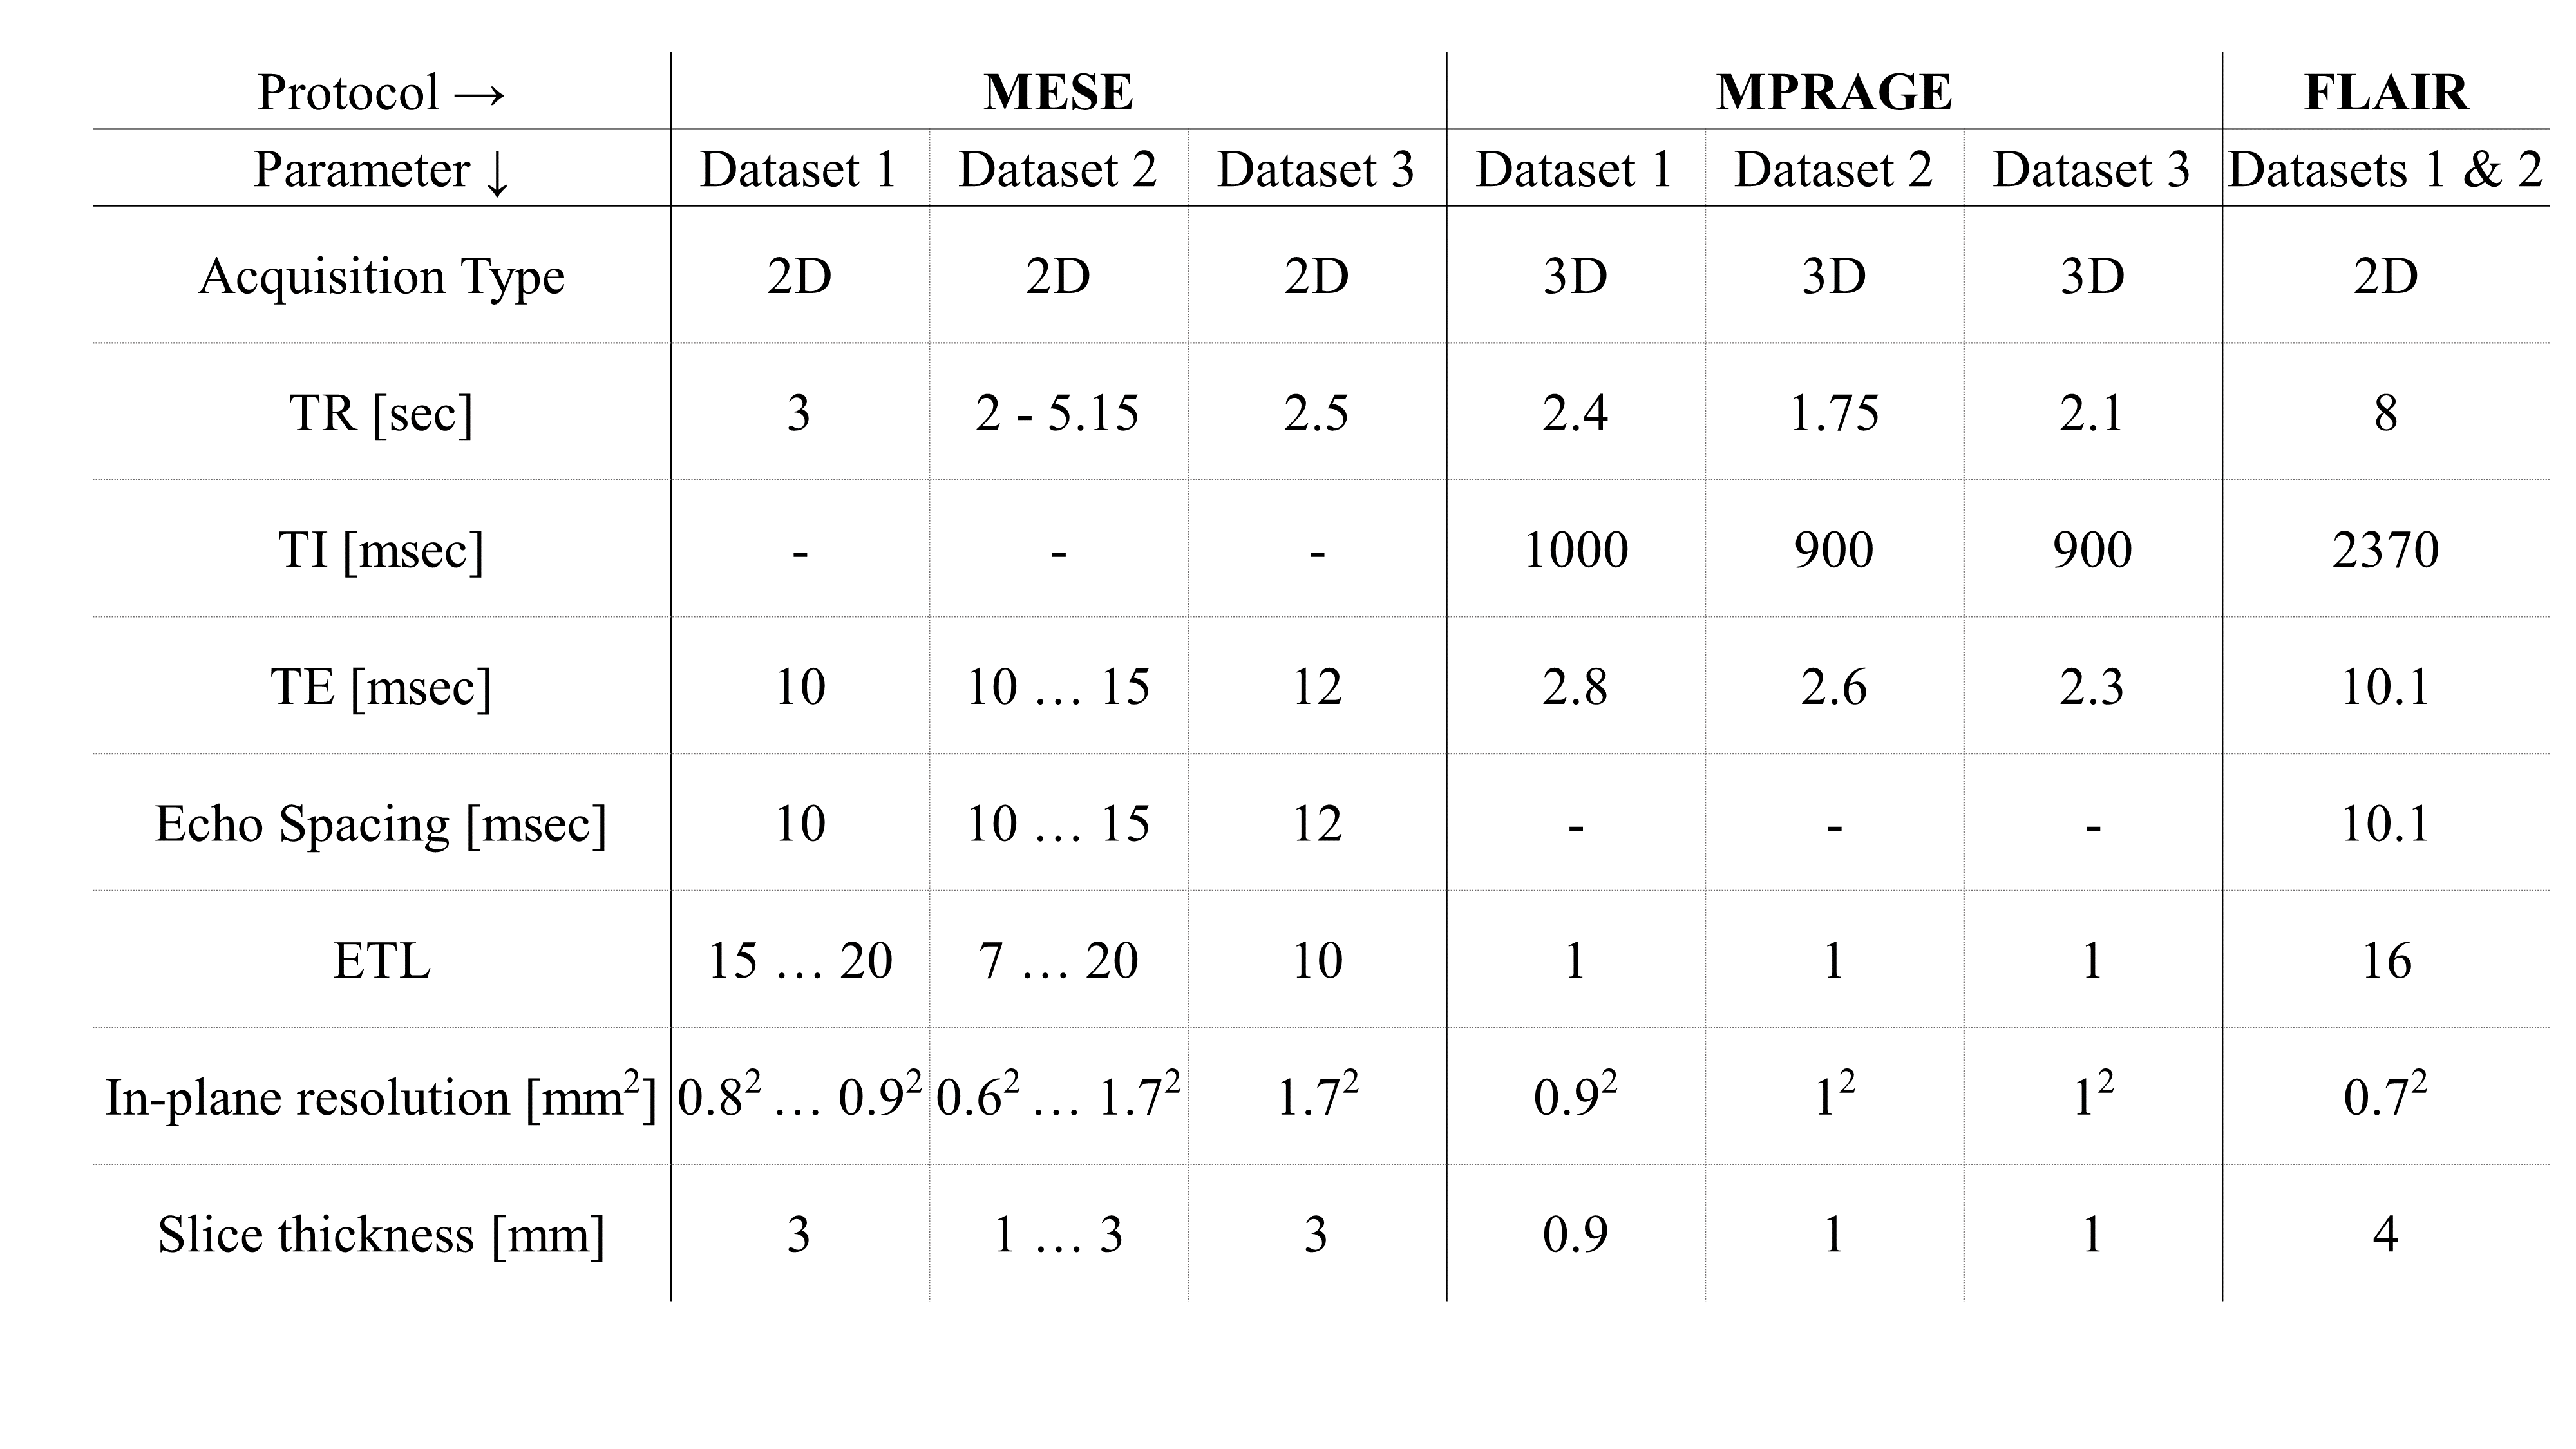
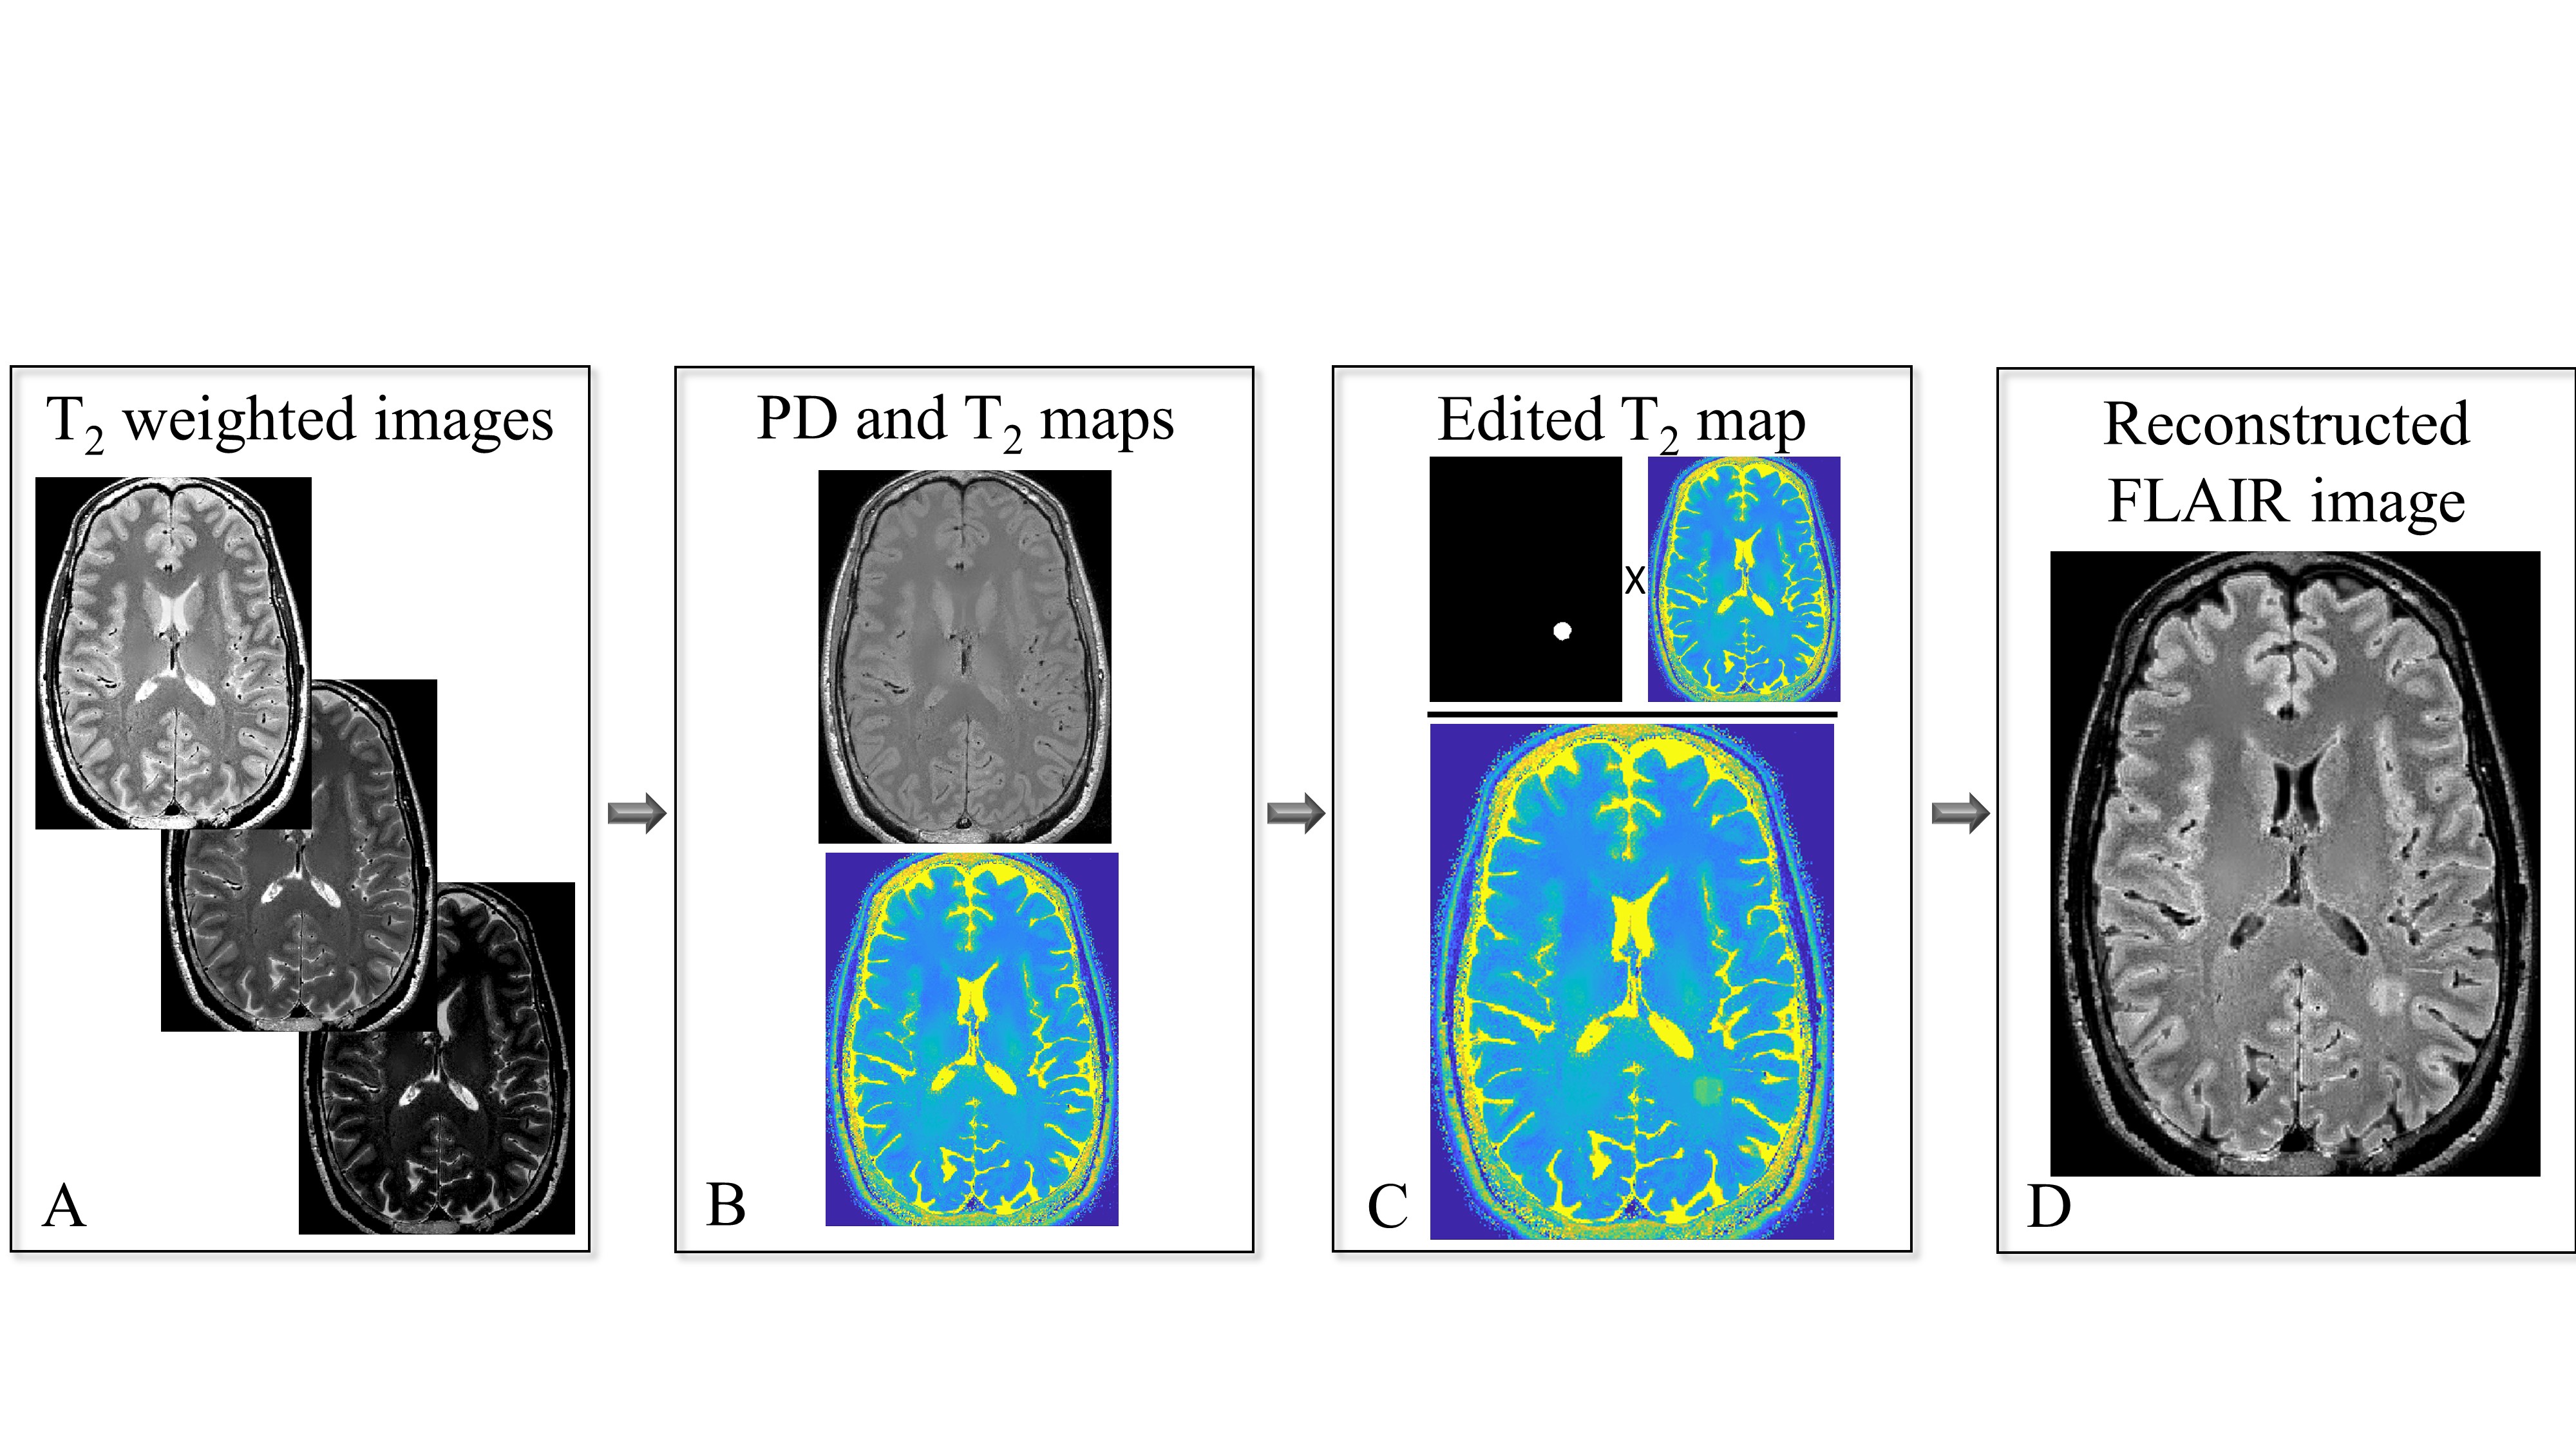
MRI scans: Data for 41 human volunteers was collected after obtaining informed consent and under the approval of the local ethics committee. Scans used a multi-echo spin-echo (MESE)6, magnetization prepared rapid gradient echo (MPRAGE)7 and FLAIR8. Additional tagged scans of MS patients were collected from a public MRI dataset of MS patients’ scans9. All scan parameters are delineated in Table 1.Data postprocessing: Quantitative T2 and PD maps were generated using a pixel-wise fitting of MESE data using the Echo-Modulation-Curve algorithm10. Volumetric segmentation of the entire WM was done on MPRAGE images using FreeSurfer software11,12. Registration of the resulting WM mask to T2 and PD maps was performed using FreeSurfer tools13.
Generation of artificial lesions on FLAIR images: FLAIR images were generated from quantitative T2 and PD maps using the analytic signal model presented in previous works14. Artificial lesions were randomly added within the WM region, by manipulating the T2 values in localized foci as is shown in Figure 1. Lesions’ shape was determined using the convex hull of randomly chosen voxels around each focal point. Eight different levels of lesion severity were simulated, corresponding to 6-30 % of change in T2 value.
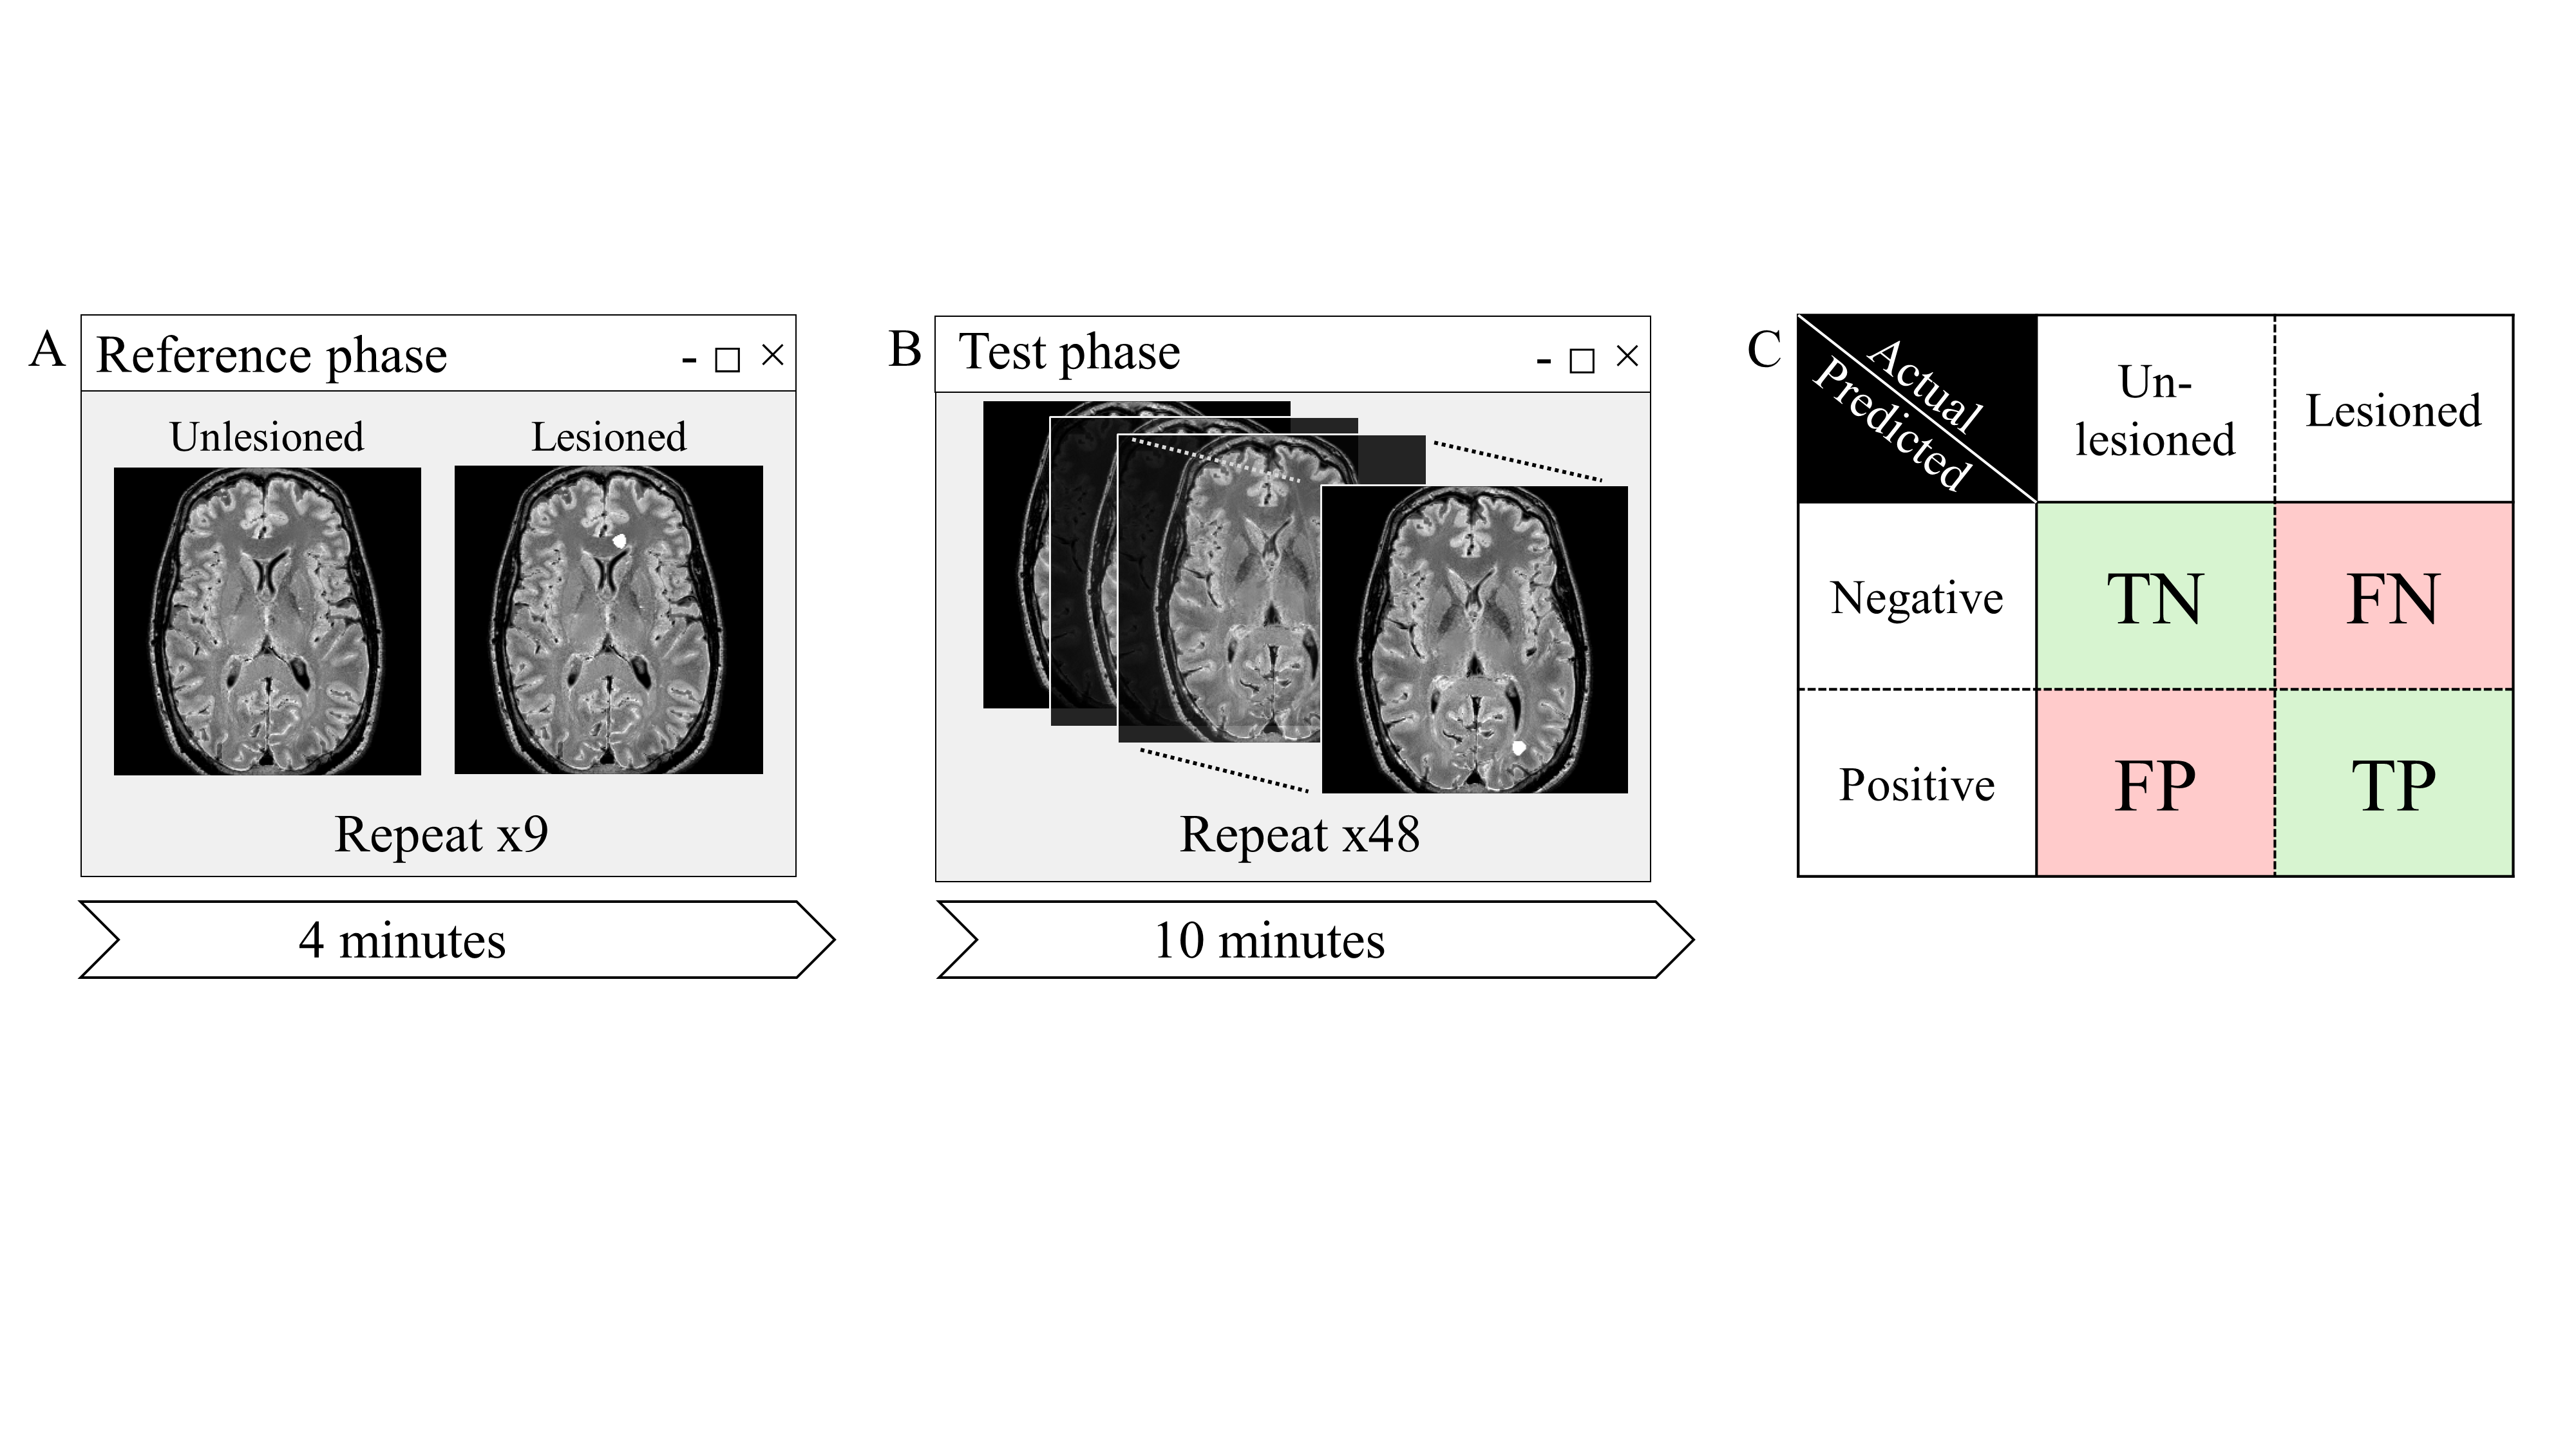
Psychophysical experiment: A two-alternative forced choice (2AFC) psychophysical trial was designed to measure radiologists’ ability to detect artificial lesions via visual inspection of FLAIR images. 25 Radiologists took part in the test (having 1-35 years of experience). All experiments were approved by the local ethics committee. Stimuli for the experiment consisted of a series of 2D synthetic FLAIR images. Two-thirds of the images contained a single, oval, hyperintense lesion, and the rest were unedited and lesion free. Participants were asked to point out lesions. Trial scheme is shown in Figure 2.
Computer-assisted diagnosis of lesions: Images from the psychophysical test were binarily classified by a DNN. Network architecture was based on Y-Net15 with an EfficientNet16 backbone containing attention layers, which allowed extraction of lesions locations, and reduced overfitting. DNN training and validations was done using a series of MS FLAIR images9, and additional synthetic FLAIR images, not included in the psychophysical test. The network was implemented using the PyTorch library and trained on a standard PC using an Nvidia GeForce GTX 1080 Ti GPU.
Statistical analysis: data was analyzed to calculate the rates of true positives (correct detections of lesions), true negatives (correct identifications of images with no lesions), false positives (incorrect detections of nonexistent lesions) and false negatives (missed lesions). To compare the performance of CAD-based detection with conventional radiological detection, odds ratios (ORs) were calculated and compared between the two approaches.
Results
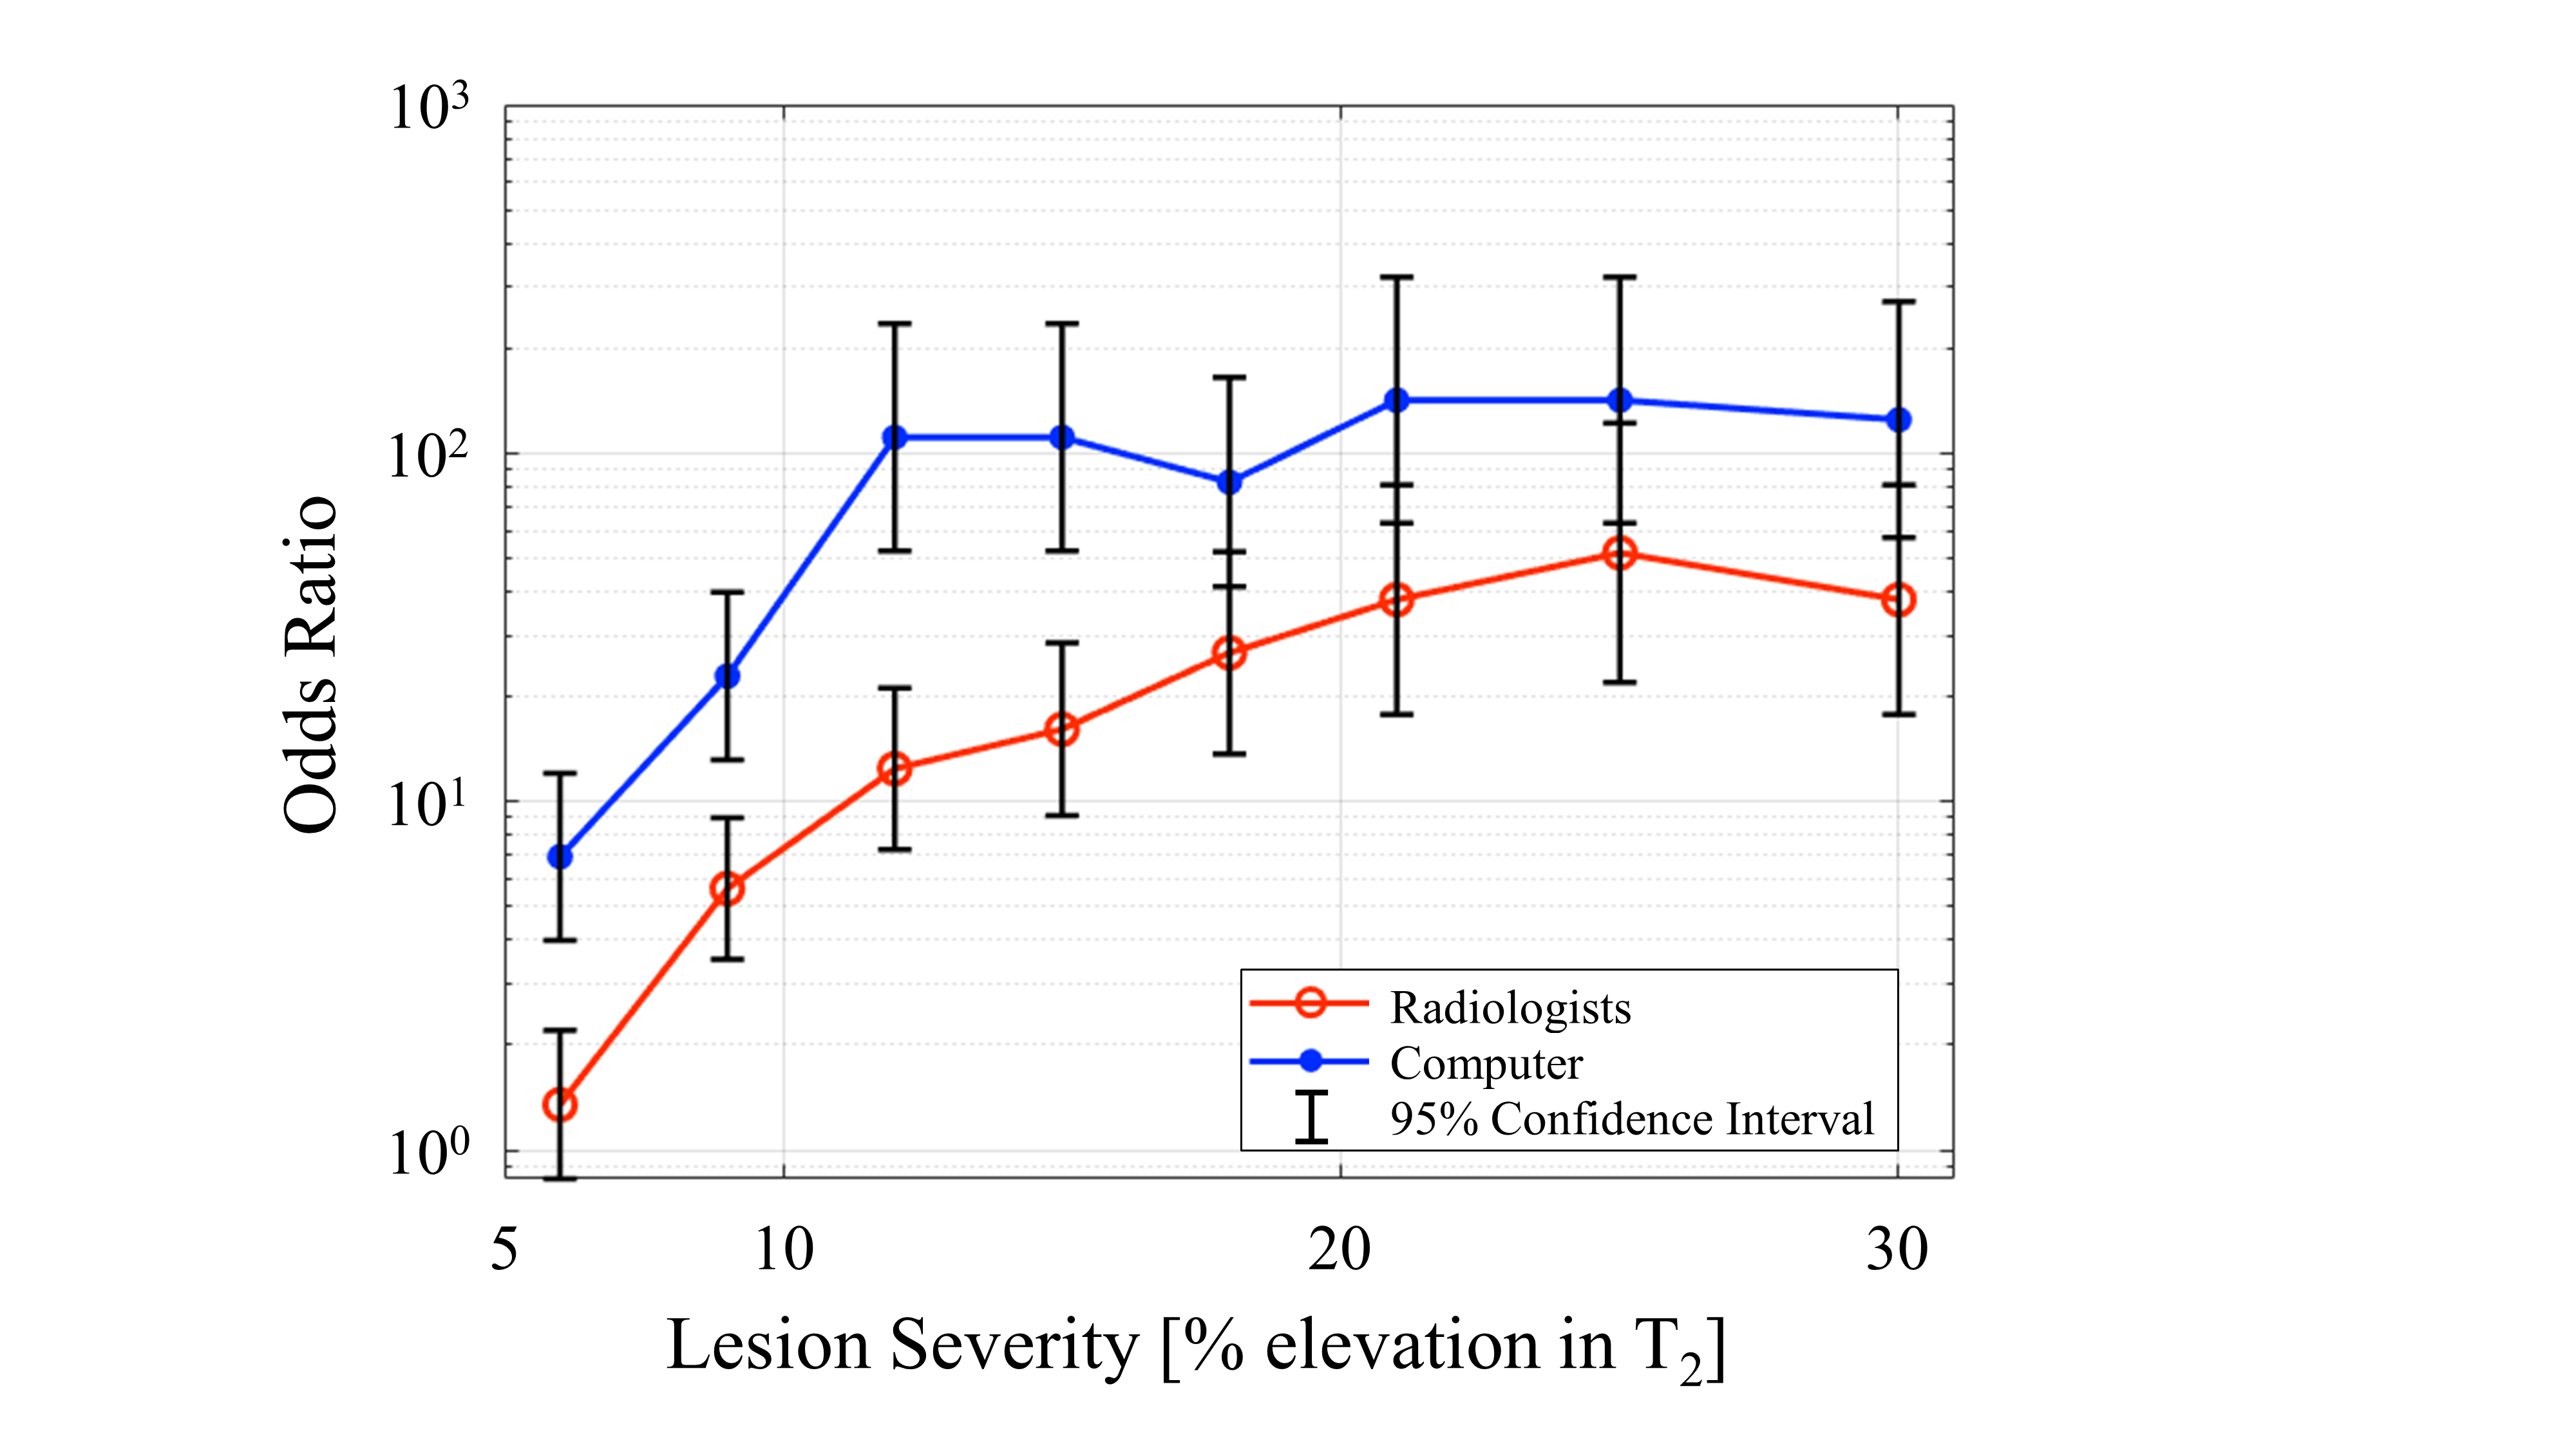
Radiologists’ response time was 5.6±3.4 seconds on average. Overall OR between radiologists and random guess were 11.45. OR between the DNN CAD tool and a random guess were 50.5. The OR of the CAD was significantly higher ( p-value<0.001). Visualization of ORs per severity level, is shown in Figure 3. Radiologists and DNN ORs’ confidence intervals did not overlap for lower severity levels (6-15 % elevation in T2 values).Discussion
This work presents a proof-of-concept for the advantage of using CAD-based detection of MS lesions. Our results show that CAD outperforms experts for lower-severity lesions and achieves comparable performance for higher severity lesions. Typical WM lesions that are obvious to radiologists are more severe (30-50 % elevation in T2, according to Shepherd et. al.17). This implies that experts’ time can be saved by embedding new, automated methods for detecting abnormalities in medical images. CAD might, if incorporated carefully and gradually, lead to a more scalable, accessible, and precise diagnosis of diseases, and improve the throughput of radiologic reading. Better systems can be developed. Comparison of such systems with experts is possible using the approach presented in this work.Acknowledgements
No acknowledgement found.References
1. Freeman K, Geppert J, Stinton C, et al. Use of artificial intelligence for image analysis in breast cancer screening programmes: systematic review of test accuracy. BMJ. Published online September 1, 2021:n1872. doi:10.1136/bmj.n1872
2. Woo JH, Henry LP, Krejza J, Melhem ER. Detection of Simulated Multiple Sclerosis Lesions on T2-weighted and FLAIR Images of the Brain: Observer Performance. Radiology. 2006;241(1):206-212. doi:10.1148/radiol.2411050792
3. Gauriau R, Bizzo BC, Kitamura FC, et al. A Deep Learning–based Model for Detecting Abnormalities on Brain MR Images for Triaging: Preliminary Results from a Multisite Experience. Radiol Artif Intell. 2021;3(4):e200184. doi:10.1148/ryai.2021200184
4. Reich DS, Lucchinetti CF, Calabresi PA. Multiple Sclerosis. Longo DL, ed. N Engl J Med. 2018;378(2):169-180. doi:10.1056/NEJMra1401483
5. Filippi M, Rocca MA, Ciccarelli O, et al. MRI criteria for the diagnosis of multiple sclerosis: MAGNIMS consensus guidelines. Lancet Neurol. 2016;15(3):292-303. doi:10.1016/S1474-4422(15)00393-2
6. Feinberg DA, Mills CM, Posin JP, et al. Multiple spin-echo magnetic resonance imaging. Radiology. 1985;155(2):437-442. doi:10.1148/radiology.155.2.3983396
7. Mugler JP, Brookeman JR. Three-dimensional magnetization-prepared rapid gradient-echo imaging (3D MP RAGE). Magn Reson Med. 1990;15(1):152-157. doi:10.1002/mrm.1910150117
8. Hajnal J V., Bryant DJ, Kasuboski L, et al. Use of Fluid Attenuated Inversion Recovery (FLAIR) Pulse Sequences in MRI of the Brain. J Comput Assist Tomogr. 1992;16(6):841-844. doi:10.1097/00004728-199211000-00001
9. Lesjak Ž, Galimzianova A, Koren A, et al. A Novel Public MR Image Dataset of Multiple Sclerosis Patients With Lesion Segmentations Based on Multi-rater Consensus. Neuroinformatics. 2018;16(1):51-63. doi:10.1007/s12021-017-9348-7
10. Ben-Eliezer N, Sodickson DK, Block KT. Rapid and accurate T 2 mapping from multi-spin-echo data using Bloch-simulation-based reconstruction. Magn Reson Med. 2015;73(2):809-817. doi:10.1002/mrm.25156
11. Fischl B, Salat DH, Busa E, et al. Whole Brain Segmentation. Neuron. 2002;33(3):341-355. doi:10.1016/S0896-6273(02)00569-X
12. Fischl B, Salat DH, van der Kouwe AJW, et al. Sequence-independent segmentation of magnetic resonance images. Neuroimage. 2004;23:S69-S84. doi:10.1016/j.neuroimage.2004.07.016
13. Greve DN, Fischl B. Accurate and robust brain image alignment using boundary-based registration. Neuroimage. 2009;48(1):63-72. doi:10.1016/j.neuroimage.2009.06.060
14. Hagiwara A, Warntjes M, Hori M, et al. SyMRI of the Brain. Invest Radiol. 2017;52(10):647-657. doi:10.1097/RLI.0000000000000365
15. Mehta S, Mercan E, Bartlett J, Weaver D, Elmore J, Shapiro L. Y-Net: Joint Segmentation and Classification for Diagnosis of Breast Biopsy Images. In: International Conference on Medical Image Computing and Computer-Assisted Intervention. ; 2018.
16. Tan M, Le Q. EfficientNet: Rethinking Model Scaling for Convolutional Neural Networks. In: Chaudhuri K, Salakhutdinov R, eds. Proceedings of the 36th International Conference on Machine Learning. Vol 97. Proceedings of Machine Learning Research. PMLR; 2019:6105-6114. https://proceedings.mlr.press/v97/tan19a.html
17. Shepherd TM, Kirov II, Charlson E, et al. New rapid, accurate T2 quantification detects pathology in normal-appearing brain regions of relapsing-remitting MS patients. NeuroImage Clin. 2017;14:363-370. doi:10.1016/j.nicl.2017.01.029
Figures