2792
Heterogeneity of ASL perfusion MRI in low-grade paediatric glioma as imaging biomarker to assess treatment effect
Lejla Alic1, Sanneke C Willekens1,2, Henk-Jan M.M. Mutsaerts2, Jan Petr3, Netteke A.Y.N. Schouten-van Meeteren4,5, Maarten M.H. Lequin6, and Evita E.C. Wiegers2
1Magnetic Detection & Imaging Group, University of Twente, Enschede, Netherlands, 2Department of Radiology, University Medical Center Utrecht, Utrecht, Netherlands, 3Helmholtz-Zentrum Dresden-Rossendorf, Institute for Radiopharmaceutical Cancer Research, Dresden, Germany, 4Radiology and Nuclear Medicine, Amsterdam Neuroscience, Amsterdam, Netherlands, 5Department of Neuro-oncology, Princess Máxima Centre, Utrecht, Netherlands, 6Radiology, University Medical Center Utrecht, Utrecht, Netherlands
1Magnetic Detection & Imaging Group, University of Twente, Enschede, Netherlands, 2Department of Radiology, University Medical Center Utrecht, Utrecht, Netherlands, 3Helmholtz-Zentrum Dresden-Rossendorf, Institute for Radiopharmaceutical Cancer Research, Dresden, Germany, 4Radiology and Nuclear Medicine, Amsterdam Neuroscience, Amsterdam, Netherlands, 5Department of Neuro-oncology, Princess Máxima Centre, Utrecht, Netherlands, 6Radiology, University Medical Center Utrecht, Utrecht, Netherlands
Synopsis
ASL-MRI is reported as an option to assess potentially heterogeneous physiological processes important for tumour treatment. Therefore, we explored the heterogeneity in normalised CBF as an imaging biomarker for assessment of treatment effect in pLGG. There is a noticeable effect of chemotherapy observed as a change in texture of healthy appearing brain tissue. A high difference in texture between treated and non-treated patients for non-enhancing tumour part is observed, suggesting that texture, based on co-occurrence matrices, is suitable as an imaging biomarker for assessment of treatment effect in pLGG.
Introduction
Paediatric low-grade gliomas (pLGG) account for 30-50% of all paediatric brain tumours1. The presentation of pLGG varies between symptomless, motor impairment, visual impairment, endocrine deficiencies, and hypothalamic failure. Consequently, primary treatment for pLGG consist of surgical resection and/or chemotherapy depending on these clinical symptoms and tumour location. Progression of residual disease can require multiple phases of chemotherapy over the years2. Despite 10-year overall survival of 85-96%, management of pLGG remains challenging3 and is considered a chronic disorder in over 50% of the cases4. Due to the underlying condition and/or treatment, the patients often suffer from functional, visual, and neurological impairment5. Arterial spin labelling (ASL) perfusion MRI assesses cerebral perfusion and is reported as an option to quantify underlying potentially heterogeneous physiological processes important in therapeutic decision making6. This study explores the heterogeneity in ASL-MRI as an imaging biomarker for assessment of treatment effect in pLGG.Methods
17 Paediatric patients with confirmed pLGG (at the following brain locations: 5 posterior fossa, 1 lateral ventricles, 8 chiasmatic, 1 suprasellar, 1 spinal cord, 1 temporal hemisphere) referred to the Princess Máxima Centre for Paediatric Oncology were included in this study: 5 untreated patients (2f/3m, age=9.4±5.0year) and 12 patients (6f/6m, age=7.3±3.4year) treated by chemotherapy. For untreated patients, MRI was acquired at baseline and for treated patients at follow-up. MRI was acquired at 1.5T or 3T Philips MRI system using a 32-channel receive head coil. Imaging protocol included a T1-weighted (T1w), T1w after gadolinium injection (T1w-c), T2-weighted (T2w), FLAIR, and pseudo-continuous ASL (PCASL). The PCASL-MRI was acquired as a 2D EPI sequence with background suppression, label duration of 1800 ms, and an initial post-label delay of 1800ms or 1525ms at 1.5T or 3T respectively. Three-step processing framework of the structural PCASL images is illustrated by flow chart in Figure 2. Pre-processing of structural MRI involved registration to T1w images, skull-stripping by SPM127, and segmentation of brain structural data of normal-appearing grey matter (NAGM) and normal-appearing white matter (NAWM). Subsequently, co-registered skull-stripped structural MR images were used to segment tumour by utilising HD-GLIO8,9 that resulted in individual tumour components: contrast enhancing (CE) and non-contrast enhancing (NCE), cyst, and necrosis. The quality of image registration and automatic tumour segmentation was assessed in a group of ten patients randomly selected from our LGG cohort. Registration was evaluated quantitatively using manual annotations of anatomical landmarks (e.g., AC and PC) and is assessed as the root mean square error (RMSE) between individual observers. Automatic tumour segmentation was compared with a manual delineation by a radiologist and quantified by DICE coefficient9. PCASL-MRI was processed by ExploreASL10 into quantitative CBF and normalised by average CBF in the HAGM, producing normalised CBF (nCBF). Treatment effect was assessed by three first order statistical (FOS) features (mean, median, standard deviation) and 22 co-occurrence texture features11-13 with a matrix size of 26 averaged over four directions. The resulting features were averaged over all slices containing the tumour and were presented separately for CE, NCE, and NAWM. A total of 25 features per ROI was ranked independently using a feature selection algorithm maximising the area between the empirical ROC curve and the classifier slope. The Wilcoxon signed-rank test was used to assess the differences between the treated and untreated patients.Results
The checkerboard view in Figure 2A illustrates an example of registration results at the ventricles level and at the tumour level. The averaged RMSE for the two anatomical landmarks is similar for all three sequences (Figure 2B). All tumour masks produced by HD-GLIO were manually post-processed. For two tumours, HD-GLIO produced a false negative segmentation for both CE and NCE tumour masks. The remaining eight tumours had an average DICE score of 0.76 for the CE tumour mask and 0.34 for the NCE tumour masks. Figure 3 illustrates the final masks (CE, NCE, NAGM, and NAWM) and nCBF-map.Considering differentiation between treated and untreated patients, none of the FOS features demonstrate significance while a number of textual features were found significant. The most potent texture feature (i.e. cluster shade) assessing the differences between treated and untreated patients showed an average change of 109% for NCE tumour mask and 18 % change in NAWM.
Discussion & Conclusions
Quantitative validation of the registration gives a lower RMSE than the size of the AC and the PC suggesting a good registration accuracy in these paediatric patients. There is a noticeable effect of chemotherapy observed as a change in texture of NAWM. This is in line with previous studies showing that chemotherapy is associated with damage of normal-tissue in the brain14. The significantly higher difference in texture between treated and untreated patients for NCE suggests that texture analysis, based on co-occurrence matrices, are suitable to quantify the change in heterogeneity and therefore could potentially serve as an imaging biomarker for assessment of treatment effect in pLGG. These conclusions are also supported by previous findings in paediatric patients after radiotherapy15.Acknowledgements
No acknowledgement found.References
- Ryall S, Tabori U, Hawkins C. Pediatric low-grade glioma in the era of molecular diagnostics. Acta Neuropathol Commun. 2020;8(1):30.
- Lassaletta A, Scheinemann K, Zelcer SM, Hukin J, Wilson BA, Jabado N, et al. Phase II Weekly Vinblastine for Chemotherapy-Naive Children With Progressive Low-Grade Glioma: A Canadian Pediatric Brain Tumor Consortium Study. J Clin Oncol. 2016;34(29):3537-43.
- de Blank P, Bandopadhayay P, Haas-Kogan D, Fouladi M, Fangusaro J. Management of pediatric low-grade glioma. Curr Opin Pediatr. 2019;31(1):21-7.
- Fangusaro J, Witt O, Hernaiz Driever P, Bag AK, de Blank P, Kadom N, et al. Response assessment in paediatric low-grade glioma: recommendations from the Response Assessment in Pediatric Neuro-Oncology (RAPNO) working group. Lancet Oncol. 2020;21(6):e305-e16.
- de Lande RSV, Maurice-Stam H, Marchal JP, Vuurden DGV, Vandertop WP, Grootenhuis MA, et al. Adaptive behavior impaired in children with low-grade glioma. Pediatr Blood Cancer. 2019;66(1):e27419.
- Carlsson J, Ren ZP, Wester K, Sundberg AL, Heldin NE, Hesselager G, et al. Planning for intracavitary anti-EGFR radionuclide therapy of gliomas. Literature review and data on EGFR expression. J Neurooncol. 2006;77(1):33-45.
- Friston KJ. Experimental design and Statistical Parametric Mapping Queen Square, London, UK WC1N 3BG University College London [Available from: https://www.fil.ion.ucl.ac.uk/spm/doc/intro/intro.pdf.
- Kickingereder P, Isensee F, Tursunova I, Petersen J, Neuberger U, Bonekamp D, et al. Automated quantitative tumour response assessment of MRI in neuro-oncology with artificial neural networks: a multicentre, retrospective study. Lancet Oncol. 2019;20(5):728-40.
- Taha AA, Hanbury A. Metrics for evaluating 3D medical image segmentation: analysis, selection, and tool. BMC Med Imaging. 2015;15:29.
- Mutsaerts H, Petr J, Groot P, Vandemaele P, Ingala S, Robertson AD, et al. ExploreASL: An image processing pipeline for multi-center ASL perfusion MRI studies. Neuroimage. 2020;219:117031.
- Haralick RM, Shanmugam K, Dinstein I. Textural Features for Image Classification. Ieee T Syst Man Cyb. 1973;Smc3(6):610-21.
- Alic L, van Vliet M, van Dijke CF, Eggermont AM, Veenland JF, Niessen WJ. Heterogeneity in DCE-MRI parametric maps: a biomarker for treatment response? Phys Med Biol. 2011;56(6):1601-16.
- Alic L, Veenland JF, van Vliet M, van Dijke CF, Eggermont AM, Niessen WJ. Quantification of heterogeneity in dynamic contrast enhanced MRI data for tumor treatment assessment. 3rd IEEE International Symposium on Biomedical Imaging: Nano to Macro; 6-9 April 2006; Arlington, VA, USA2006.
- Ahles TA, Root JC, Ryan EL. Cancer- and cancer treatment-associated cognitive change: an update on the state of the science. J Clin Oncol. 2012;30(30):3675-86.
- Li MD, Forkert ND, Kundu P, Ambler C, Lober RM, Burns TC, et al. Brain Perfusion and Diffusion Abnormalities in Children Treated for Posterior Fossa Brain Tumors. J Pediatr. 2017;185:173-80 e3.
Figures
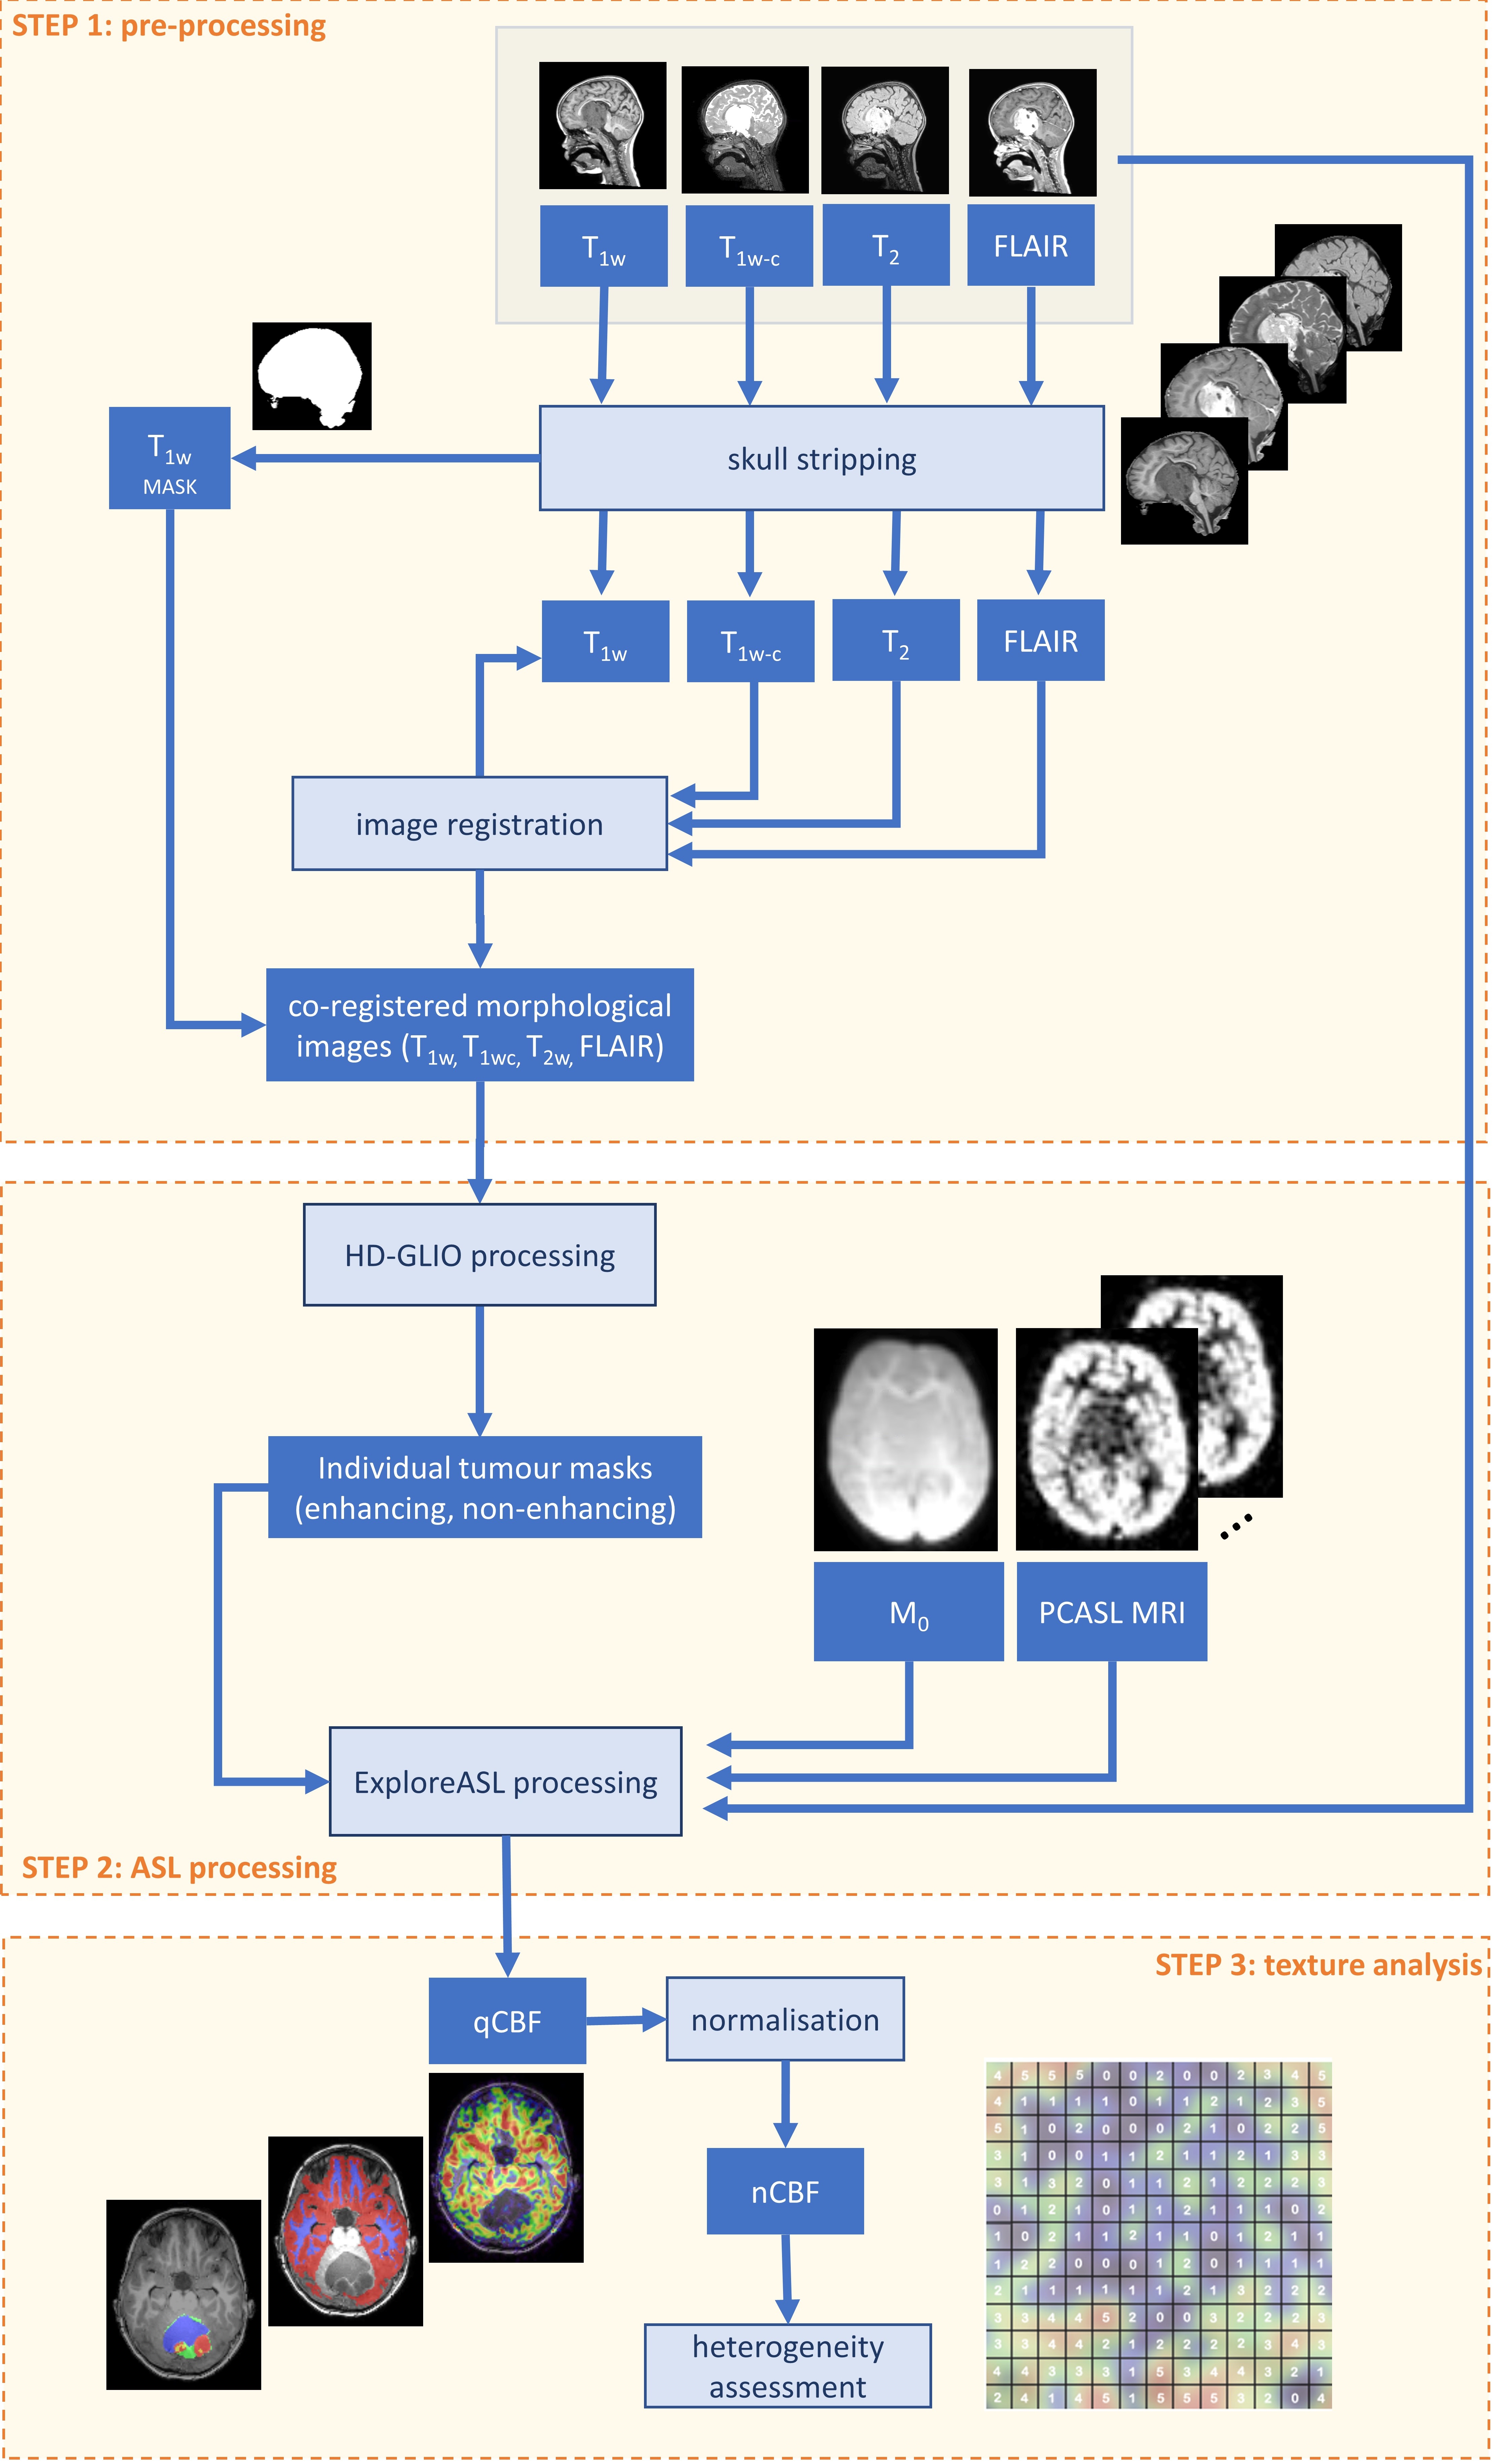
Figure 1. Flow chart illustrating the three-step processing algorithm
consisting of pre-processing (image registration, scull-stripping, and
segmentation of structural MRI), processing of PCASL MRI (tumour segmentation
and generation of qCBF-map), and texture analysis (normalisation of qCBF and
heterogeneity assessment).
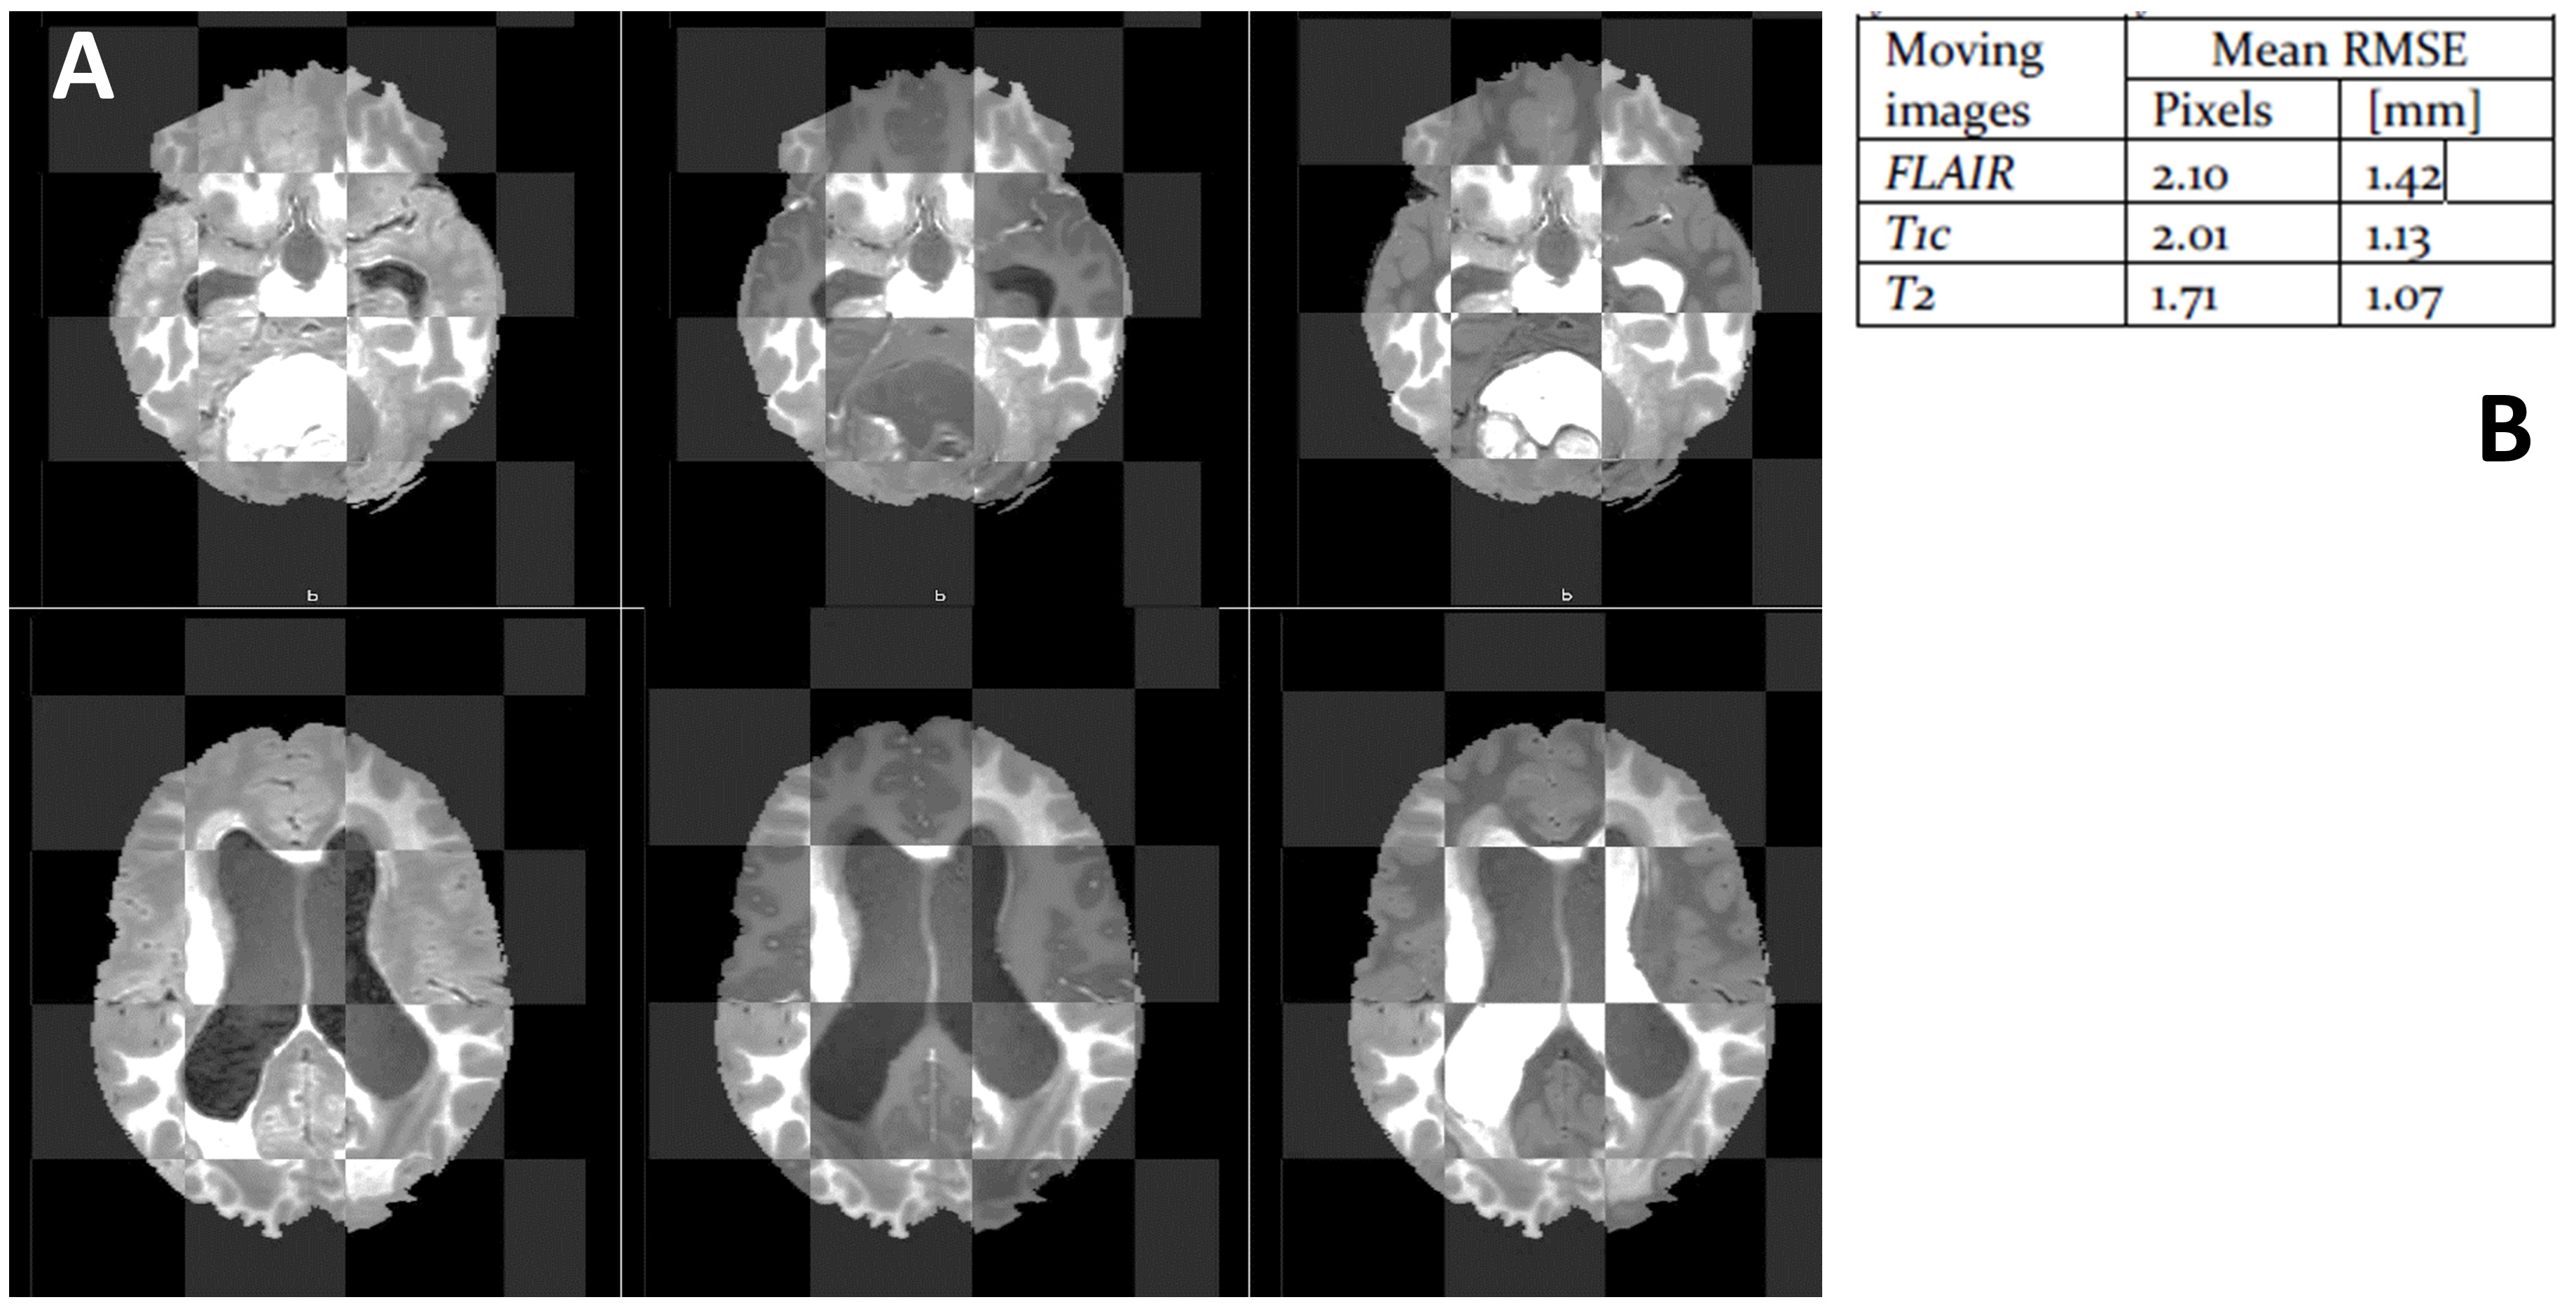
Figure 2. Final registration results illustrated by:
A: checkerboard
view at tumour level (upper panel) and at ventricle level (lower panel) between
T1w (fixed image) and following moving images: FLAIR (left column), T1c (middle
column), and T2w (right column).
B: average RMSE for two
anatomical landmarks
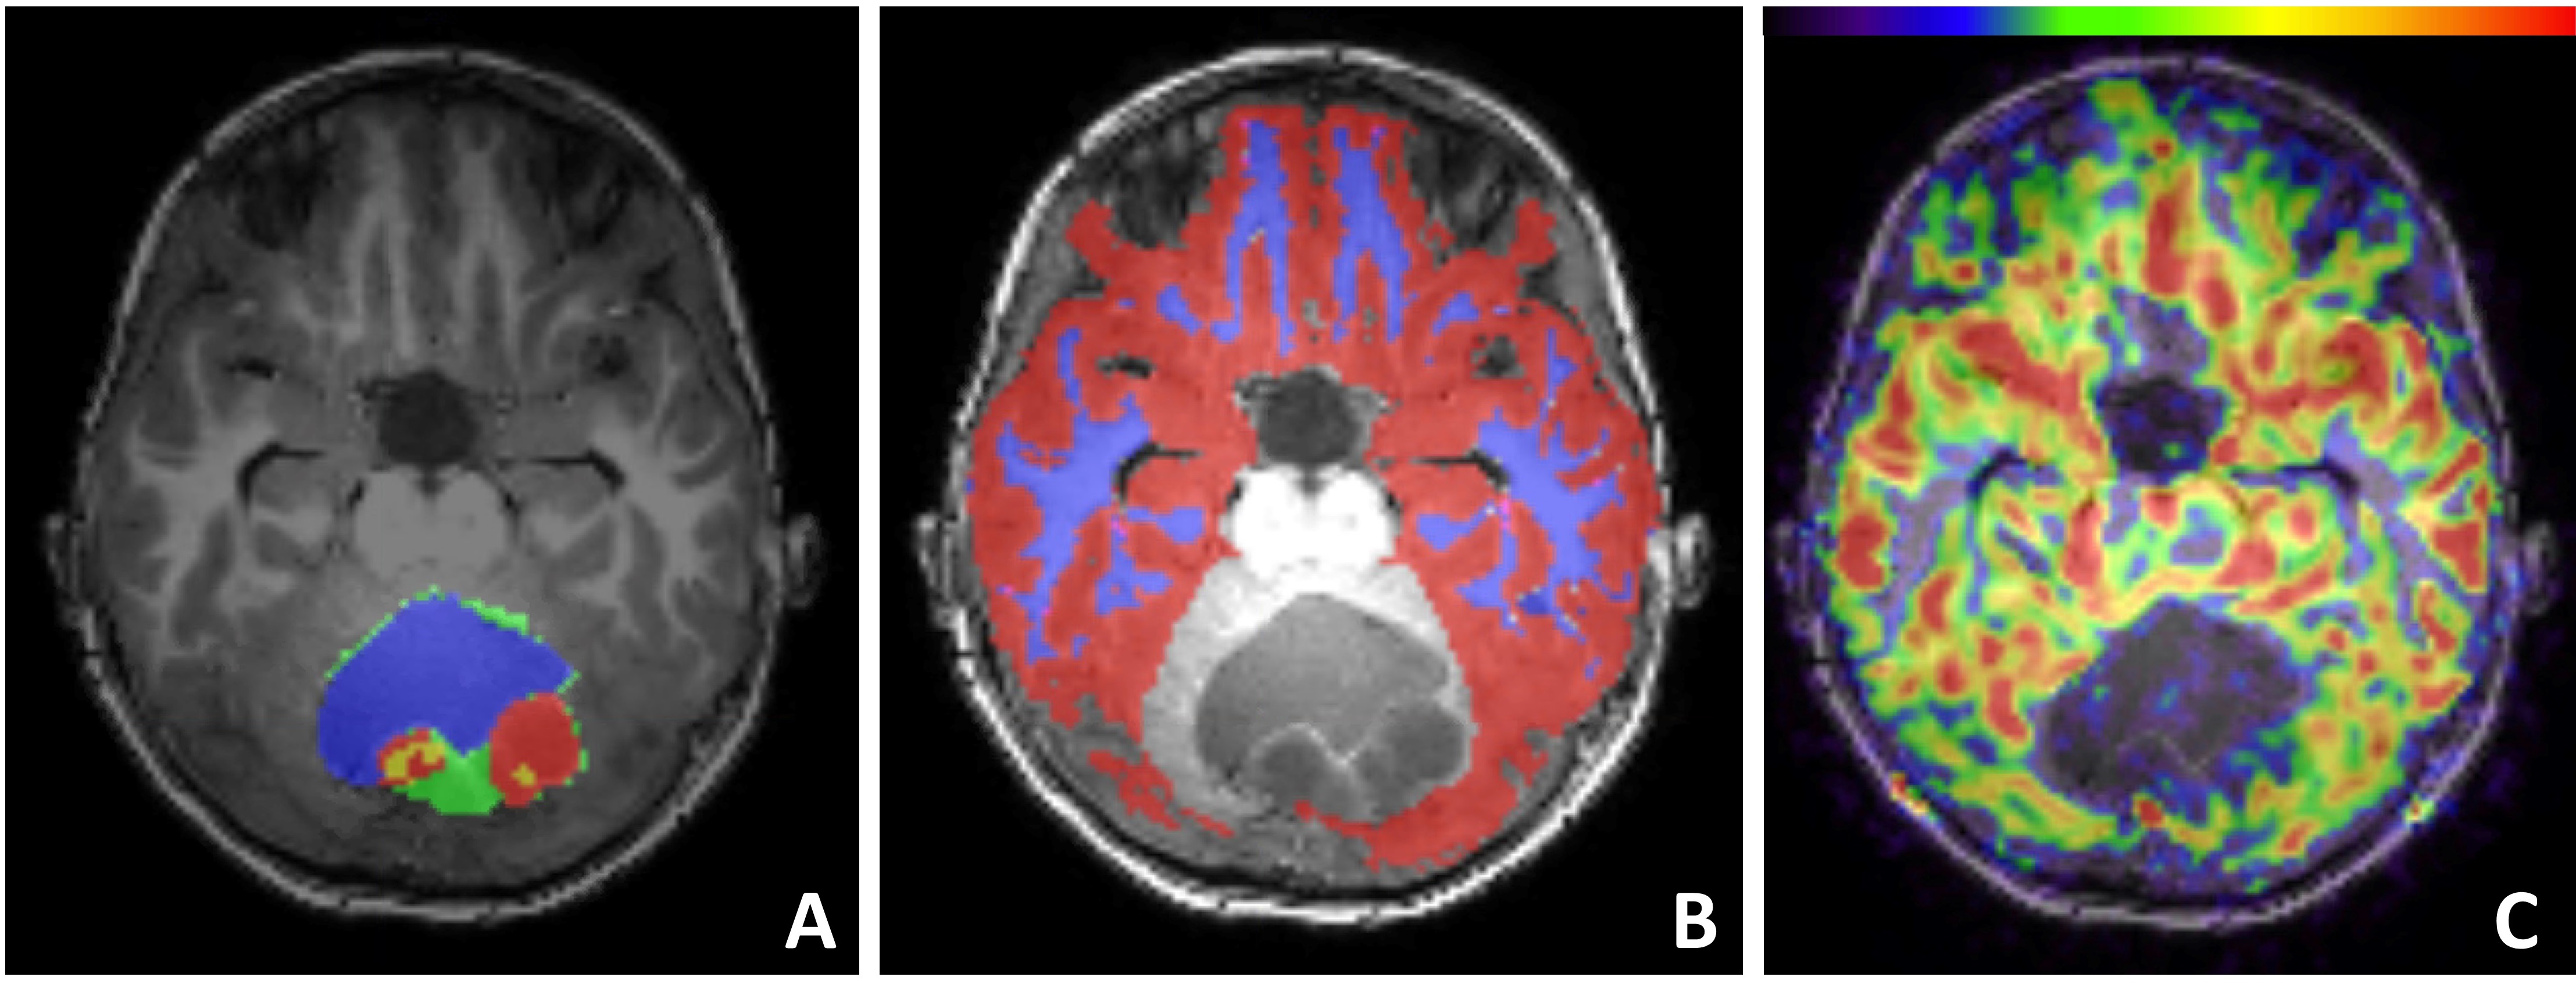
Figure 3. T1w-MRI overlaid with tumour masks (A), GM and WM mask (B), and
nCBF-map (C)
A: different tumour
masks: CE-red, NCE-green, cyst-blue, necrotic-yellow
B: two brain masks in
the supratentorial brain region: NAGM -red, and NAWM-blue
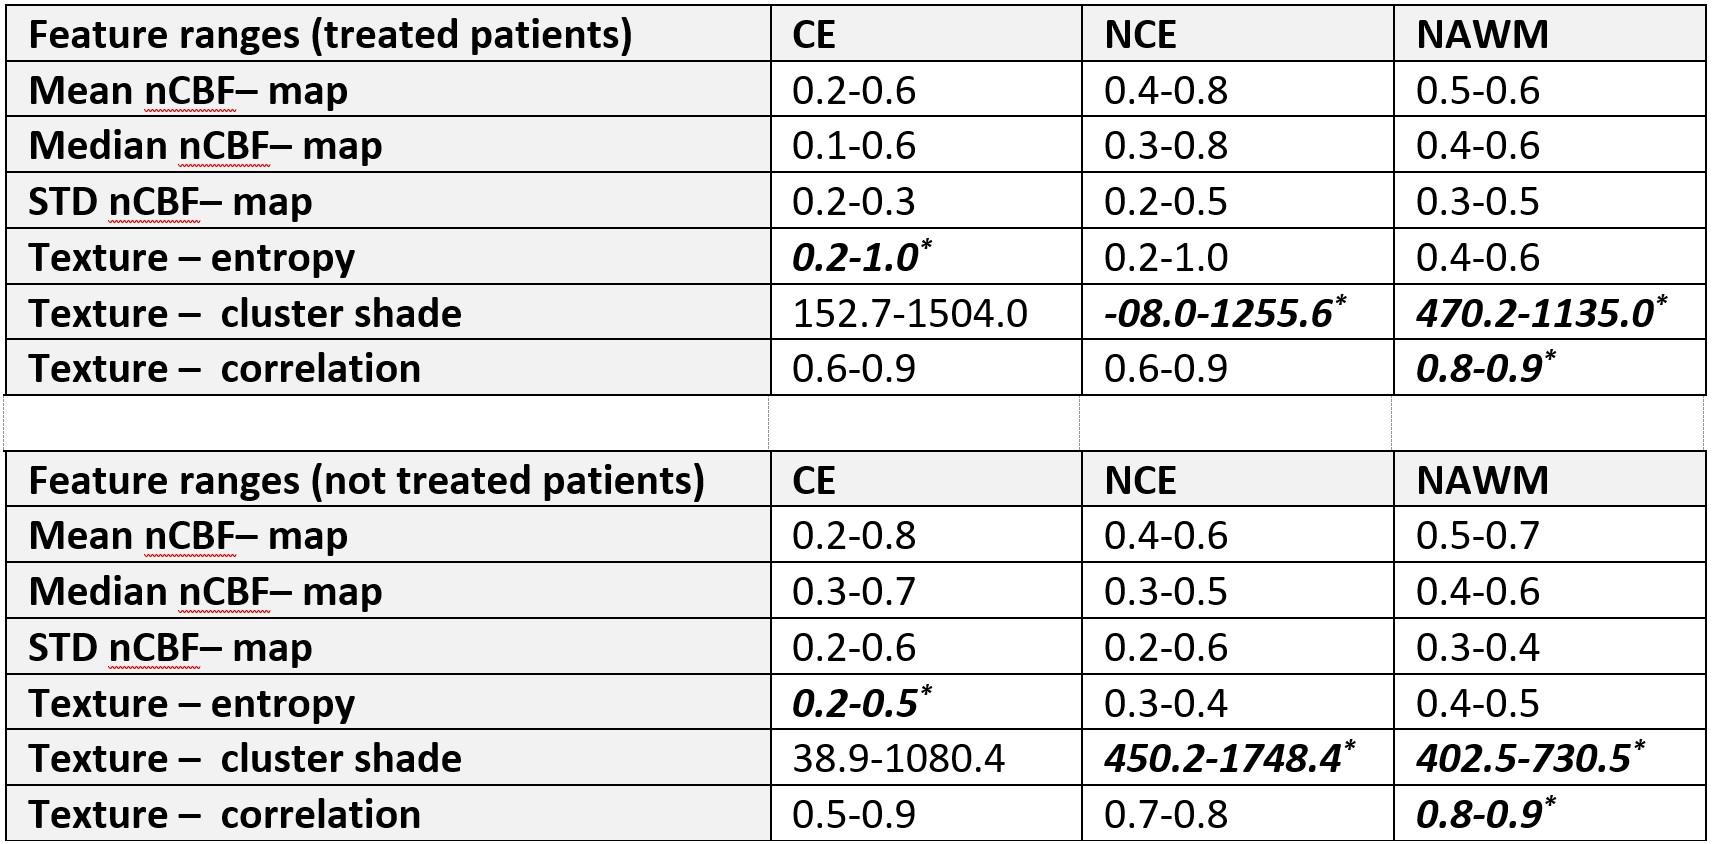
Table 1. Groupe-wise
feature ranges for treated and untreated patients. *indicate a
significant difference. CE, contrast enhancing tumour; NCE non-contrast
enhancing tumour; HAWM, healthy-appearing white matter.
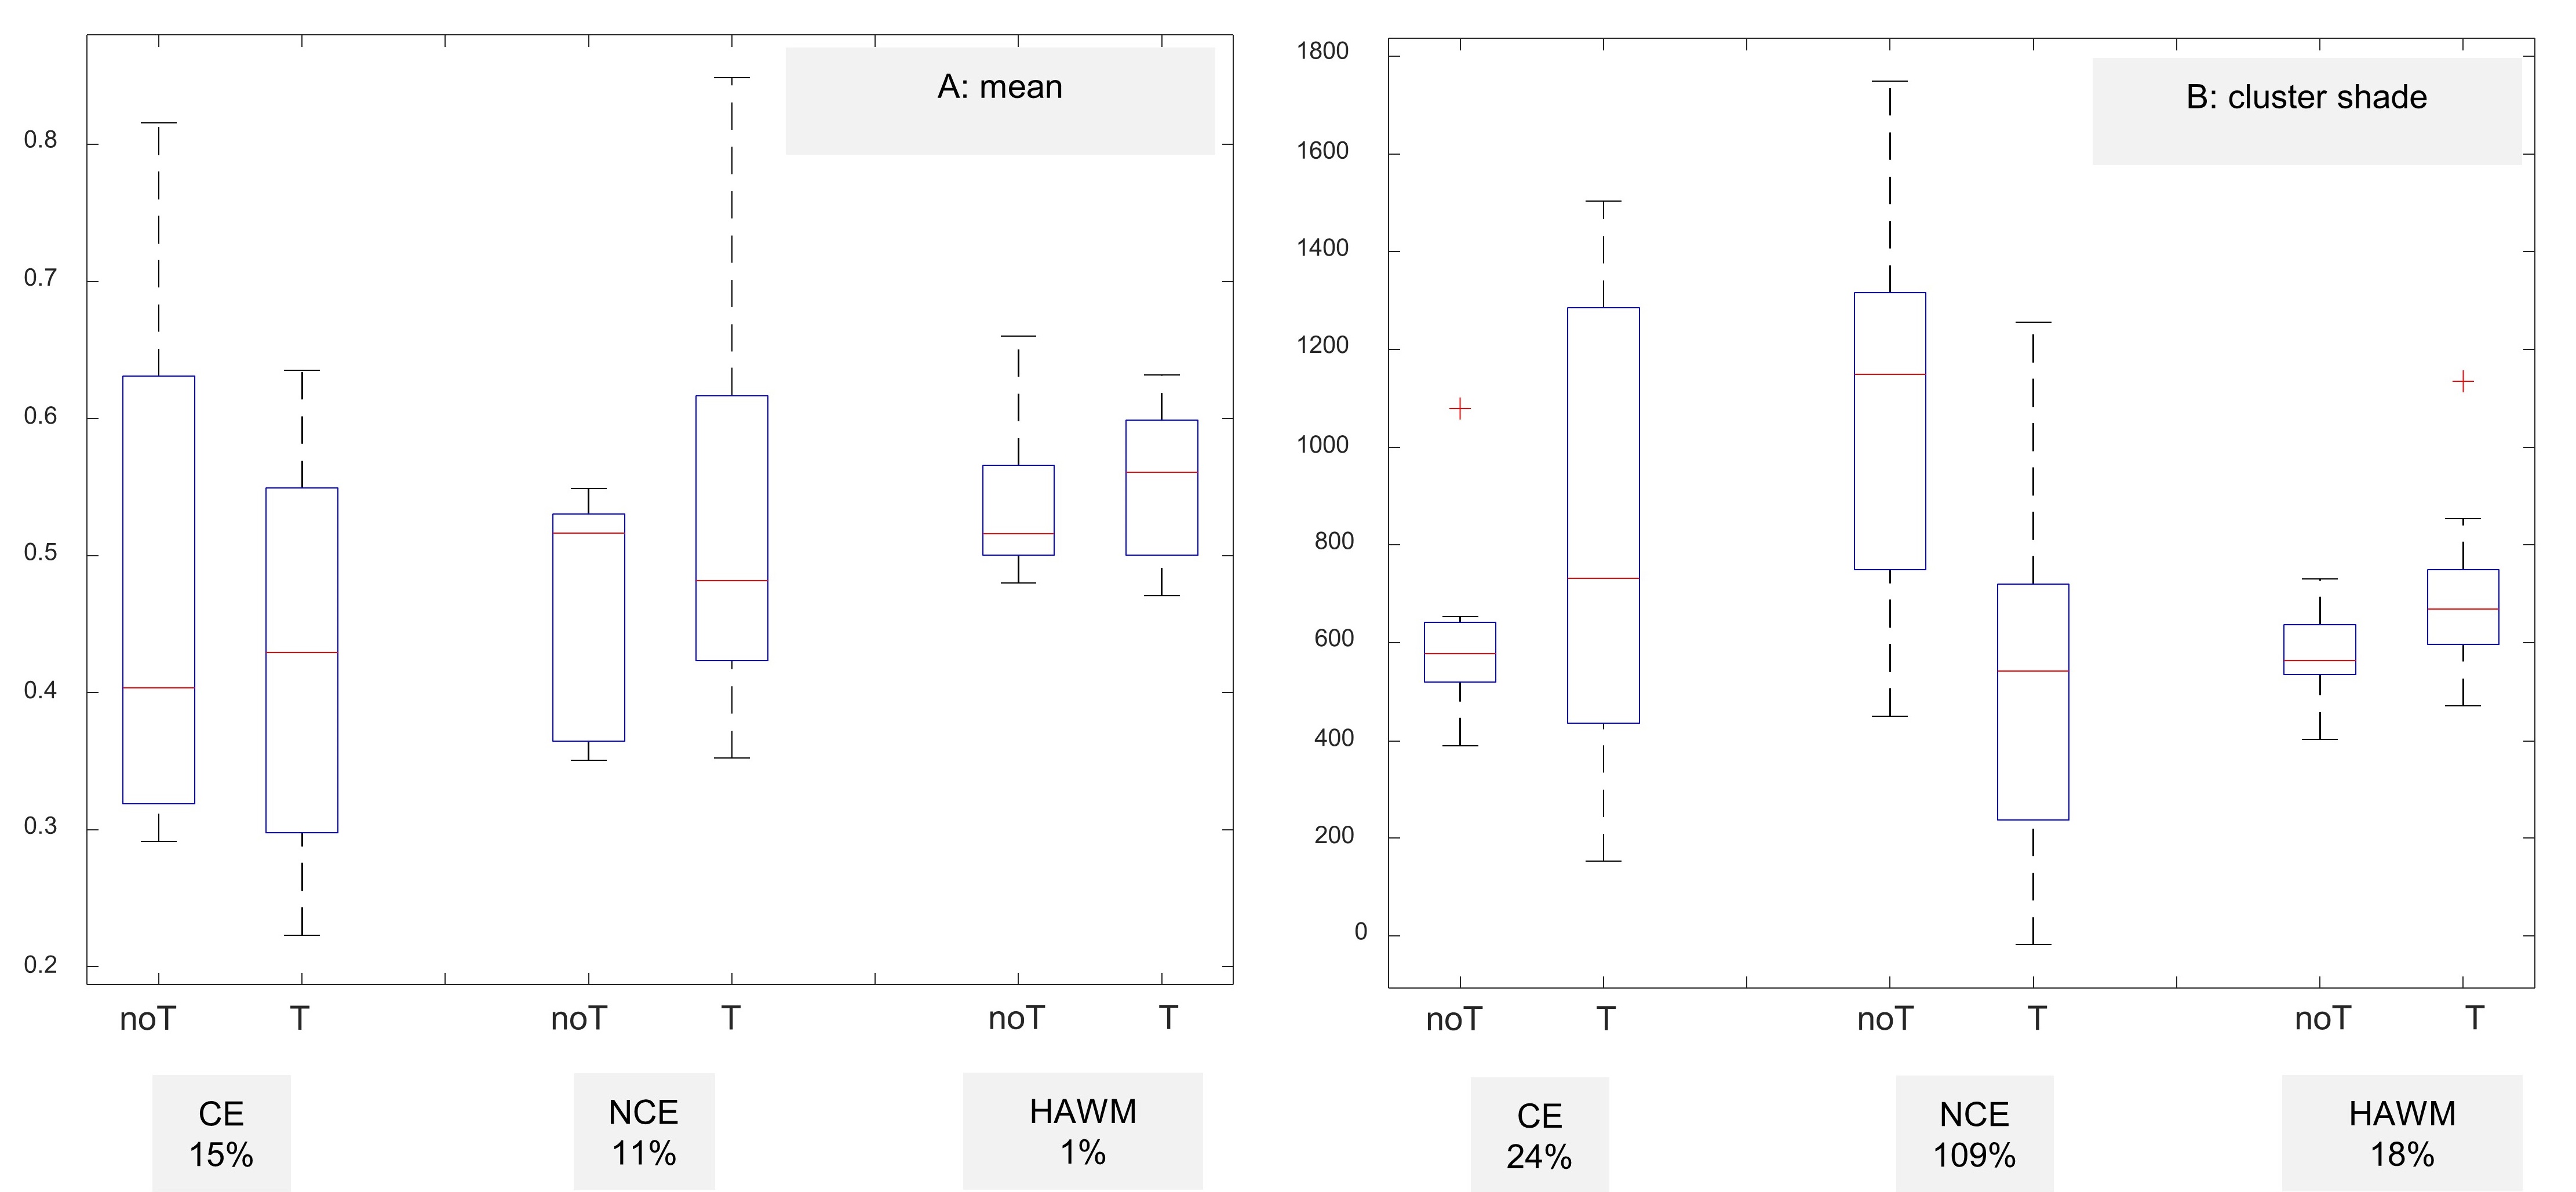
Figure 4. Boxplots illustrating the nCBF-map results as quantified by FOS
feature mean in panel A, and by texture feature cluster shade in panel B. noT, untreated patients; T, treated patients
DOI: https://doi.org/10.58530/2022/2792