2791
Quantitative Assessment of Diffusion Weighted Imaging Near Metal Implants1Hospital for Special Surgery, New York, NY, United States, 2Medical College of Wisconsin, Milwaukee, WI, United States
Synopsis
Conventional echo-planar imaging (EPI) DWI suffers from substantial artifact when imaging orthopedic hardware. DWI with multi-acquisition with variable resonance image combination (MAVRIC) can reduce susceptibility artifact around metal implants. The purpose of this work was to evaluate the quantitative accuracy of DWI-MAVRIC near metal components using a diffusion phantom. DWI-MAVRIC sequences were acquired in the presence of no metal, cobalt-chromium, titanium, and stainless steel. It was found that DWI-MAVRIC can accurately measure apparent diffusion coefficient (ADC) in the presence of metal. Among tested metals, stainless steel creates the greatest artifact that prevented the acquisition of accurate ADC data.
Introduction
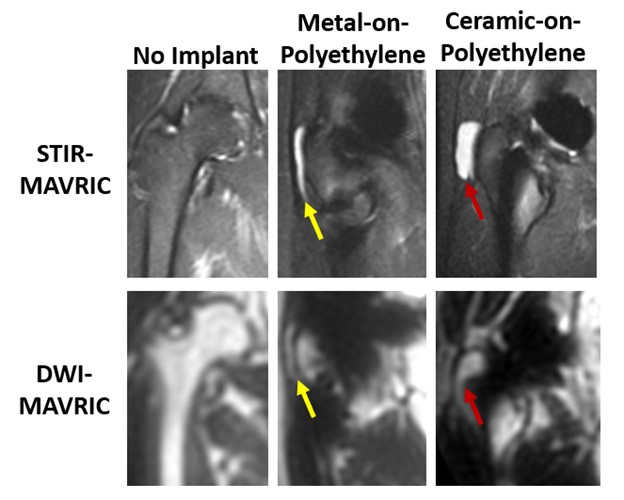
Diffusion weighted imaging (DWI) provides quantitative apparent diffusion coefficient (ADC) measurements which can be useful for imaging soft tissue1. However, the conventional echo-planar imaging (EPI) readout for DWI suffers from strong susceptibility artifacts2 when imaging near metal implants. Multi-acquisition with variable resonance image combination (MAVRIC) is a multi-spectral imaging (MSI) technique that effectively reduces susceptibility artifacts around orthopedic hardware3. Application of two-dimensional MAVRIC4 with periodically rotated overlapping parallel lines with enhanced reconstruction (PROPELLER) FSE for DWI has been demonstrated5 to complement morphological imaging with quantitative data to characterize synovitis near orthopedic implants6 (Figure 1). While the quantitative accuracy of DWI-MAVRIC has been investigated7 , the potential ADC bias when imaging near metallic components is unknown. Therefore, the purpose of this work is to evaluate the quantitative accuracy of DWI-MAVRIC when orthopaedic hardware of different metal compositions is present and to determine if spatial variability exists for ADC measurements near these metal components.Methods
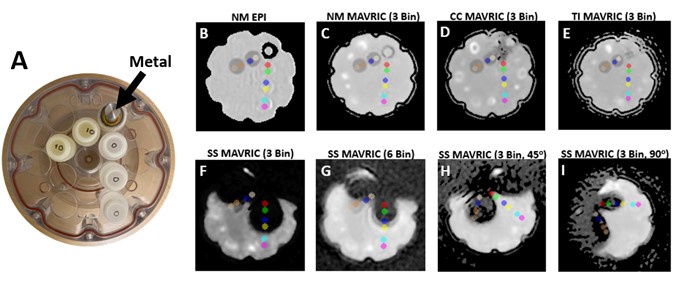
Phantom scanning was performed using a Diffusion Standard Model 128 (CaliberMRI, Boulder, CO). The phantom contained five vials of polyvinylpyrrolidone (PVP): three vials of 0% wt/wt PVP and two vials of 10% wt/wt PVP. A custom plastic holder was built to secure cylindrical metal samples of common orthopaedic metals (11 mm diameter) collinear to the five PVP vials (Figure 2). All images were acquired at iso-center on a 1.5T MRI scanner (MR450, GE Healthcare) with an 8-channel cardiac coil. Repeated DWI-EPI and DWI-MAVRIC (b= 600 s/mm2, 3 spectral bins) scans were performed in the coronal plane with different configurations of the phantom: 1. No metal present; 2. Insertion of a cobalt-chromium sample; 3. Insertion of a stainless steel sample; 4. Insertion of a titanium sample (Figure 2). The metal samples were oriented perpendicular to Bo. Additional DWI-MAVRIC (b= 600 s/mm2) acquisitions, using 1 and 6 spectral bins, were acquired only for cobalt-chromium and stainless steel samples. To evaluate angular dependence, DWI-MAVRIC (b= 600 s/mm2, 3 bins) images were acquired with the phantom rotated 45o and 90o counter-clockwise for the stainless steel sample only. The water temperature in the phantom was measured each time the metal cylinders were replaced to ensure stable vial temperature. Images were processed (MATLAB, Mathworks, Natick, MA) to generate ADC Maps with gradient nonlinearity correction (GNC)8. ADC values were obtained by placing two circular regions-of-interest (ROI) (44 voxels, 121 mm2) on each vial using ITK-SNAP9. To evaluate effects of radial dependence, the centers of the segmentation labels were placed at approximately 29, 41, 62, 75, 98, and 111 mm, respectively from the center of the metal cylinders.Results
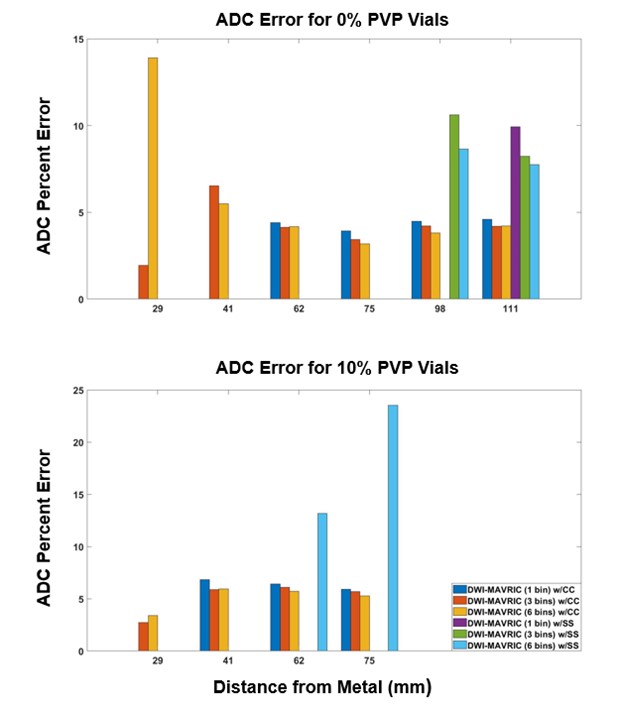
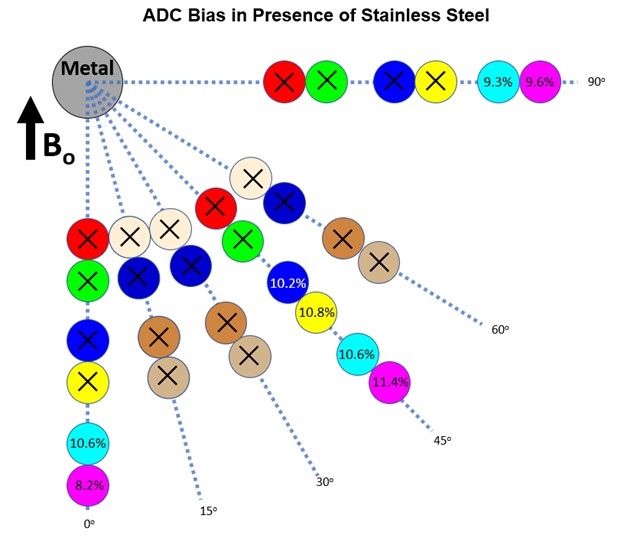
Minimal water temperature fluctuation was observed during scanning (21.92-22.28oC). The vial ADC values at a mean temperature of 22.1oC were 2171 and 1681µm2/s for the 0 and 10% PVP vials, respectively10. The DWI-EPI acquisition demonstrated the least ADC error at all distances when no metal was present (Figure 3). The DWI-MAVRIC acquisitions (3 bins) for the conditions of no metal, cobalt-chromium and titanium demonstrated consistent positive bias at all distances from the metal sample. The DWI-MAVRIC (3 bins) data for the stainless steel sample could only be evaluated at 98 and 111 mm due to signal dropout at shorter distances, and had greater ADC bias than the other configurations. ADC data could be evaluated at closer distances to the metal for cobalt-chromium and stainless steel when the number of spectral bins was increased (Figure 4). At further distances from the metal, the ADC error near cobalt-chromium was comparable for 1, 3, and 6 spectral bins. ADC could not be acquired at distances of 29 and 41 mm across all angles when using 3 bins in the presence of stainless steel (Figure 5). ADC could be acquired at 62 and 75 mm at 45o and at distances of 98 and 111 mm for angles of 0o, 45o and 90o when using 3 bins in the presence of stainless steel.Discussion
This study established radial-angular distance dependence of quantitative ADC measurements for various metal inserts when using DWI-MAVRIC. The ADC results for no metal, cobalt-chromium and titanium were in agreement with a prior study of quantitative accuracy7; this study found mean ADC error consistently around 5% between 29 and 111mm. However, for stainless steel at distances 41 mm and under, ADC data could not be evaluated. At 45o from B0, ADC could be evaluated closer to stainless steel, likely because of the known patterns of signal dropout longitudinal and transverse to B0. These findings suggest that fewer DWI-MAVRIC spectral bins may be required with cobalt-chromium and titanium implants than with stainless steel, which in turn suggests that scan times can be optimized if the implant composition is known11. This study did not evaluate sizes and shapes of implants, which also influence signal dropout. Future work will include ex vivo and in vivo validation with actual orthopedic implants, and pulse sequence modifications to reduce the scan time of DWI-MAVRIC.Conclusion
DWI-MAVRIC can accurately measure ADC in the presence of various metals. The distance and angular orientations between soft tissues and orthopedic implants should be considered when interpreting clinical ADC data obtained using DWI-MAVRIC.Acknowledgements
The authors would like to thank the MRI administrative staff and MRI technologists at Hospital for Special Surgery for their assistance in acquiring images. Research reported in this publication was supported by National Institute of Arthritis and Musculoskeletal and Skin Diseases of the National Institutes of Health under award number R01AR064840 and National Institute of Biomedical Imaging and Bioengineering of the National Institutes of Health under award number R21EB023415.The content is solely the responsibility of the authors and does not necessarily represent the official views of the NIH.References
1. Le Bihan D. Apparent diffusion coefficient and beyond : What diffusion mr imaging can tell us about tissue structure. Radiology. 2013;268(2):318-322. doi:10.1148/radiol.13130420
2. Farahani K, Sinha U, Sinha S, Chiu LC-L, Lufkin RB. Effect of field strength on susceptibility artifacts in magnetic resonance imaging. Comput Med Imaging Graph. 1990;14(6):409-413. doi:https://doi.org/10.1016/0895-6111(90)90040-I
3. Koch KM, Lorbiecki JE, Hinks RS, King KF. A multispectral three-dimensional acquisition technique for imaging near metal implants. Magn Reson Med. 2009;61(2):381-390. doi:10.1002/mrm.21856
4. Hargreaves BA, Taviani V, Litwiller D V, Yoon D. 2D multi-spectral imaging for fast MRI near metal. Magn Reson Med. 2018;79(2):968-973. doi:https://doi.org/10.1002/mrm.26724
5. Koch KM, Bhave S, Gaddipati A, et al. Multispectral diffusion-weighted imaging near metal implants. Magn Reson Med. 2018;79(2):987-993. doi:10.1002/mrm.26737
6. Gao MA, Neri JP, Lin B, et al. Diffusion MRI of THAs for the Classification of Synovial Reactions. In: ISMRM. Abstract #1243; 2021.
7. Neri JP, Koff MF, Koch KM, Tan ET. Validating the Accuracy of Multi-Spectral Metal Artifact Suppressed Diffusion-Weighted Imaging. In: ISMRM. Abstract #1753; 2021.
8. Tan ET, Marinelli L, Slavens ZW, King KF, Hardy CJ. Improved correction for gradient nonlinearity effects in diffusion-weighted imaging. J Magn Reson Imaging. 2013;38(2):448-453. doi:10.1002/jmri.23942
9. Yushkevich PA, Piven J, Hazlett HC, et al. User-guided 3D active contour segmentation of anatomical structures: significantly improved efficiency and reliability. Neuroimage. 2006;31(3):1116-1128. doi:10.1016/j.neuroimage.2006.01.015
10. Wagner F, Laun FB, Kuder TA, et al. Temperature and concentration calibration of aqueous polyvinylpyrrolidone (PVP) solutions for isotropic diffusion MRI phantoms. Benjamini D, ed. PLoS One. 2017;12(6):e0179276. doi:10.1371/journal.pone.0179276
11. Kaushik SS, Marszalkowski C, Koch KM. External calibration of the spectral coverage for three-dimensional multispectral MRI. Magn Reson Med. 2016;76(5):1494-1503. doi:10.1002/mrm.26065
Figures