2790
Reproducibility of rapid quantitative multiparameter mapping using skipped-CAIPI 3D-EPI1German Center for Neurodegenerative Diseases (DZNE), Bonn, Germany, 2Department of Physics and Astronomy, University of Bonn, Bonn, Germany
Synopsis
We investigated the reproducibility of multiparameter mapping (MPM) using multi-echo skipped-CAIPI 3D-EPI at 3T. Compared to >15 minutes of FLASH-MPM, EPI-MPM under 3 minutes achieved considerably high repeatability. In only one fifth of the total scan time of FLASH, the resulting CoVs of EPI were only 1.2-2.2 times larger than FLASH for R1, PD and MTsat, while the CoV of EPI for R2* was even smaller. Minor differences of the observed parameter estimates can be attributed to the intrinsic difference between EPI and FLASH sequence timing.
Introduction
A fast multiparameter mapping (MPM) acquisition protocol using multi-echo skipped-CAIPI 3D-EPI (SC-EPI) at 3T was previously reported and had the potential to provide high-quality R1, PD, MTsat and R2* maps at 1mm isotropic resolution without obvious artifacts within 3 minutes1. In this study, we investigated the scan-rescan repeatability of the SC-EPI-MPM protocols by comparison to FLASH.Methods
The study was conducted on a Siemens (Healthineers) Skyra 3T system using a 32 channel head receive coil. Five subjects were scanned twice, by exiting and re-entering the scanner. One set of SC-EPI T1w, PDw and MTw images was acquired with 4 TEs between 5.4ms and 29.1ms at 1mm isotropic resolution. A 16-fold segmented 2x2z1 skipped-CAIPI sampling2 was employed, resulting in EPI factor=5. Repetition time/flip angle were chosen as follows: TR/FA = 39ms/4° for PDw and 39ms/25° T1w images. MTw contrast was acquired at TR/FA = 54ms/6°. The total acquisition time is 2:55 [min:sec]. For comparison, we utilized an established MPM protocol based on a modified vendor FLASH sequence with 6 TEs up to 14.76ms3. TR/FA = 18ms/4° for PDw, 18ms/25° for T1w and 37ms/6° for MTw. The total acquisition time is 15:32 [min:sec]. One subject underwent an approximately time-matched SC-EPI session with 5 averages of SC-EPI (TM-EPI).All SC-EPI- and FLASH-MTw contrasts were acquired with Gaussian-shaped RF pulse (2kHz, 500°) applied prior to excitation pulse using a rectangular RF pulse (2.4ms duration). B1 and B0 maps were acquired simultaneously using 3DREAM4 at 4mm resolution for flip angle correction1. All parameter maps were calculated within the hMRI toolbox5 and normalized into MNI space using DARTEL tools6 in SPM. For each parameter, subject-wise coefficient of variation (CoV) maps were calculated. The root-mean-squared (RMS) CoV was calculated in various regions of interest (ROI) per subject.
Results
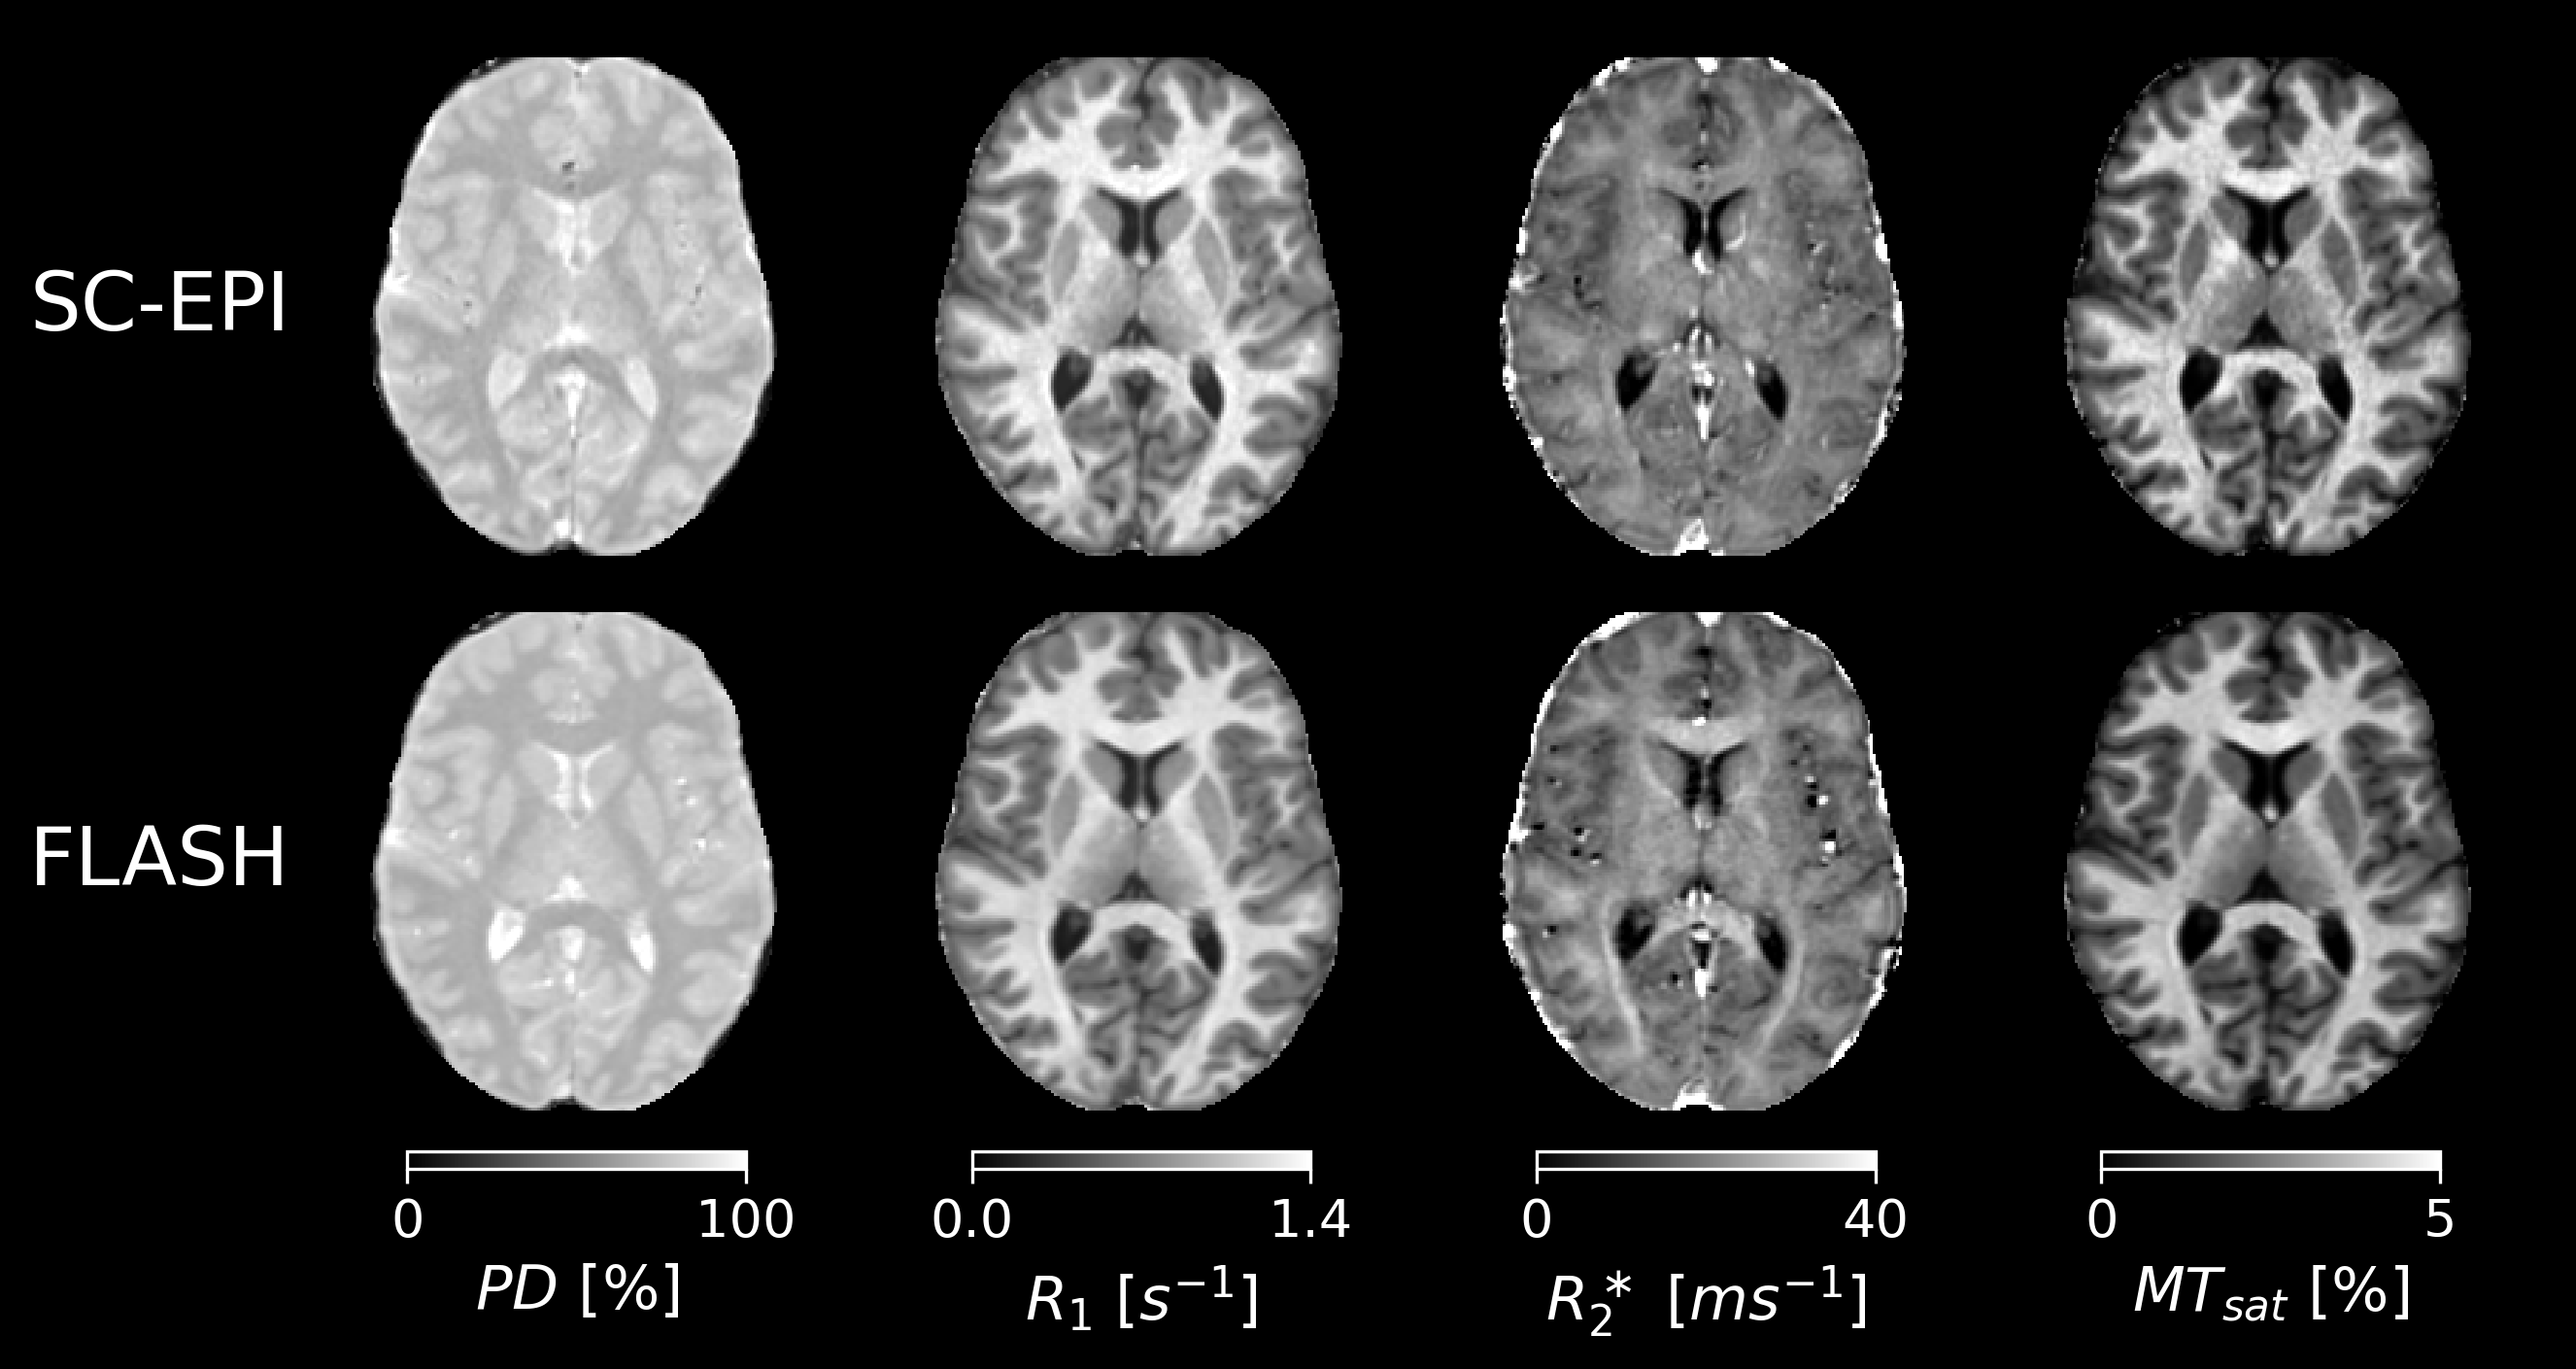
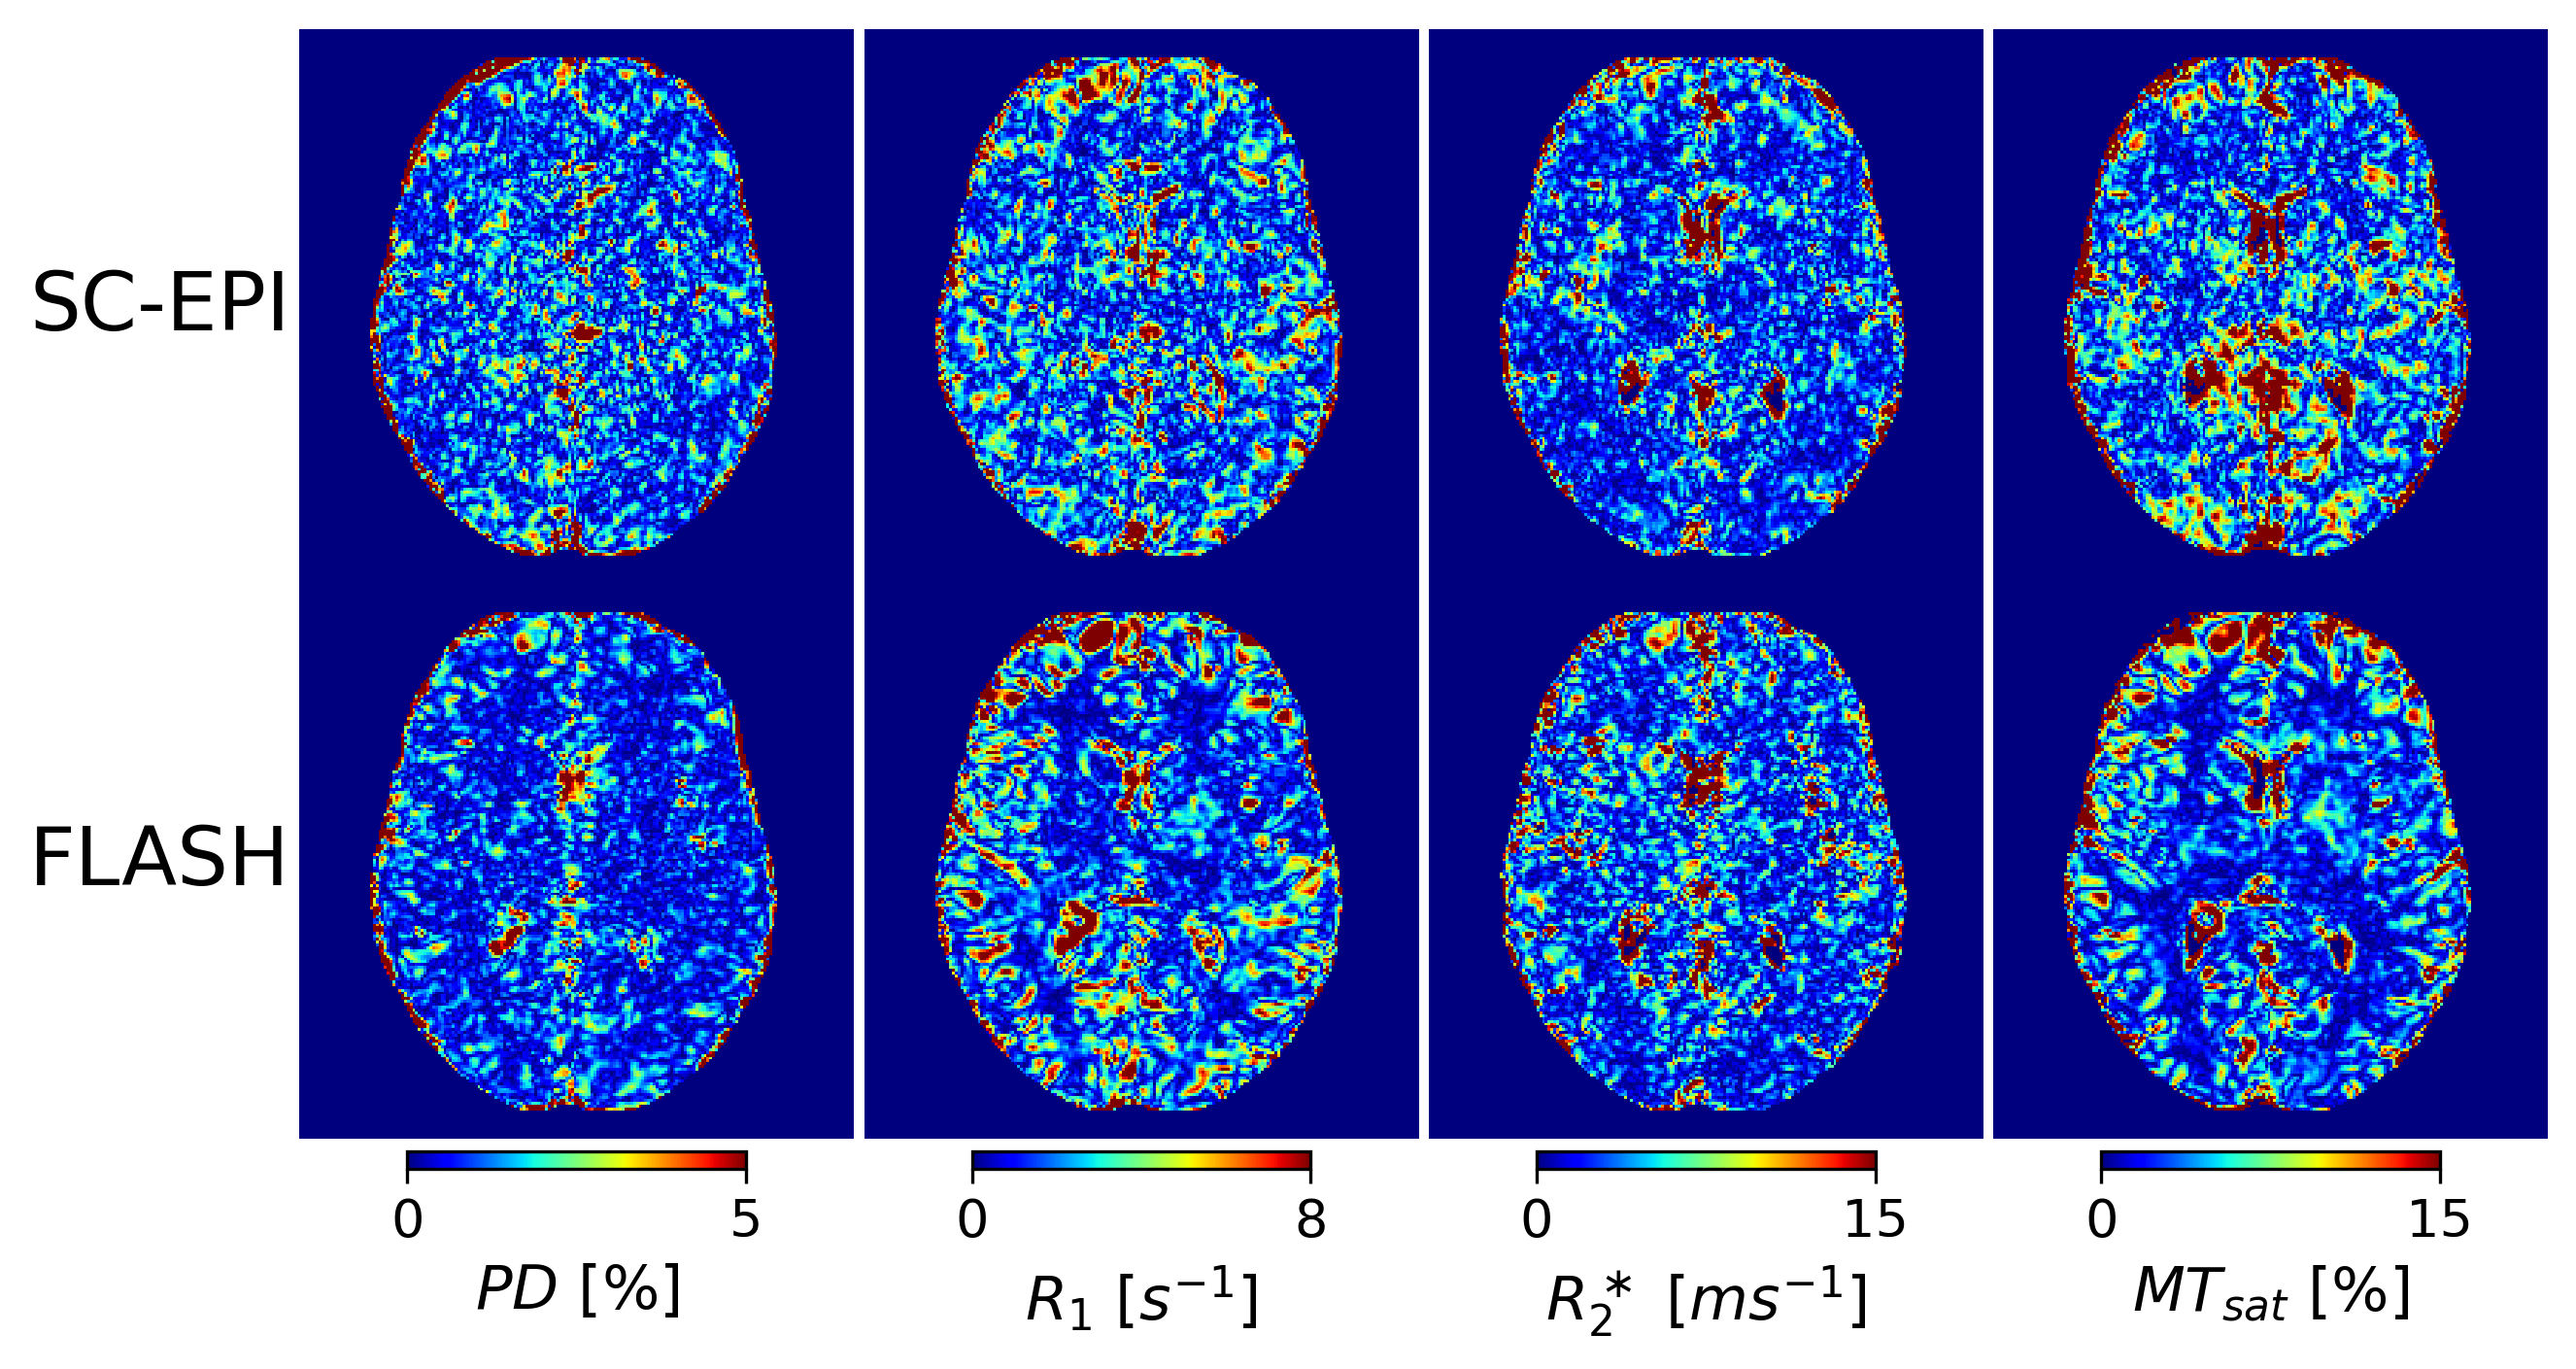
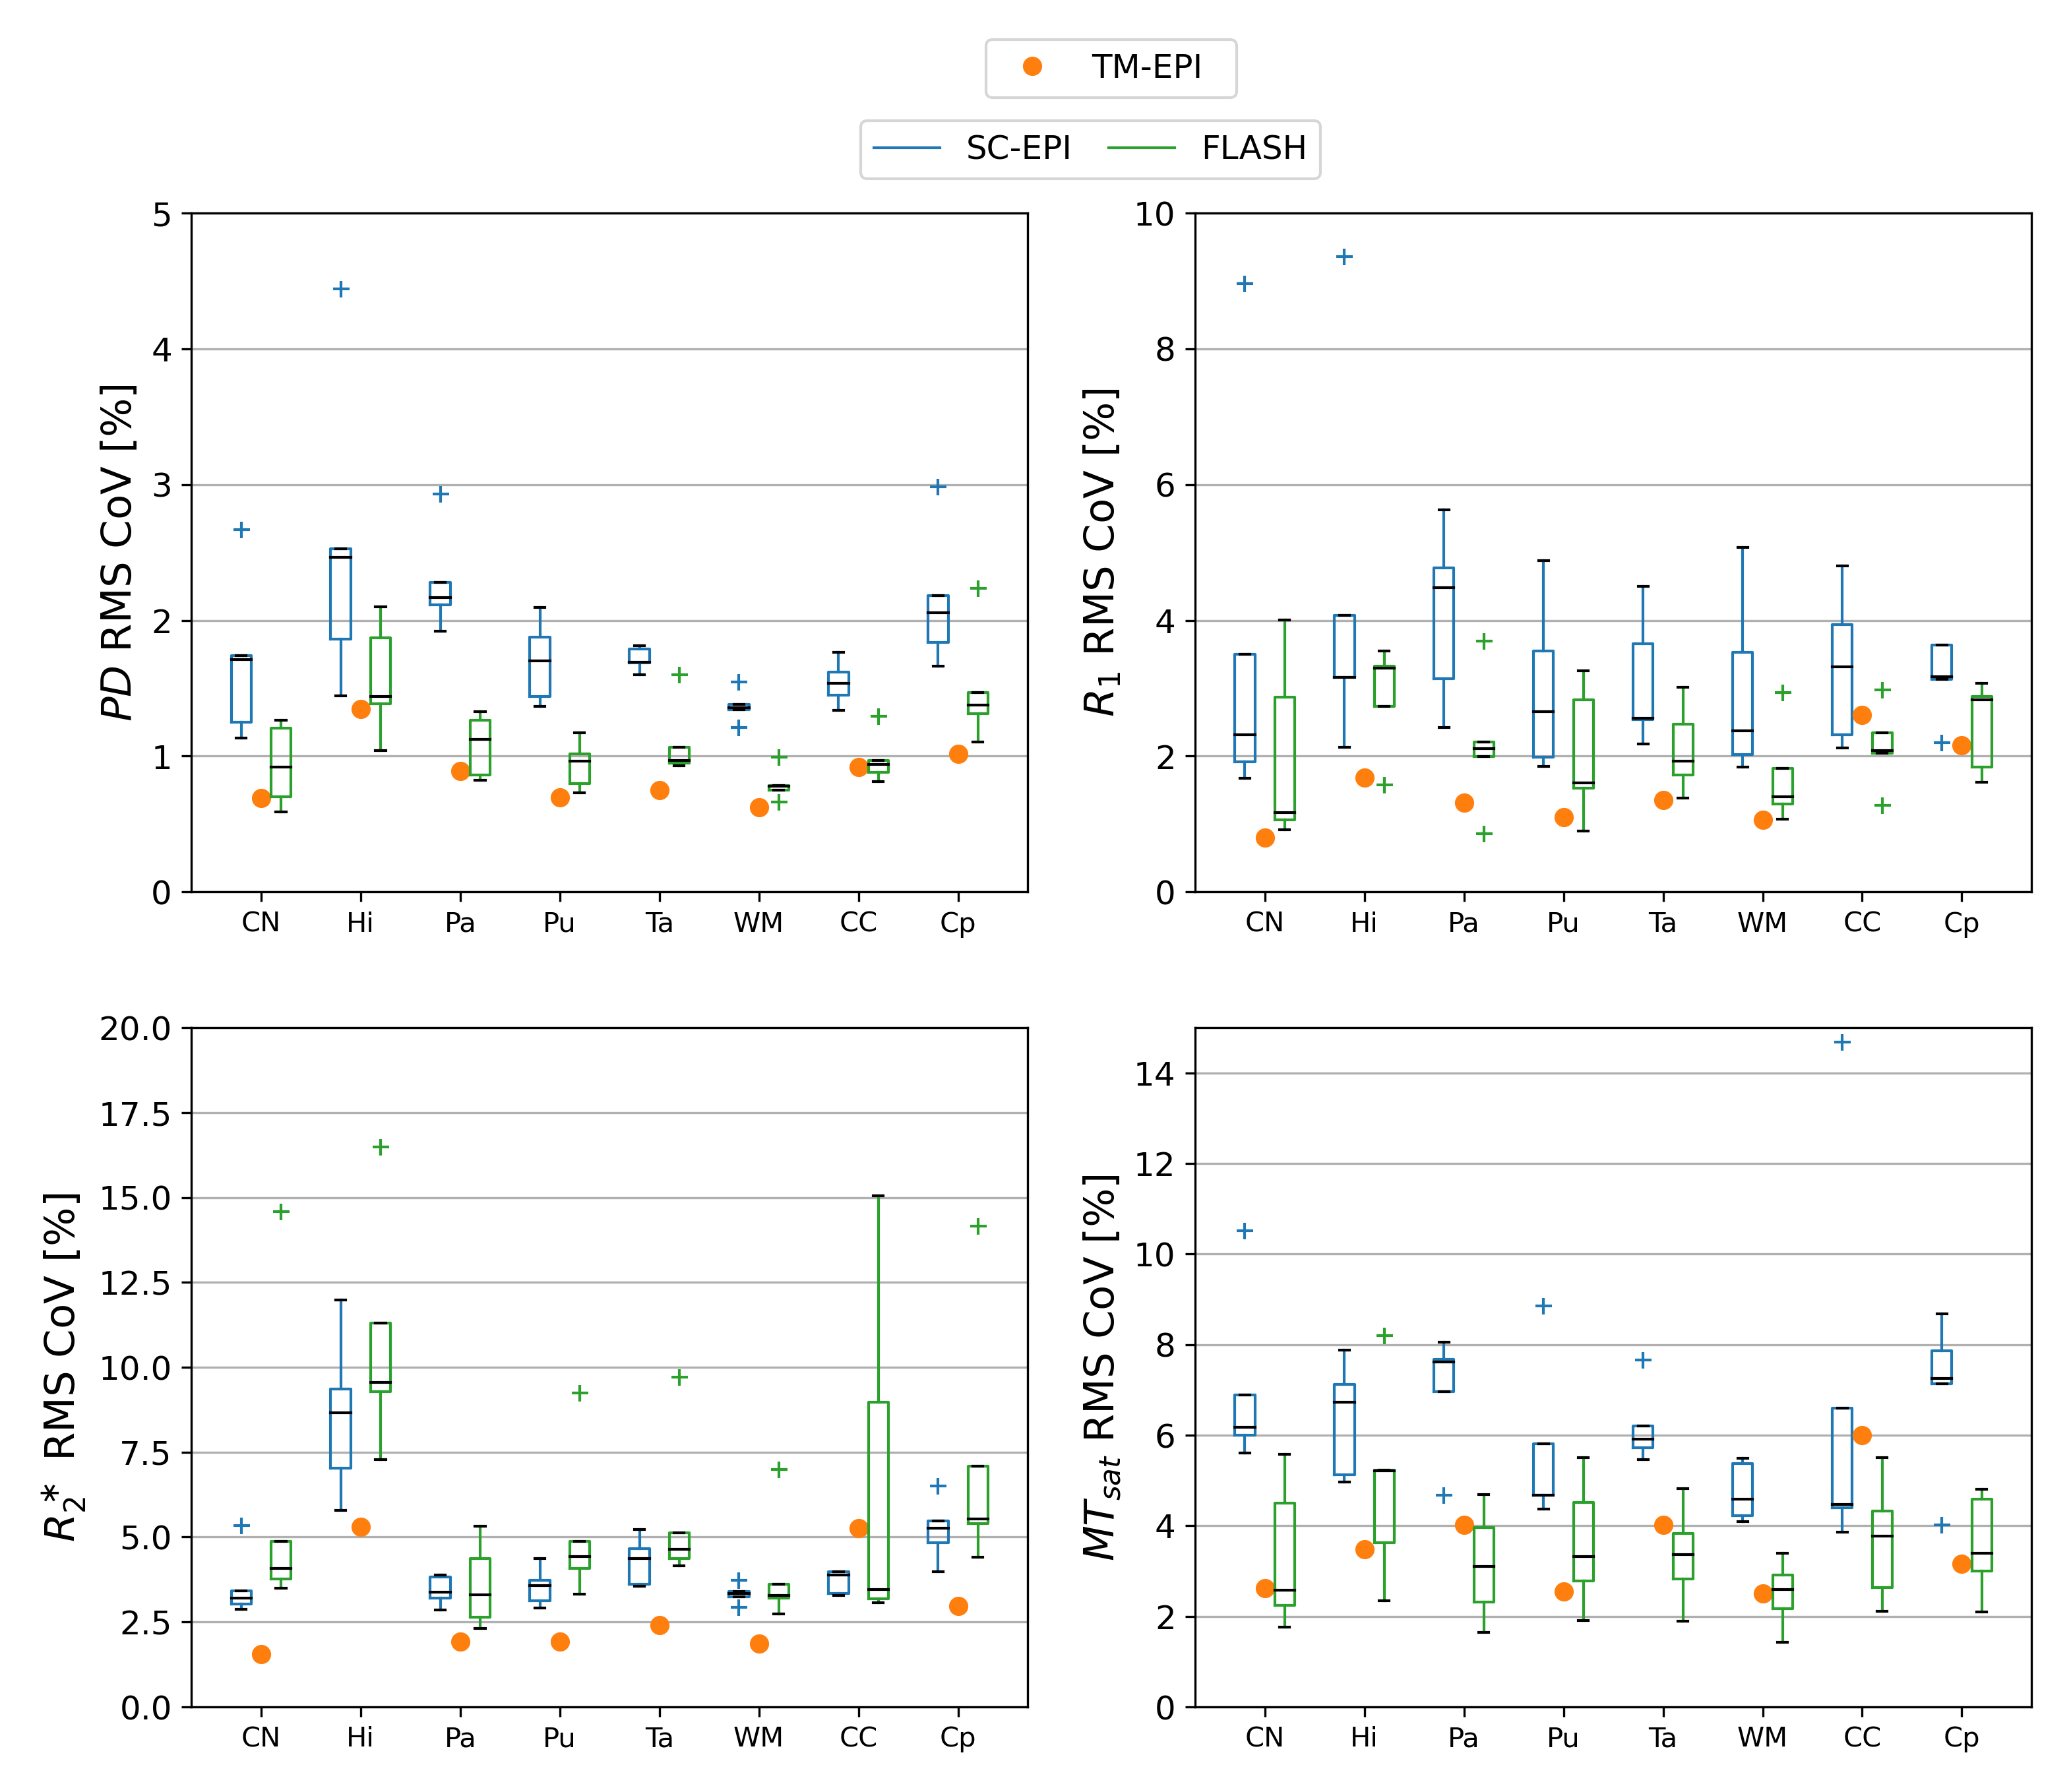
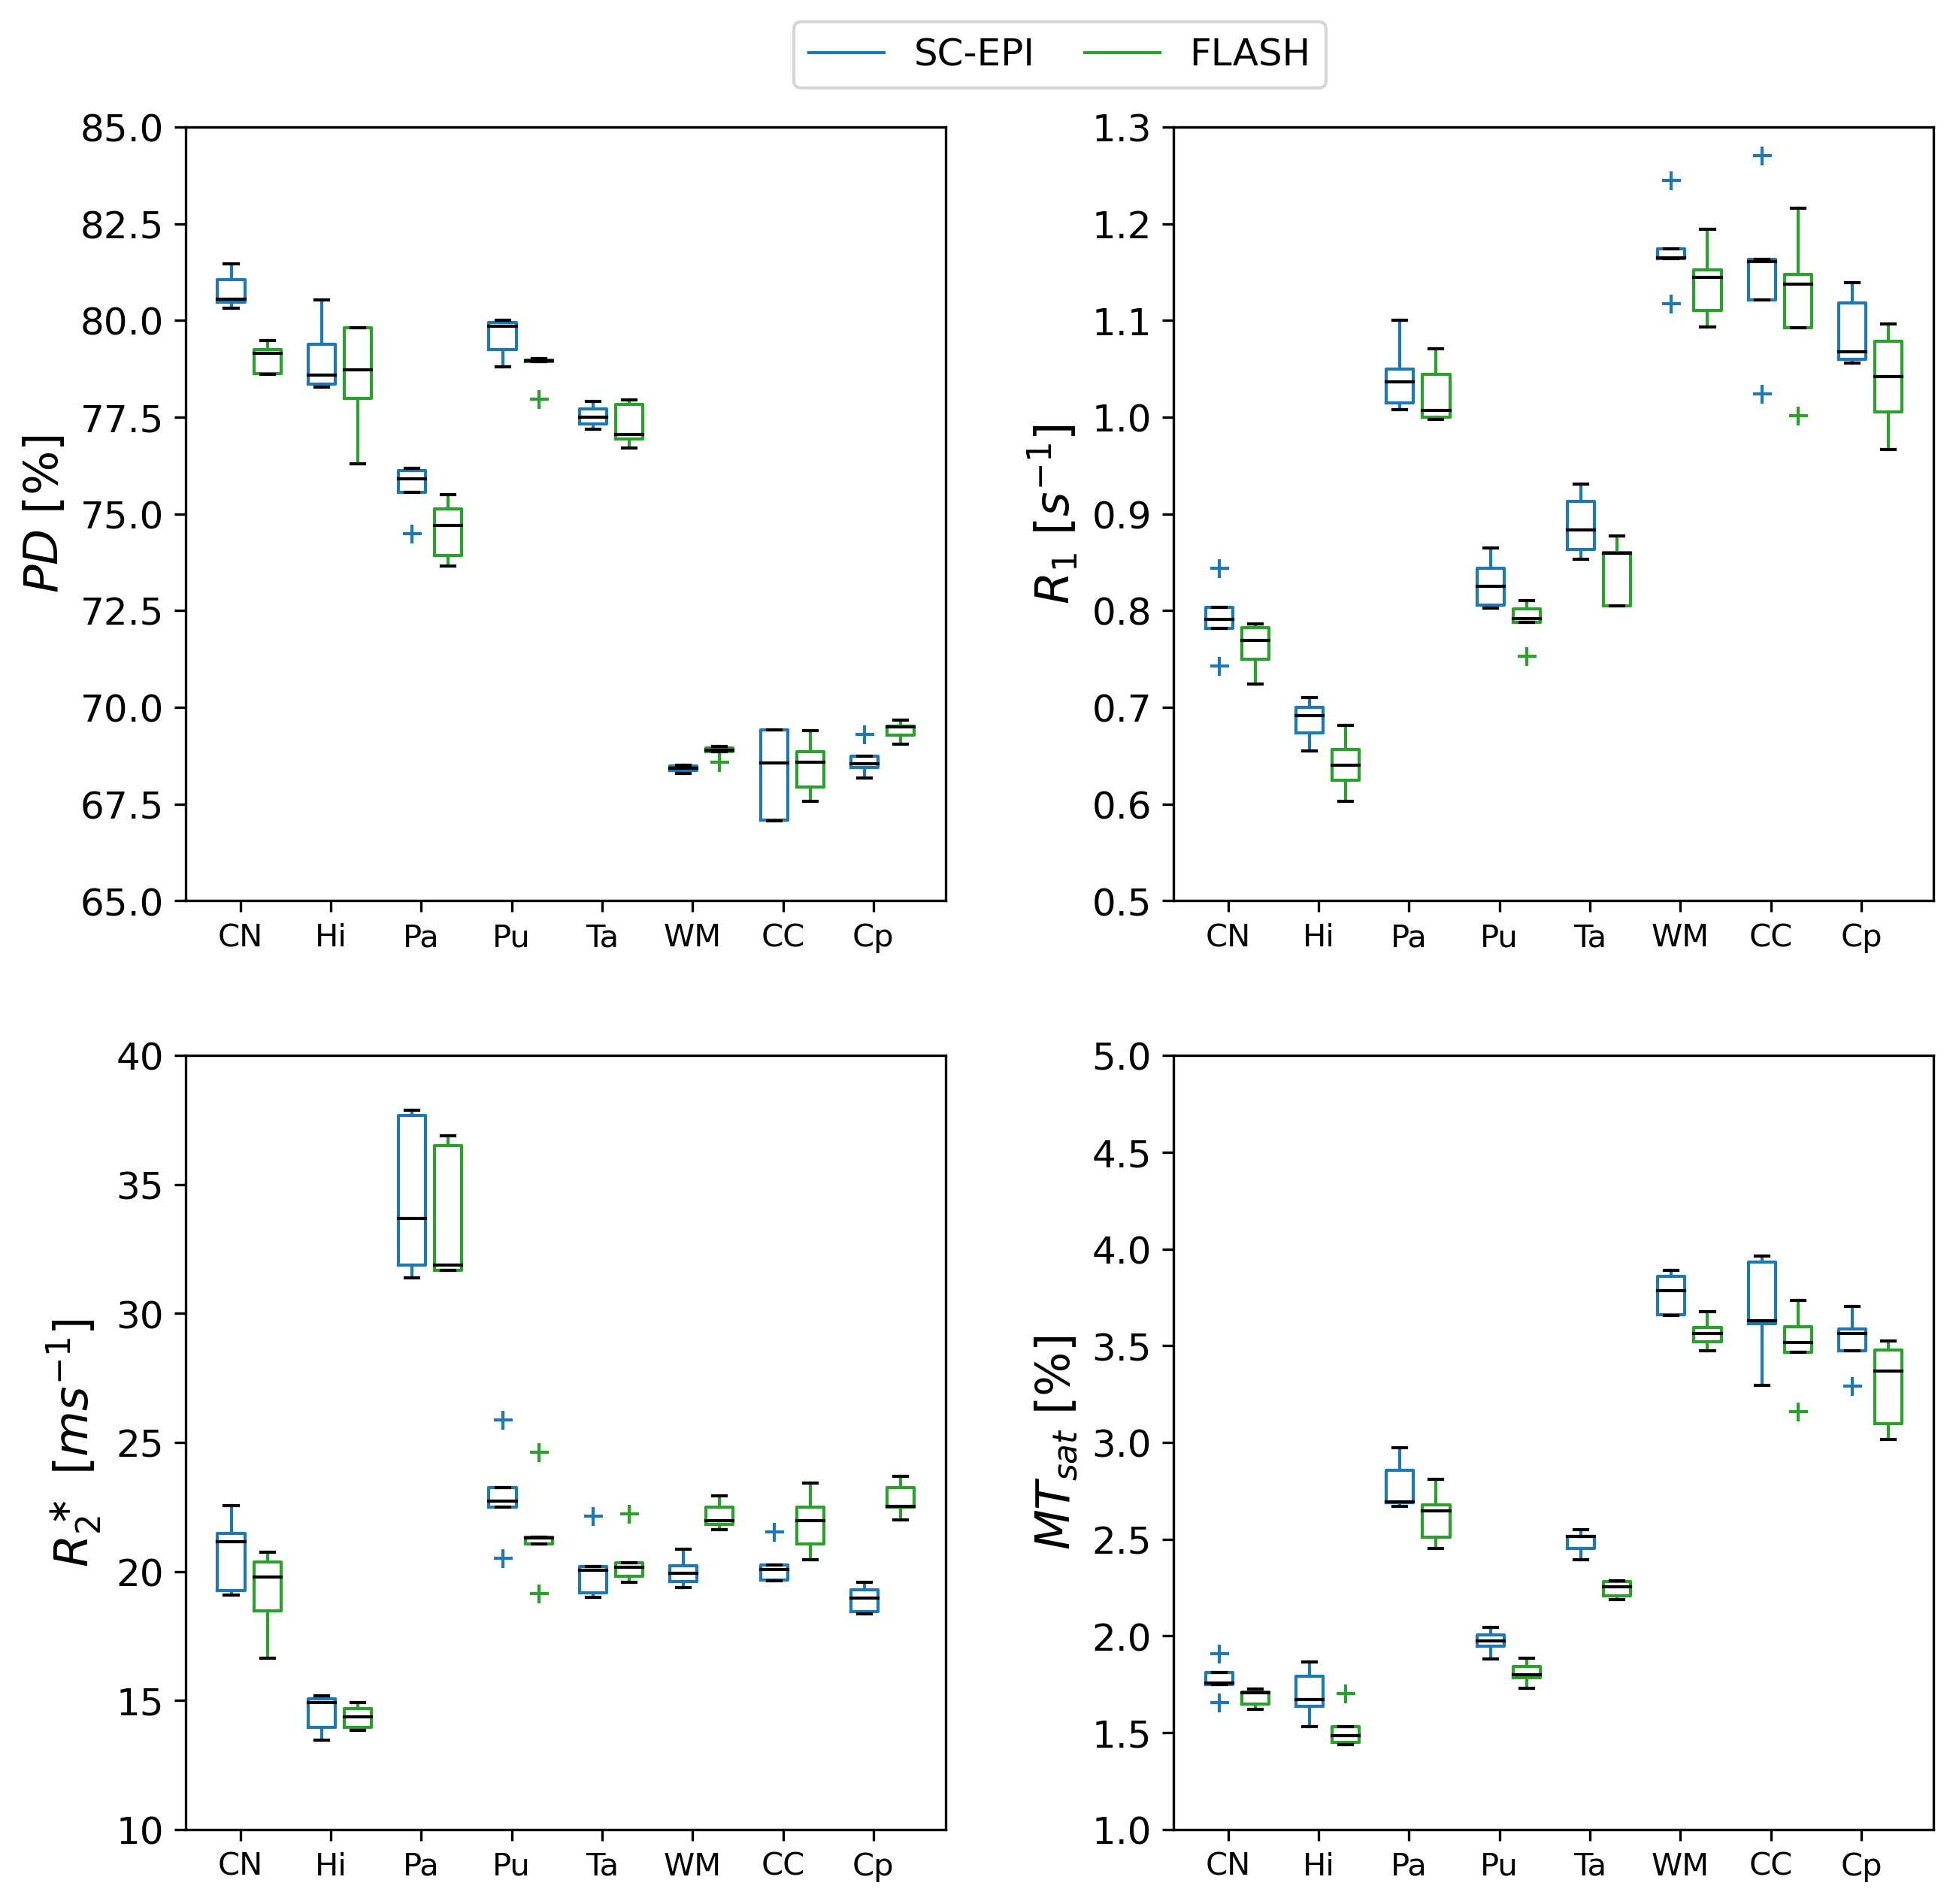
Fig.1 shows axial slices of quantitative parameter maps of SC-EPI and FLASH. Both show good soft tissue contrasts. Fig.2 demonstrates CoV maps. The CoV map of SC-EPI appears noisier than FLASH, same as the parameter maps and weighted images. The CoV of FLASH for MTsat in WM are overall smaller than that of SC-EPI, so is the CoV of SC-EPI for R2* in WM. The distribution of RMS-CoV in various ROIs are depicted in Fig.3. The CoV boxplots show that deep brain or cortical structures and cerebral WM share similar RMS-CoV across subjects, except for a few outliers. CoVs of SC-EPI are roughly 1.5 times larger than that of FLASH, except for R2*, where CoV of SC-EPI and FLASH are comparable. The time-matched TM-EPI achieved smaller CoVs than FLASH, except for MTsat, where CoV of TM-EPI and FLASH are comparable. Fig.4 shows that R1 estimates of SC-EPI are higher than those of FLASH in both WM and GM. The same holds for MTsat. PD estimates of SC-EPI and FLASH agree with each other. SC-EPI tends to have higher R2* in GM and smaller R2* in WM.Discussion
Our study showed that the proposed 1mm isotropic SC-EPI-MPM protocol acquired within 3 minutes at 3T achieved a high reproducibility for PD, R1, R2* and MTsat, in particular when compared to the literature7,8. Considering SC-EPI took only one fifth of the total acquisition time as the FLASH protocol (roughly half of the SNR), the RMS-CoV ranged from only 1.2% to 2.9% for PD (1.4-2.1times larger than FLASH), from 1.9% to 5.6% for R1 (1.4-1.9 times larger), from 2.87% to 11.7% for R2* (0.58-0.96 times smaller than FLASH except for in CC) and from 4.37% to 8.68% for MTsat (1.3-2.2 times larger). The time-matched SC-EPI achieved comparable or smaller CoV for all parameters in most of the ROIs.PD estimates of SC-EPI and FLASH agreed with each other due to WM calibration. R1 estimates of EPI were ~1.03 times larger than that of FLASH, which was also translated into slightly elevated MTsat estimates. R2* estimates of EPI were ~1.03 times larger than that of FLASH in deep brain GM structures and ~0.9 times smaller in WM. This WM-GM difference, in particular, likely comes from the mono-exponential R2* model9,10 and a bias by short and long T2* components due to the different TE ranges of SC-EPI and FLASH11.
Conclusion
We have investigated the scan-rescan reproducibility of the MPM acquisition using multi-echo skipped-CAIPI 3D-EPI at 3T, by comparison to the MPM protocol using a conventional FLASH sequence. SC-EPI-MPM shows lower CoV of R2* values and slightly higher CoV of the other parameters in most of the ROIs acquired within 3 minutes. The time-matched session proves that with enough SNR, SC-EPI can accomplish even higher reproducibility than FLASH. The difference of R1 parameter estimates between SC-EPI and FLASH was translated into PD and MTsat. The difference of R2* estimates could be the result of the T2* model and the different TE coverage. The optimized SC-EPI-MPM protocol can be easily utilized in clinical research considering the short scan time.Acknowledgements
No acknowledgement found.References
1. Wang D, Stöcker T, Stirnberg R. Fast Quantitative Multiparametric Mapping using 3D-EPI with Segmented CAIPIRINHA Sampling at 3T. In: Proc. Int. Soc. Magn. Reson. med.; 2020
2. Stirnberg R, Stöcker T. Segmented K‐space blipped‐controlled aliasing in parallel imaging for high spatiotemporal resolution EPI. Magnetic Resonance in Medicine 2021.
3. Callaghan MF, Lutti A, Ashburner J, et al. Example dataset for the hMRI toolbox. Data Br. 2019.
4. Ehses P, Brenner D, Stirnberg R, Pracht ED, Stöcker T. Whole‐brain B1 ‐mapping using three‐dimensional DREAM. Magn. Reson. Med. 2019.
5. Tabelow K, Balteau E, Ashburner J, et al. hMRI – A toolbox for quantitative MRI in neuroscience and clinical research. Neuroimage 2019.
6. Ashburner J. A fast diffeomorphic image registration algorithm. NeuroImage 2007.
7. Cooper G, Hirsch S, Scheel M, et al. Quantitative Multi-Parameter Mapping Optimized for the Clinical Routine. Frontiers in Neuroscience 2020.
8. Leutritz T, Seif M, Helms G, et al. Multiparameter mapping of relaxation (R1, R2*), proton density and magnetization transfer saturation at 3T: A multicenter dual-vendor reproducibility and repeatability study. Human Brain Mapping 2020.
9. Weiskopf N, Suckling J, Williams G, et al. Quantitative multi-parameter mapping of R1, PD*, MT, and R2* at 3T: A multi-center validation. Front. Neurosci.
10. Weiskopf N, Callaghan MF, Josephs O, Lutti A, Mohammadi S. Estimating the apparent transverse relaxation time (R2*) from images with different contrasts (ESTATICS) reduces motion artifacts. Front. Neurosci.
11. Juras V, Apprich S, Szomolanyi P, Bieri O, Deligianni X, Trattnig S. Bi-exponential T2*analysis of healthy and diseased Achilles tendons: An in vivo preliminary magnetic resonance study and correlation with clinical score. European Radiology 2013.
Figures