2789
Test-retest repeatability of radiomic features derived from T2w MRI in prostate cancer patients1Department of Diagnostic and Interventional Radiology, University Hospital Bonn, Bonn, Germany, 2Computer Assisted Clinical Medicine, Mannheim Institute for Intelligent Systems in Medicine, Medical Faculty Mannheim, Heidelberg University, Mannheim, Germany, 3Department of Radiology, University Hospital Cologne, Cologne, Germany, 4Institute of Diagnostic and Interventional Radiology, University Hospital Wuerzburg, Wuerzburg, Germany
Synopsis
Radiomics enables the extraction of quantitative features from medical images, potentially augmenting the characterization of healthy and diseased tissue. Before these features can be routinely used as biomarkers in clinical practice, however, their repeatability and reproducibility must be ensured. This study seeks to investigate feature repeatability in an in-vivo, clinical test-retest dataset of prostate cancer patients. Our results show that the majority (71.8%) of radiomic features extracted from in-vivo, clinical T2-weighted images was not repeatable, emphasizing the need for repeatability and reproducibility studies.
Introduction
Radiomics enables the extraction of quantitative features from medical images, thus potentially augmenting the characterization of healthy and diseased tissue (1, 2). Before these features can be routinely used as biomarkers in clinical practice, however, their repeatability and reproducibility must be ensured. Given the qualitative nature of most MRI techniques, only few MRI-derived radiomic features have been shown - predominantly in phantom studies - to demonstrate excellent repeatability which further depends on the acquired sequence and the applied image processing settings (3, 4). This study seeks to investigate feature repeatability in an in-vivo, clinical test-retest dataset of prostate cancer patients. Using standardized image processing, we assess the repeatability of 1032 features extracted from different regions of the prostate in order to establish stable features which could potentially be reliably applied in clinical routine.Methods
Data acquisition: With ethics committee approval, 11 patients (mean age 67.6 +-4 years) diagnosed with intermediate-risk adenocarcinoma of the prostate who were scheduled for radical prostatectomy were enrolled in this study. Examinations were performed on a clinical 3 T scanner (MAGNETOM Skyra; Siemens Healthcare, Erlangen, Germany) with the built-in spine matrix coil and the standard body-matrix coil. A high-resolution T2-weighted sequence (voxel size 0.7x0.7x3mm, TE/TR=108/3350ms, flip angle 160°, GRAPPA acceleration factor R=2) of the prostate was acquired, replanned, and re-acquired to obtain a test/retest dataset.Image segmentation: Using the 3D Slicer open-source platform (version 4.11; www.slicer.org), the peripheral zone (PZ), transition and central zone (TZ+CZ), the anterior fibromuscular stroma (AFMS), the urethra, the pathologic prostate lesion and a slice of the left musculus gluteus maximus as a reference tissue were manually segmented in the test images (figure 1). To avoid intra-observer differences, these segmentations were resampled with SimpleITK to fit the retest images (5, 6).
Image processing and radiomic feature extraction: Prior to feature extraction, a standardized image processing was applied (resampling to isotropic voxels of 1mm, intensity discretization to 32 grey levels and intensity rescaling to the minimum and maximum values). Radiomic features were calculated on the unfiltered images as well as on images further preprocessed applying a choice of several built-in filters of the SlicerRadiomics extension that provides an interface to the pyradiomics library (7). In total 1032 features of five feature classes were extracted: first-order statistics, and texture classes gray level cooccurrence matrix (glcm), gray level run length matrix (glrlm), gray level size zone matrix (glszm), and grey level dependence matrix (gldm).
Statistical analysis: Statistical analysis was performed in R (version.4.0.5; R Foundation for Statistical Computing) within RStudio (version1.4.1106). To assess test-retest repeatability of radiomic features, the concordance correlation coefficient (CCC) as defined by Lin was used (8). Repeatability was compared to the entire biological range available to each feature across all volumes of interest which can be expressed as a dynamic range (DR) (9). The normalized DR for a feature was defined as $1-(range/{average difference})$ (9, 10). Values close to 1 imply that a feature has a large biological range relative to its repeatability. Excellent repeatability was defined as CCC and DR ≥0.90 (9, 11).
Results
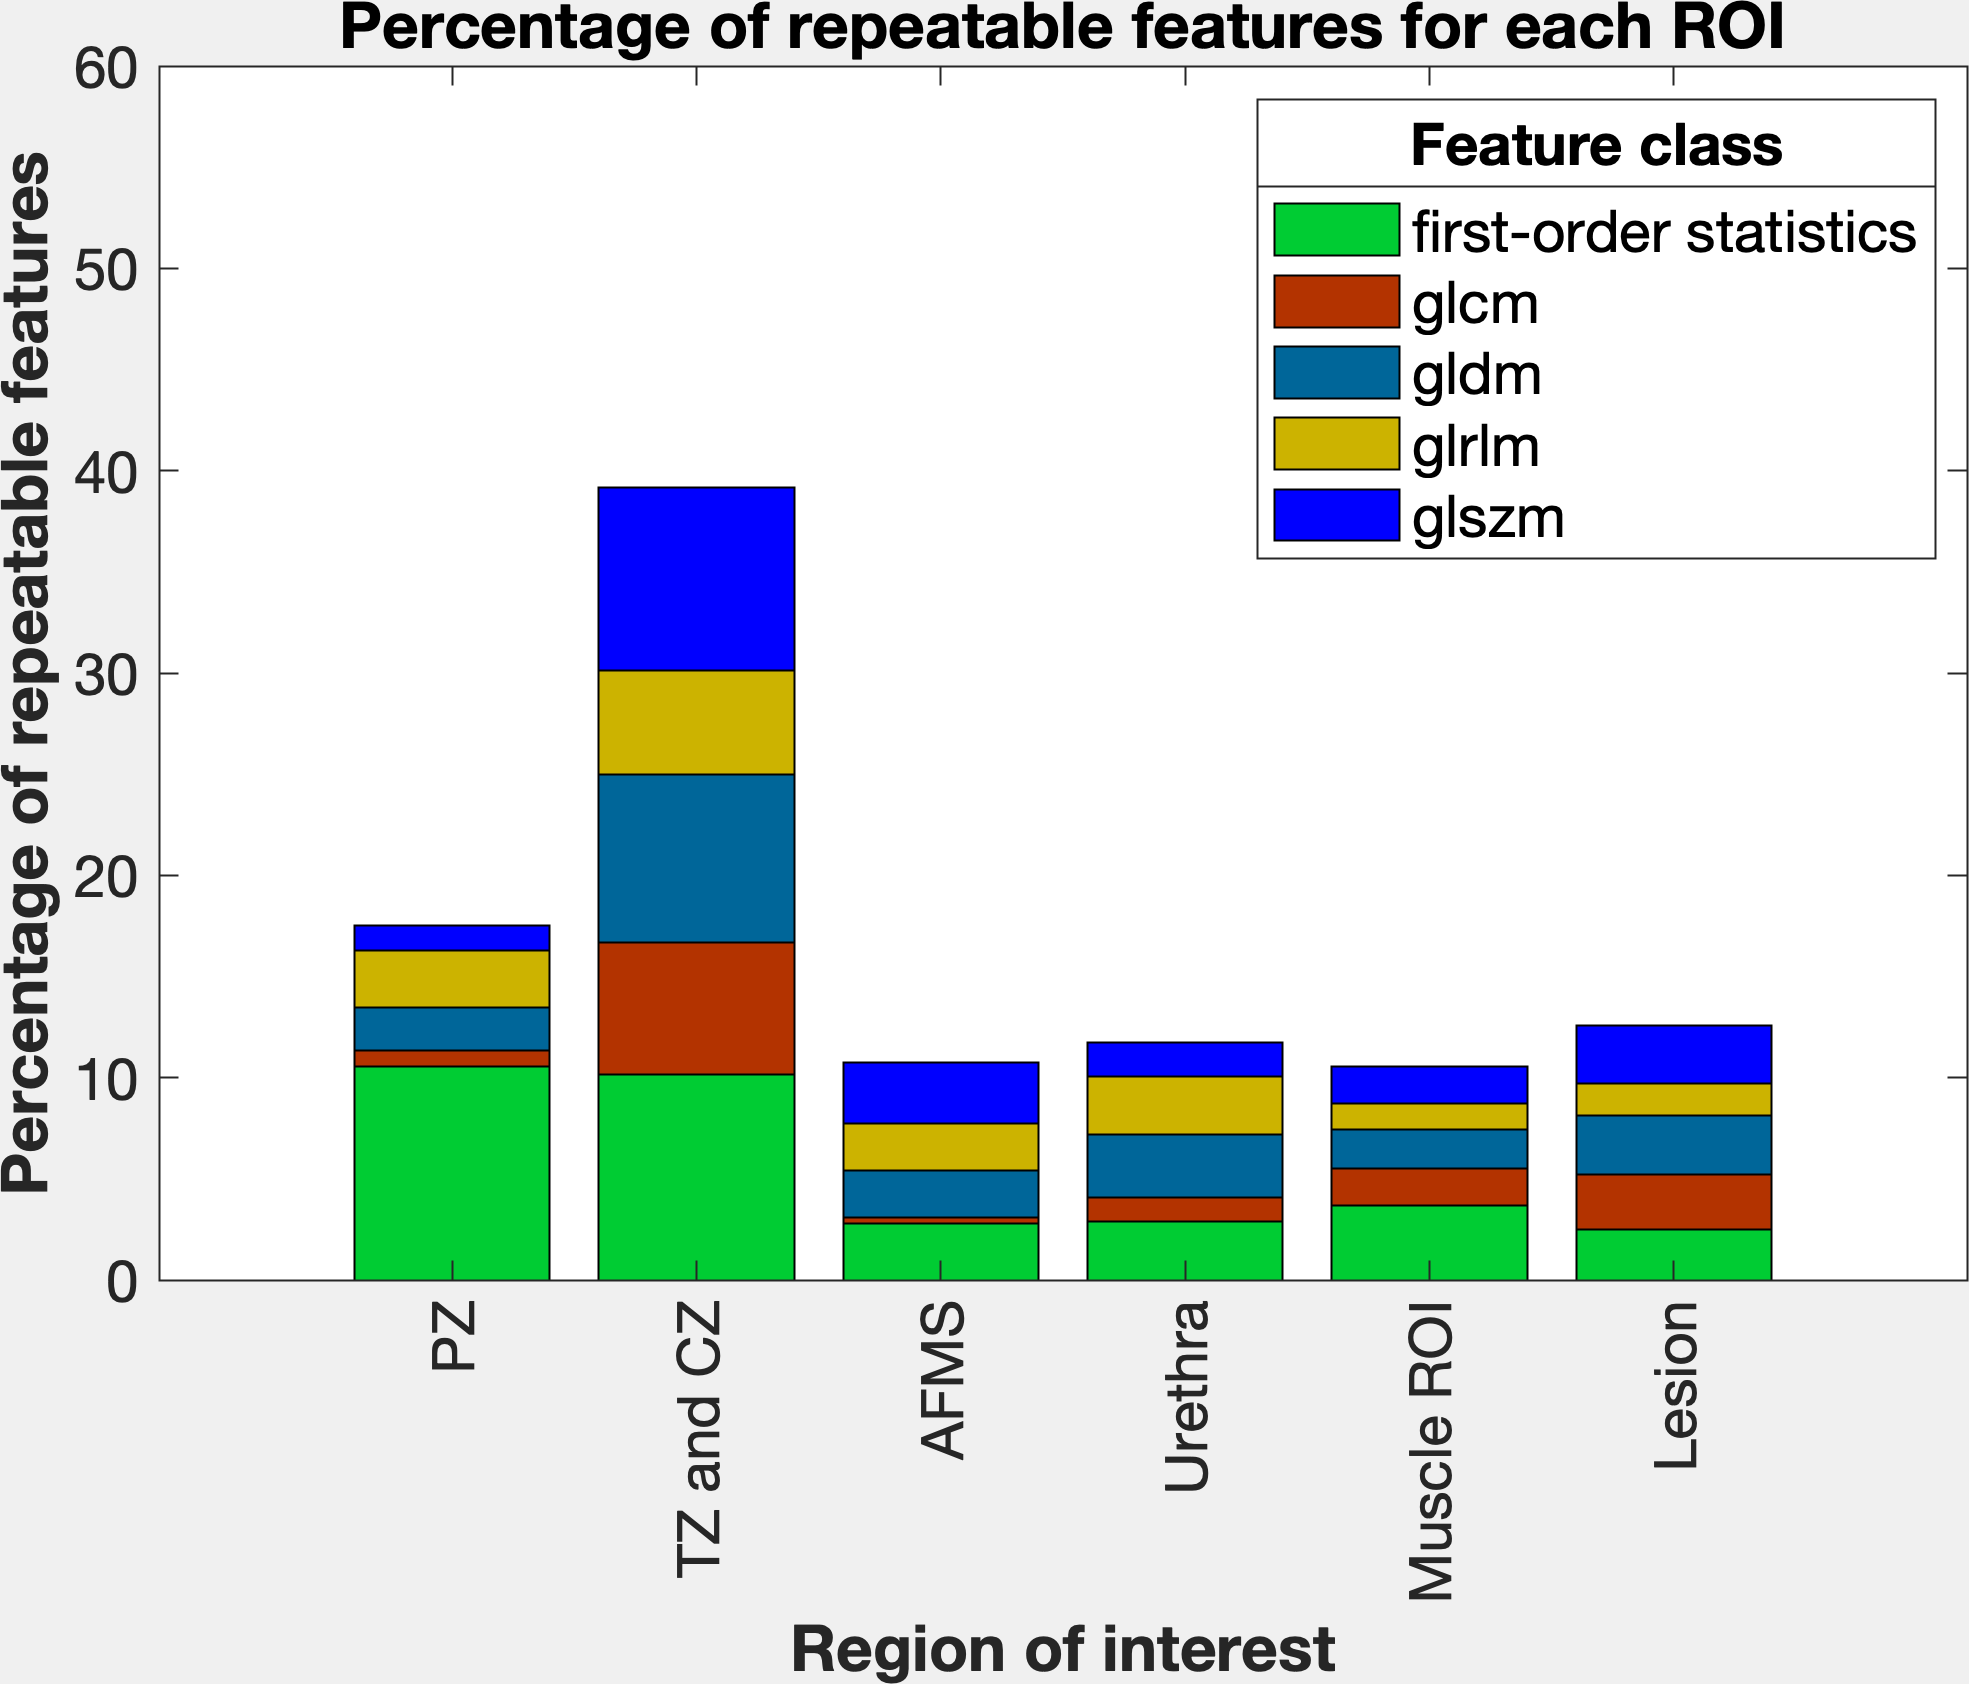
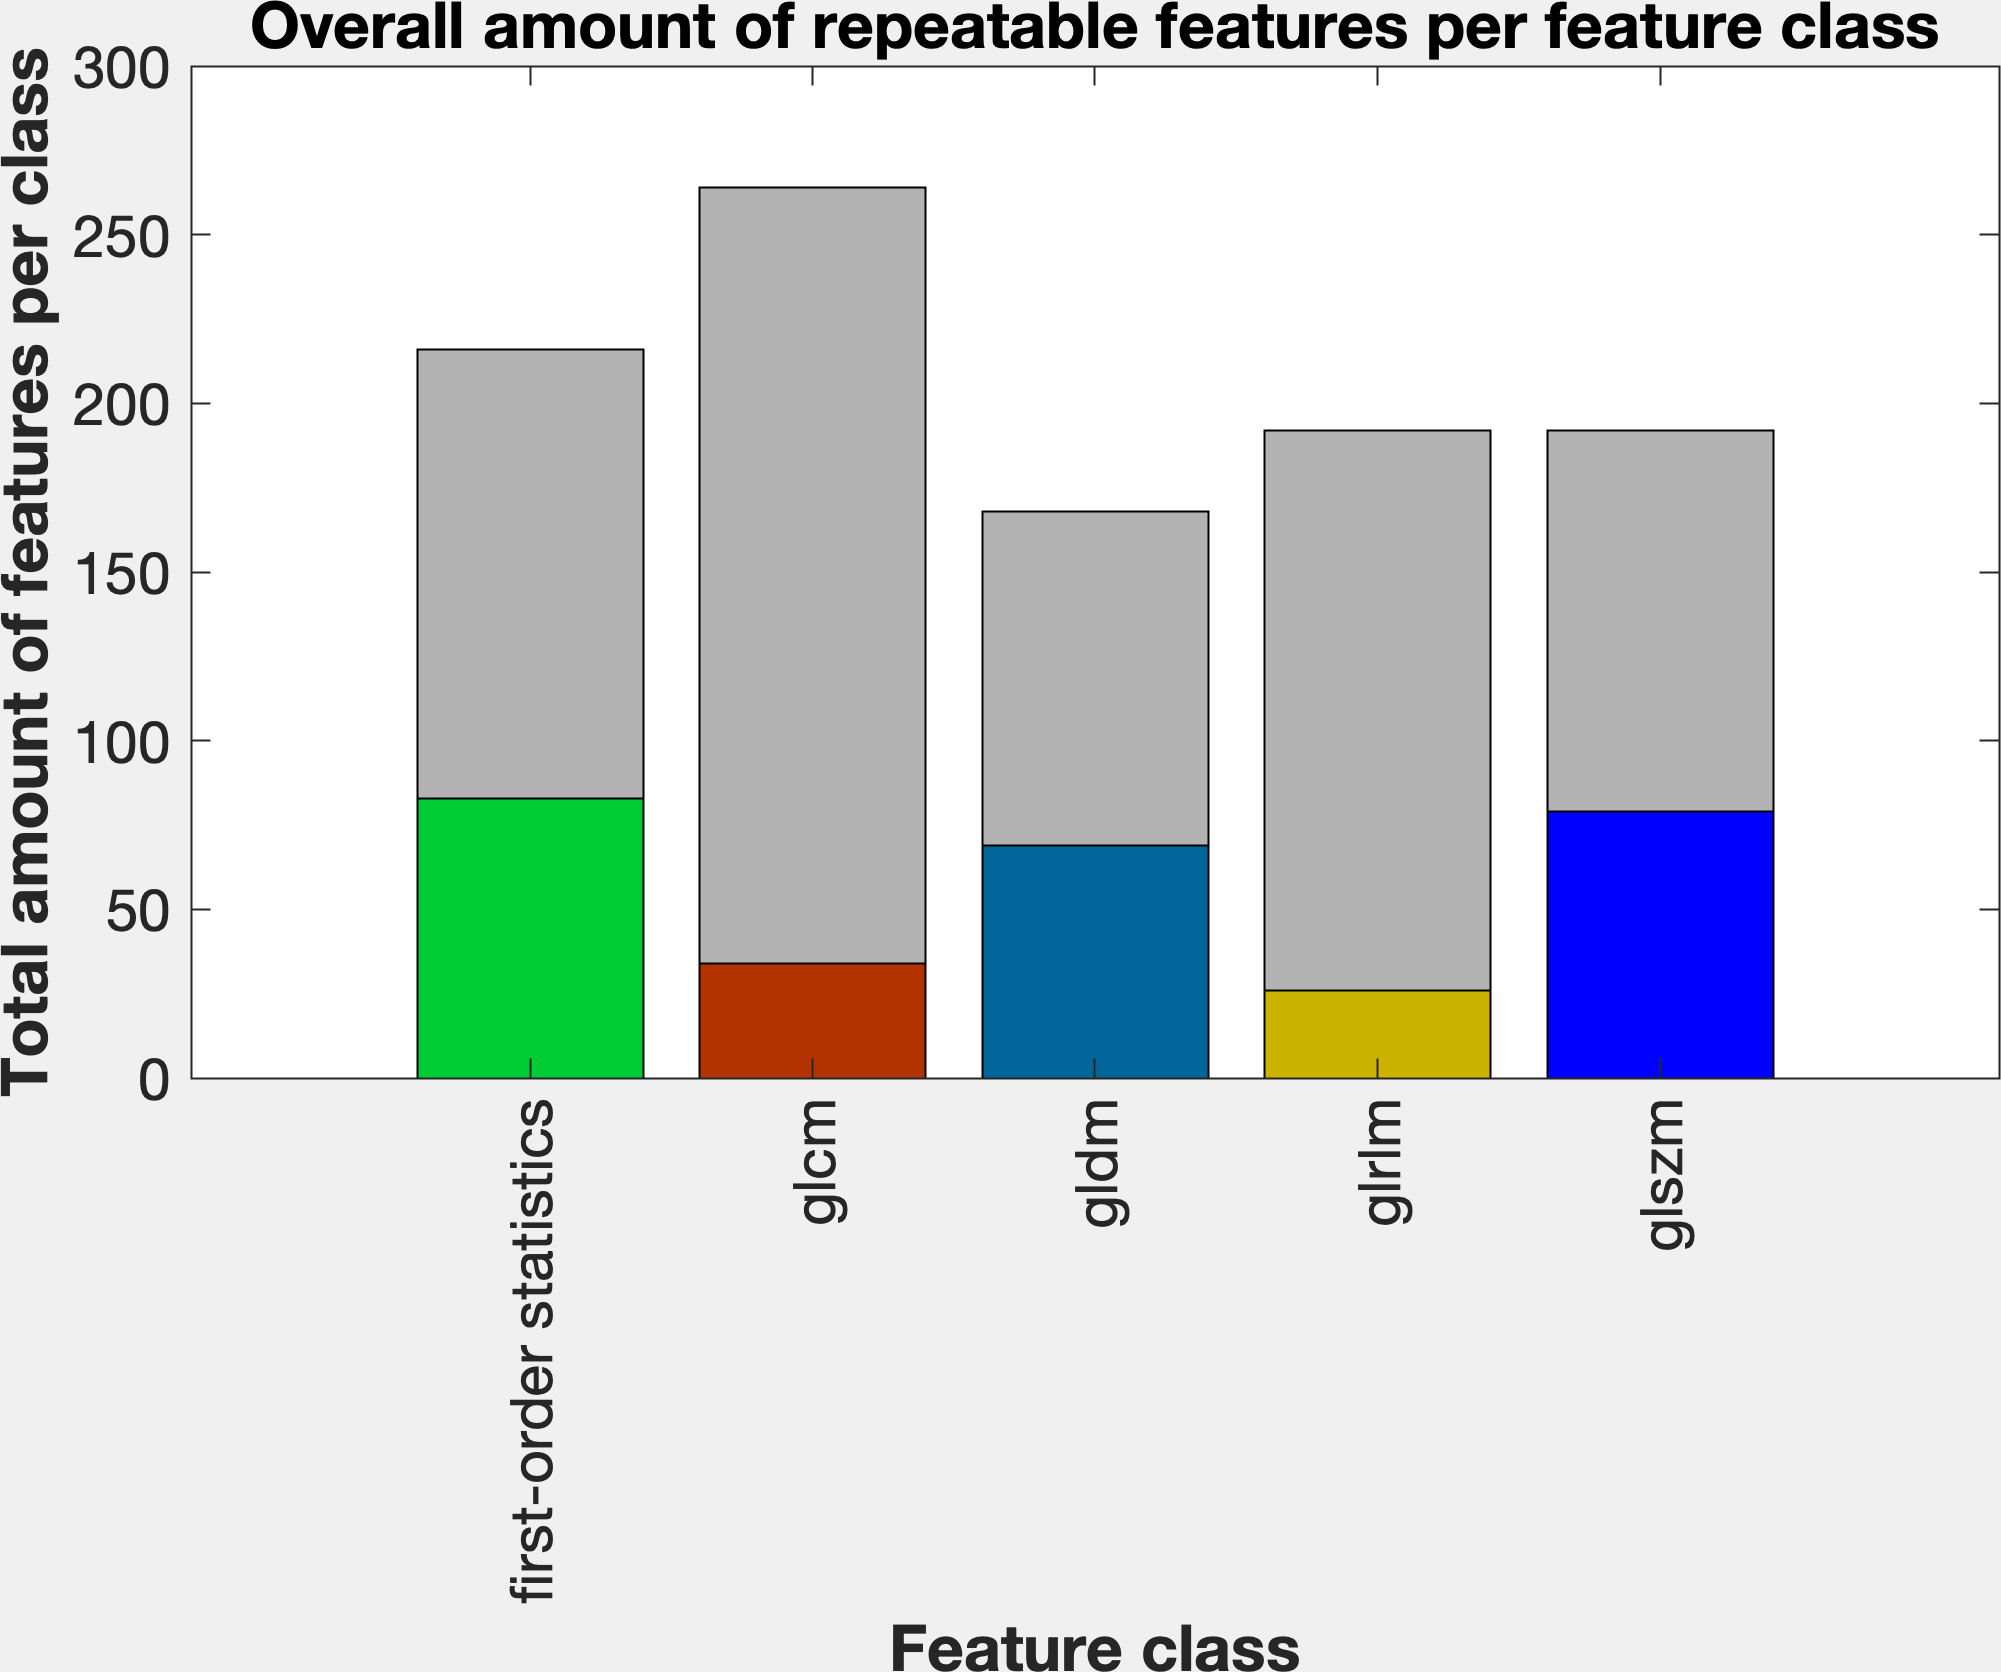
The percentage of repeatable features was highest for the largest region of interest (ROI) TZ+CZ with 39.1%. For the remaining smaller ROIs the percentage of repeatable features varied between 10.6% (muscle slice) and 17.5% (PZ) (figure 2). Across all ROIs, 28.2% of all features exhibited excellent repeatability: 83 out of 216 features of the first-order statistics, 34 out of 264 features of the class glcm, 69 out of 168 features of the class gldm, 26 out of 192 features of the glrlm and 79 out of 192 features of the class glszm (figure 3).Discussion
Our results show that the majority (71.8%) of radiomic features extracted from in-vivo, clinical T2-weighted images was not repeatable despite standardized image processing. Furthermore, our results indicate that features extracted from smaller ROIs are less repeatable. Considering the great interest in characterizing small, indistinct lesions using quantifiable features, this finding might be particularly challenging in a clinical setting. When comparing our results with recently published phantom studies (52% repeatable features extracted from high resolution T2-weighted MRI) (3), it becomes evident that an extensive knowledge about the repeatability and reproducibility of radiomic features has to precede translation into clinical routine practice.Conclusion:
Only 28.2% of all features show excellent repeatability across all ROIs. Extensive repeatability and reproducibility studies are required before being able to reliably translate quantitative image analysis and radiomics into standard clinical care. Care should be taken in the interpretation of clinical studies using features that are not repeatable.Acknowledgements
No acknowledgement found.References
1. Obermeyer Z, Emanuel EJ. Predicting the Future - Big Data, Machine Learning, and Clinical Medicine. N Engl J Med. 2016;375(13):1216-9.2. Lambin P, Leijenaar RTH, Deist TM, et al. Radiomics: the bridge between medical imaging and personalized medicine. Nat Rev Clin Oncol. 2017;14(12):749-62.
3. Baessler B, Weiss K, Pinto Dos Santos D. Robustness and Reproducibility of Radiomics in Magnetic Resonance Imaging: A Phantom Study. Invest Radiol. 2019;54(4):221-8.
4. Wichtmann BD, Attenberger UI, Harder F, et al. Influence of image processing on the robustness of radiomic features derived from magnetic resonance imaging - a phantom study. ISMRM. Montréal, QC, Canada; 2019.
5. Lowekamp BC, Chen DT, Ibanez L, Blezek D. The Design of SimpleITK. Front Neuroinform. 2013;7:45.
6. Yaniv Z, Lowekamp BC, Johnson HJ, Beare R. SimpleITK Image-Analysis Notebooks: a Collaborative Environment for Education and Reproducible Research. J Digit Imaging. 2018;31(3):290-303.
7. van Griethuysen JJM, Fedorov A, Parmar C, et al. Computational Radiomics System to Decode the Radiographic Phenotype. Cancer Res. 2017;77(21):e104-e7.
8. Lin LI. A concordance correlation coefficient to evaluate reproducibility. Biometrics. 1989;45(1):255-68.
9. Balagurunathan Y, Kumar V, Gu Y, et al. Test-retest reproducibility analysis of lung CT image features. J Digit Imaging. 2014;27(6):805-23.
10. Schuster DP. The opportunities and challenges of developing imaging biomarkers to study lung function and disease. Am J Respir Crit Care Med. 2007;176(3):224-30.
11. Akoglu H. User's guide to correlation coefficients. Turk J Emerg Med. 2018;18(3):91-3.
Figures
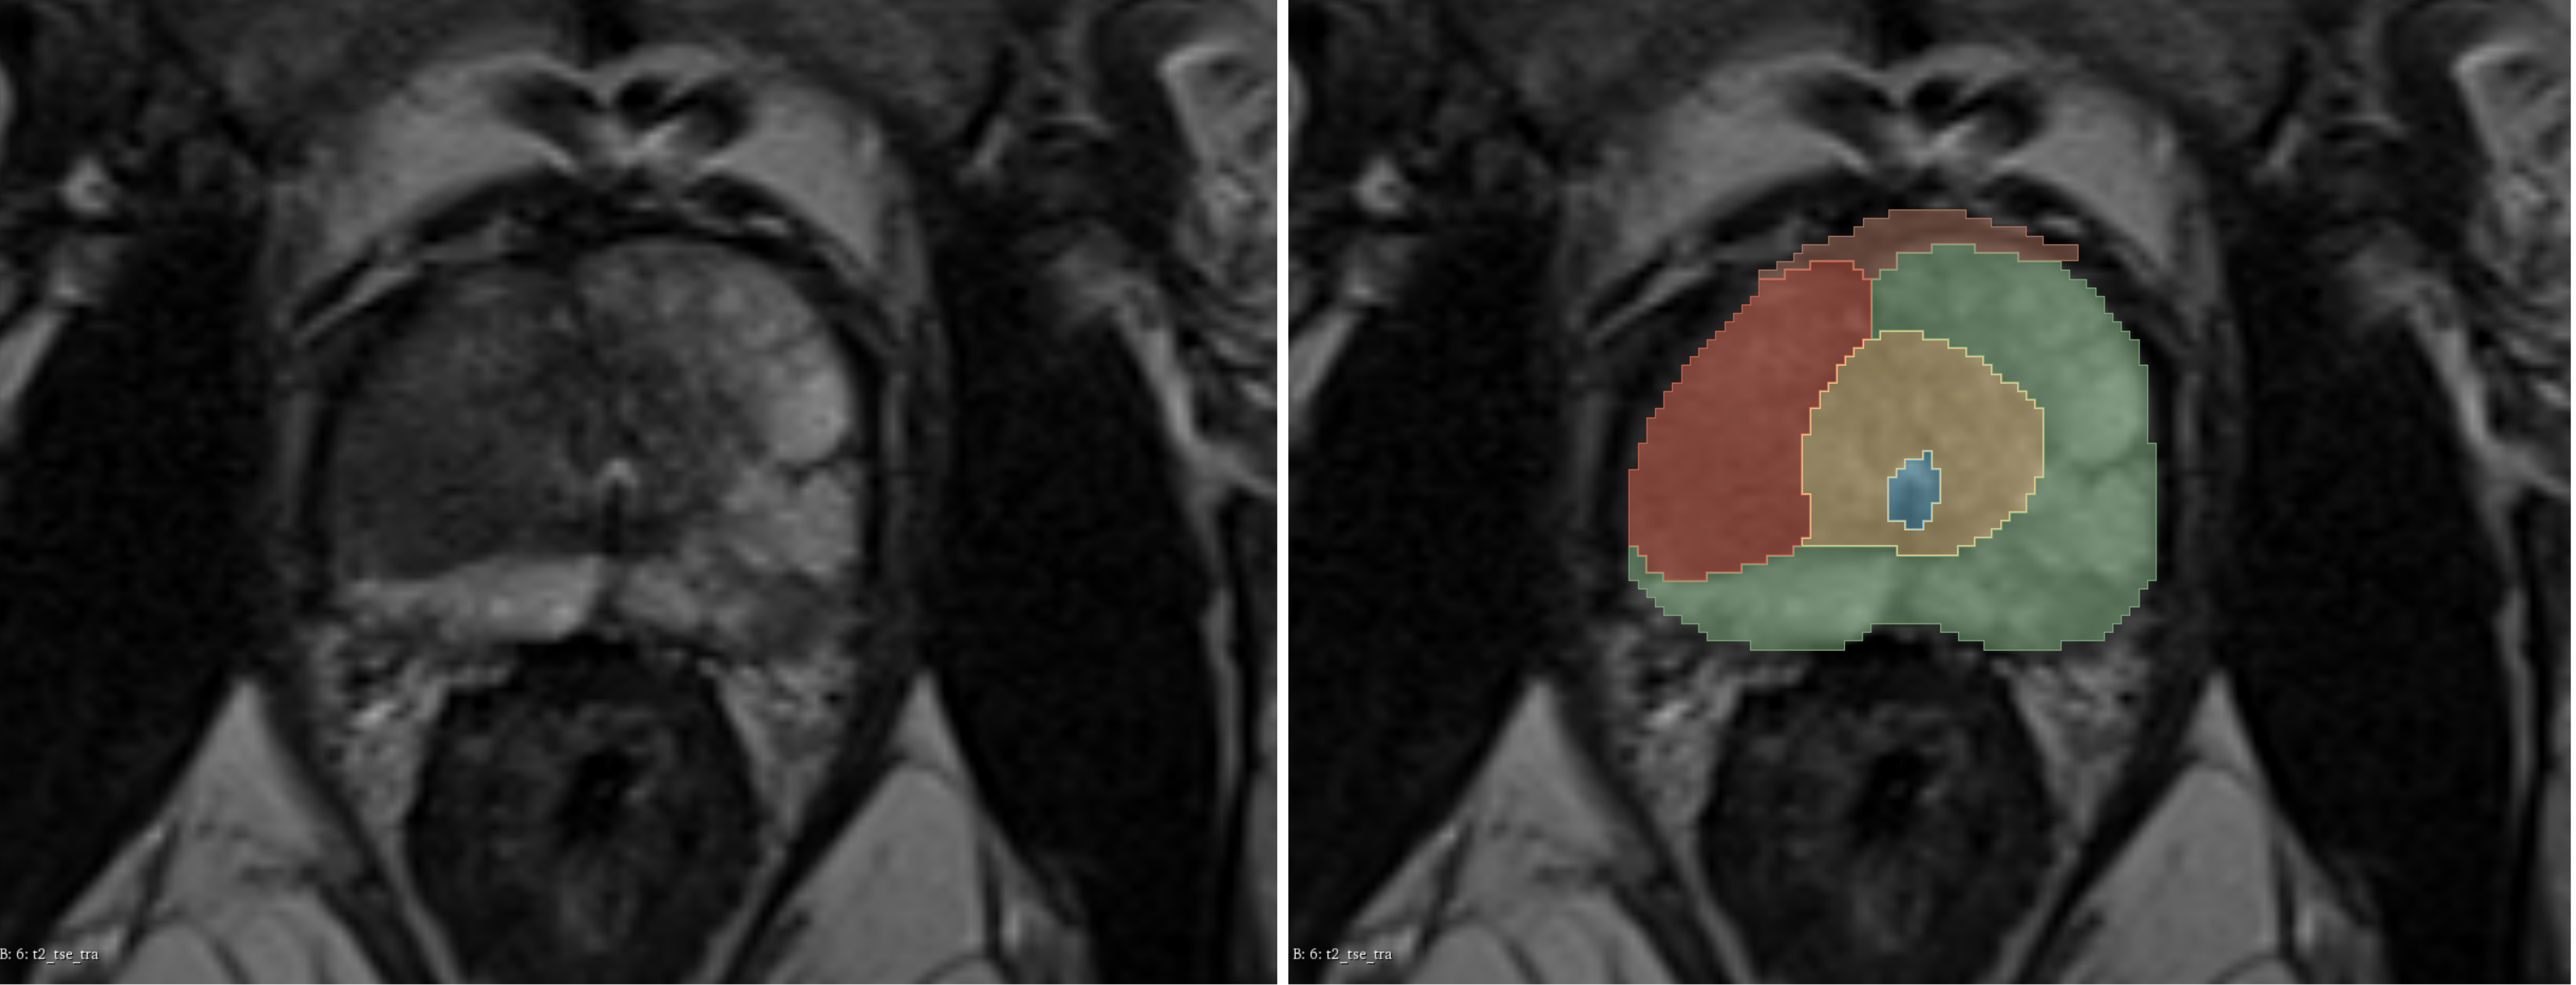
Exemplary, manual segmentation of the prostate.
green: Peripheral zone (PZ); yellow: Transition and central zone (TZ+CZ); orange: Anterior fibromuscular stroma (AFMS); blue: Urethra; red: Pathologic prostate lesion