2787
APT-CEST Scan-Rescan Reproducibility in Healthy Volunteers and Brain Glioma Patients at 3 Tesla1Department of Radiology and Nuclear Medicine, Vrije Universiteit Amsterdam Medisch Centrum, Amsterdam, Netherlands, 2Department of Biomedical Engineering, Key Laboratory for Biomedical Engineering of Ministry of Education, Department of Biomedical Engineering, College of Biomedical Engineering & Instrument Science, Zhejiang University, Hangzhou, Zhejiang, China, 3UCL Institutes of Neurology and Healthcare Engineering, London, United Kingdom
Synopsis
Amide proton transfer (APT) chemical exchange saturation transfer (CEST) MRI is a potentially useful clinical technique to image brain tumors, but its reproducibility was not yet investigated in detail. Our 3T scan-rescan protocol on volunteers and glioma patients revealed high within-session and slightly lower in-between-session and between-day reproducibility, with highest reproducibility occipitally and centrally in the brain and lowest at the skull base. The within-session reproducibility for patients was also good, both intratumoral and extratumoral. These results show that APT-CEST at 3T MRI renders reproducible values allowing for clinical monitoring of metabolic brain tumors.
Introduction
Amide proton transfer chemical exchange saturation transfer (APT-CEST) imaging can detect increased levels of amides and peptides1,2, which is potentially useful to detect and monitor brain tumors like gliomas3-5. While APT-CEST has shown promising results, its reproducibility has not yet been extensively investigated. Good reproducibility is however crucial for clinical follow-up and cut-off value determination. This study evaluates the reproducibility of APT-CEST at 3T for both healthy volunteers and glioma patients.Methods
Participants and Study design21 healthy volunteers (age 39±11 yrs, 11 women) and 10 glioma patients (age: 55±15 yrs, 7 women) were scanned at 3T (Vida, Siemens, Erlangen, Germany) using a 20-channel head coil, including whole-brain 3D T1w and APT-CEST (2.8x2.8x2.8 mm resolution, 7 frequencies with MT pulses (10x 100ms at 2.5μT gaussian pulses) at ± 3.0, 3.5 and 4.0 ppm off-resonance, scan duration: 4m36s) plus a dual-echo GRE B0 map for geometric distortion correction.6
Healthy volunteers underwent 3 APT-CEST scan-sessions, while patients underwent one session. Each scan-session contains two consecutive APT-CEST scans and one B0-map. For a detailed description of the scan protocol see fig. 1.
Post-processing
Motion and distortion-corrected APT-CEST maps were calculated as magnetization transfer (MT) asymmetry (MTRasym). APT-CEST unprocessed scans were registered to the 3D T1w images and transformed to MNI using ExploreASL and smoothed by a 3.5x3.5x3.5mm FWHM Gaussian filter. PyCharm was used to create voxelwise within-subject standard deviation (SD) maps of the difference between sessions/blocks (SDdiff) and further image processing.
Analysis
A neuroradiologist (VK), with 10 years of experience, manually delineated the hyperintense glioma regions-of-interest (ROIs) on the post-contrast T1w. The MTRasym of tumor ROI was compared to a similarly-sized contralateral region and the between-days SDdiff.
SDdiff maps were calculated for the within-session, in-between-session, and between-day reproducibility. The within-session SDdiff maps of the volunteers were compared to the within-session SDdiff maps of the patients. Variance component analysis (Rstudio VCA) was performed for the whole brain, cortical gray matter, deep white matter, thalamus, and putamen. The normal APT-CEST values for healthy volunteers were also calculated for these masks and compared to mean tumor values. Finally, the scanning variability was related to the MTRasym effect size between tumor and contralateral tissue. The effect size is given by mean_tumor_MTRasym - mean_contralateral_MTRasym.
Results
APT-CEST values in healthy volunteersNormal whole brain MTRasym ranged between -0.92% and 1.96% —5th and 95th percentile, respectively — with a mean of 0.49% (Table 1).
SDdiff map
The within-session SDdiff maps showed a low variance within each session (fig. 2), but increased with larger time periods between scans. The mean voxelwise within-session, in-between-session and between-days within-subject SDdiff were 0.033 (95th percentile is 0.13%), 0.064 (95th percentile is 0.25%), 0.093% (95th percentile is 0.36%) respectively. The variance was highest in the skull base (within-session, in-between-session, and between-days SDdiff: 0.57, 1.24, and 1.72%) and lowest occipitally and centrally (within-session, in-between-session, and between-days SDdiff: 0.06, 0.1, and 0.13% and 0.08, 0.15, and 0.22% respectively for occipital and central regions).
Covariance analysis in healthy volunteers
The total variance was unexpectedly low and appears to be mainly explained by variability between participants rather than measurement error (Table 2). The variances corroborate the visual findings shown by the SDdiff maps (fig. 2). Moreover, the reproducibility decreased with increasing time between scans.
Findings in glioma patients
The within-session within-subject SDdiff for patients was 0.024% (n=10). Intratumoral mean MTRasym ranged from 0.56 to 3.11%. Contralateral same-sized ROI MTRasym in healthy-appearing tissue were 0.0-0.94% (fig. 3). For GBM (n=7), the mean MTRasym value of the tumors was 2.27% whereas the mean contralateral MTRasym value was 0.75. The effect size between GBMs and contralateral tissue is 1.52. The SDdiff is 6% of the effect size when considering the between-days SDdiff in the healthy volunteers.
Discussion
These findings show that APT MTRasym measurements have good reproducibility for healthy volunteers even over longer periods of time in a clinical setting. Note that the mean between-days session SDdiff was much smaller than the absolute APT-CEST values. However, focal signal inhomogeneity in areas close to the skull base can be an issue.The in-between scan variance can be caused by the correction of B0 inhomogeneity and potentially also by registration errors.
Tumors expectedly showed larger APT-CEST values than healthy tissue. The effect size between tumors and healthy tissue was large compared to the mean between-days within-subject SDdiff. Tagao et al. used a similar scanning protocol and found comparable results.7 However they looked at mean tumor APT-CEST values, while we also performed a voxel-wise reproducibility analysis on healthy volunteers, which allows for more general conclusions concerning broader clinical applications.
Conclusion
The current study demonstrates that APT-CEST results have a very high consistency between scan timepoints for the entire brain and masked regions including tumor at 3T. APT-CEST can therefore be recommended for clinical applications in the brain including monitoring and cut-off value determination.Acknowledgements
No acknowledgement found.References
2. Zhou J, Payen J-F, Wilson DA, Traystman RJ, van Zijl PCM. Using the amide proton signals of intracellular proteins and peptides to detect pH effects in MRI. Nat Med. 2003;9:1085–1090.
3. Zou T, Yu H, Jiang C, Wang X, Jiang S, Rui Q, et al. Differentiating the histologic grades of gliomas preoperatively using amide proton transfer-weighted (APTW) and intravoxel incoherent motion MRI. NMR Biomed. 2017;31. doi:10.1002/nbm.3850
4. Jiang S, Eberhart CG, Zhang Y, Heo H-Y, Wen Z, Blair L, et al. Amide proton transfer-weighted magnetic resonance image-guided stereotactic biopsy in patients with newly diagnosed gliomas. Eur J Cancer. 2017;83:9–18.
5. Dou W, Lin C-YE, Ding H, Shen Y, Dou C, Qian L, et al. Chemical exchange saturation transfer magnetic resonance imaging and its main and potential applications in pre-clinical and clinical studies. Quant Imaging Med Surg. 2019;9:1747–1766.
6. Zhang Y, Yong X, Liu R, Tang J, Jiang H, Fu C, et al. Whole-brain chemical exchange saturation transfer imaging with optimized turbo spin echo readout. Magn Reson Med. 2020;84:1161–1172.
Figures
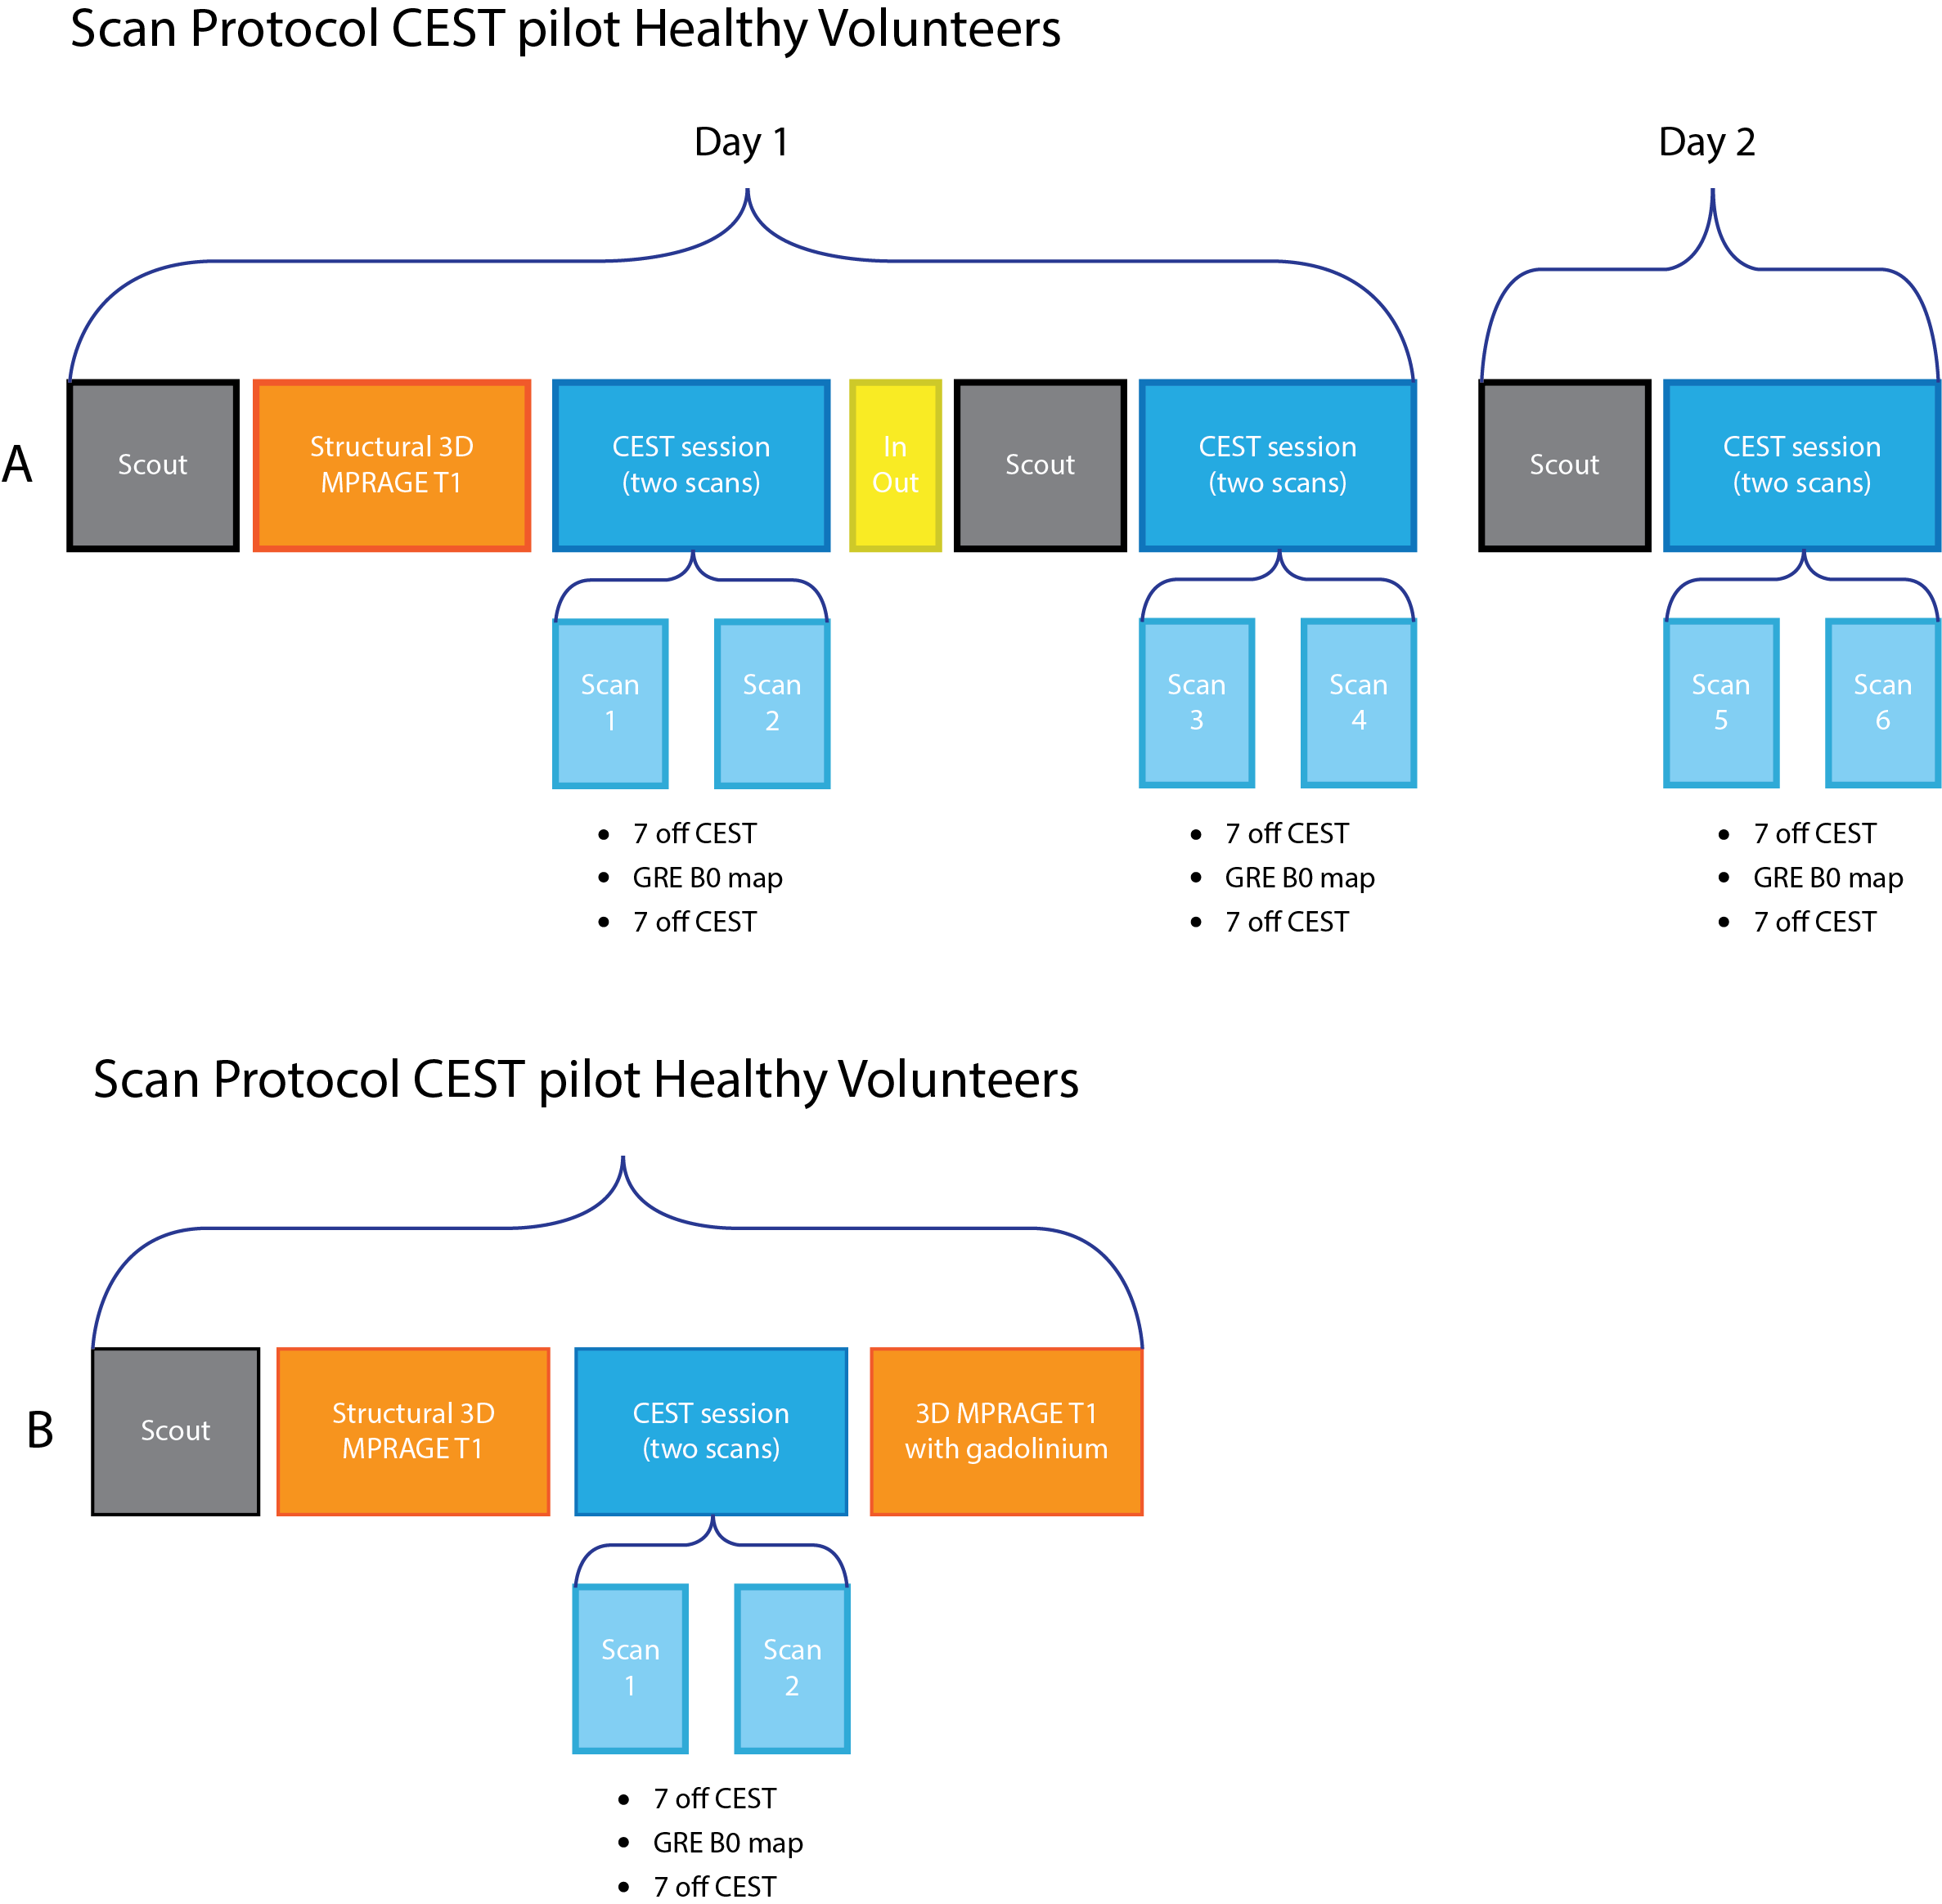
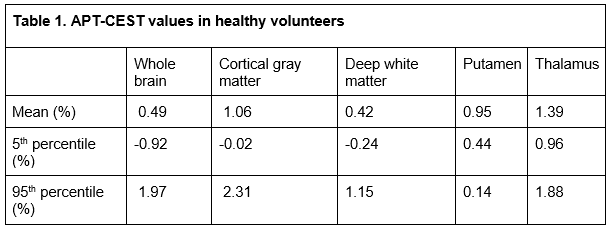
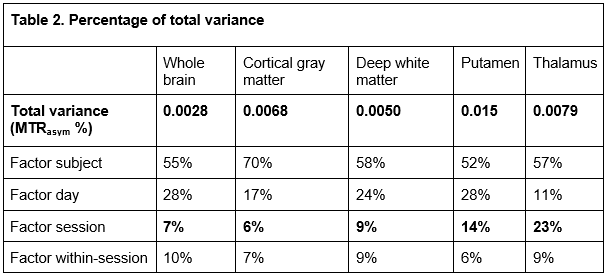
Table 2. Variance components shown for factors subject, day, session and within-session. If we take an example tumor MTRasym of 2% and contralateral healthy tissue of 0.5%, the total variance is relatively low.
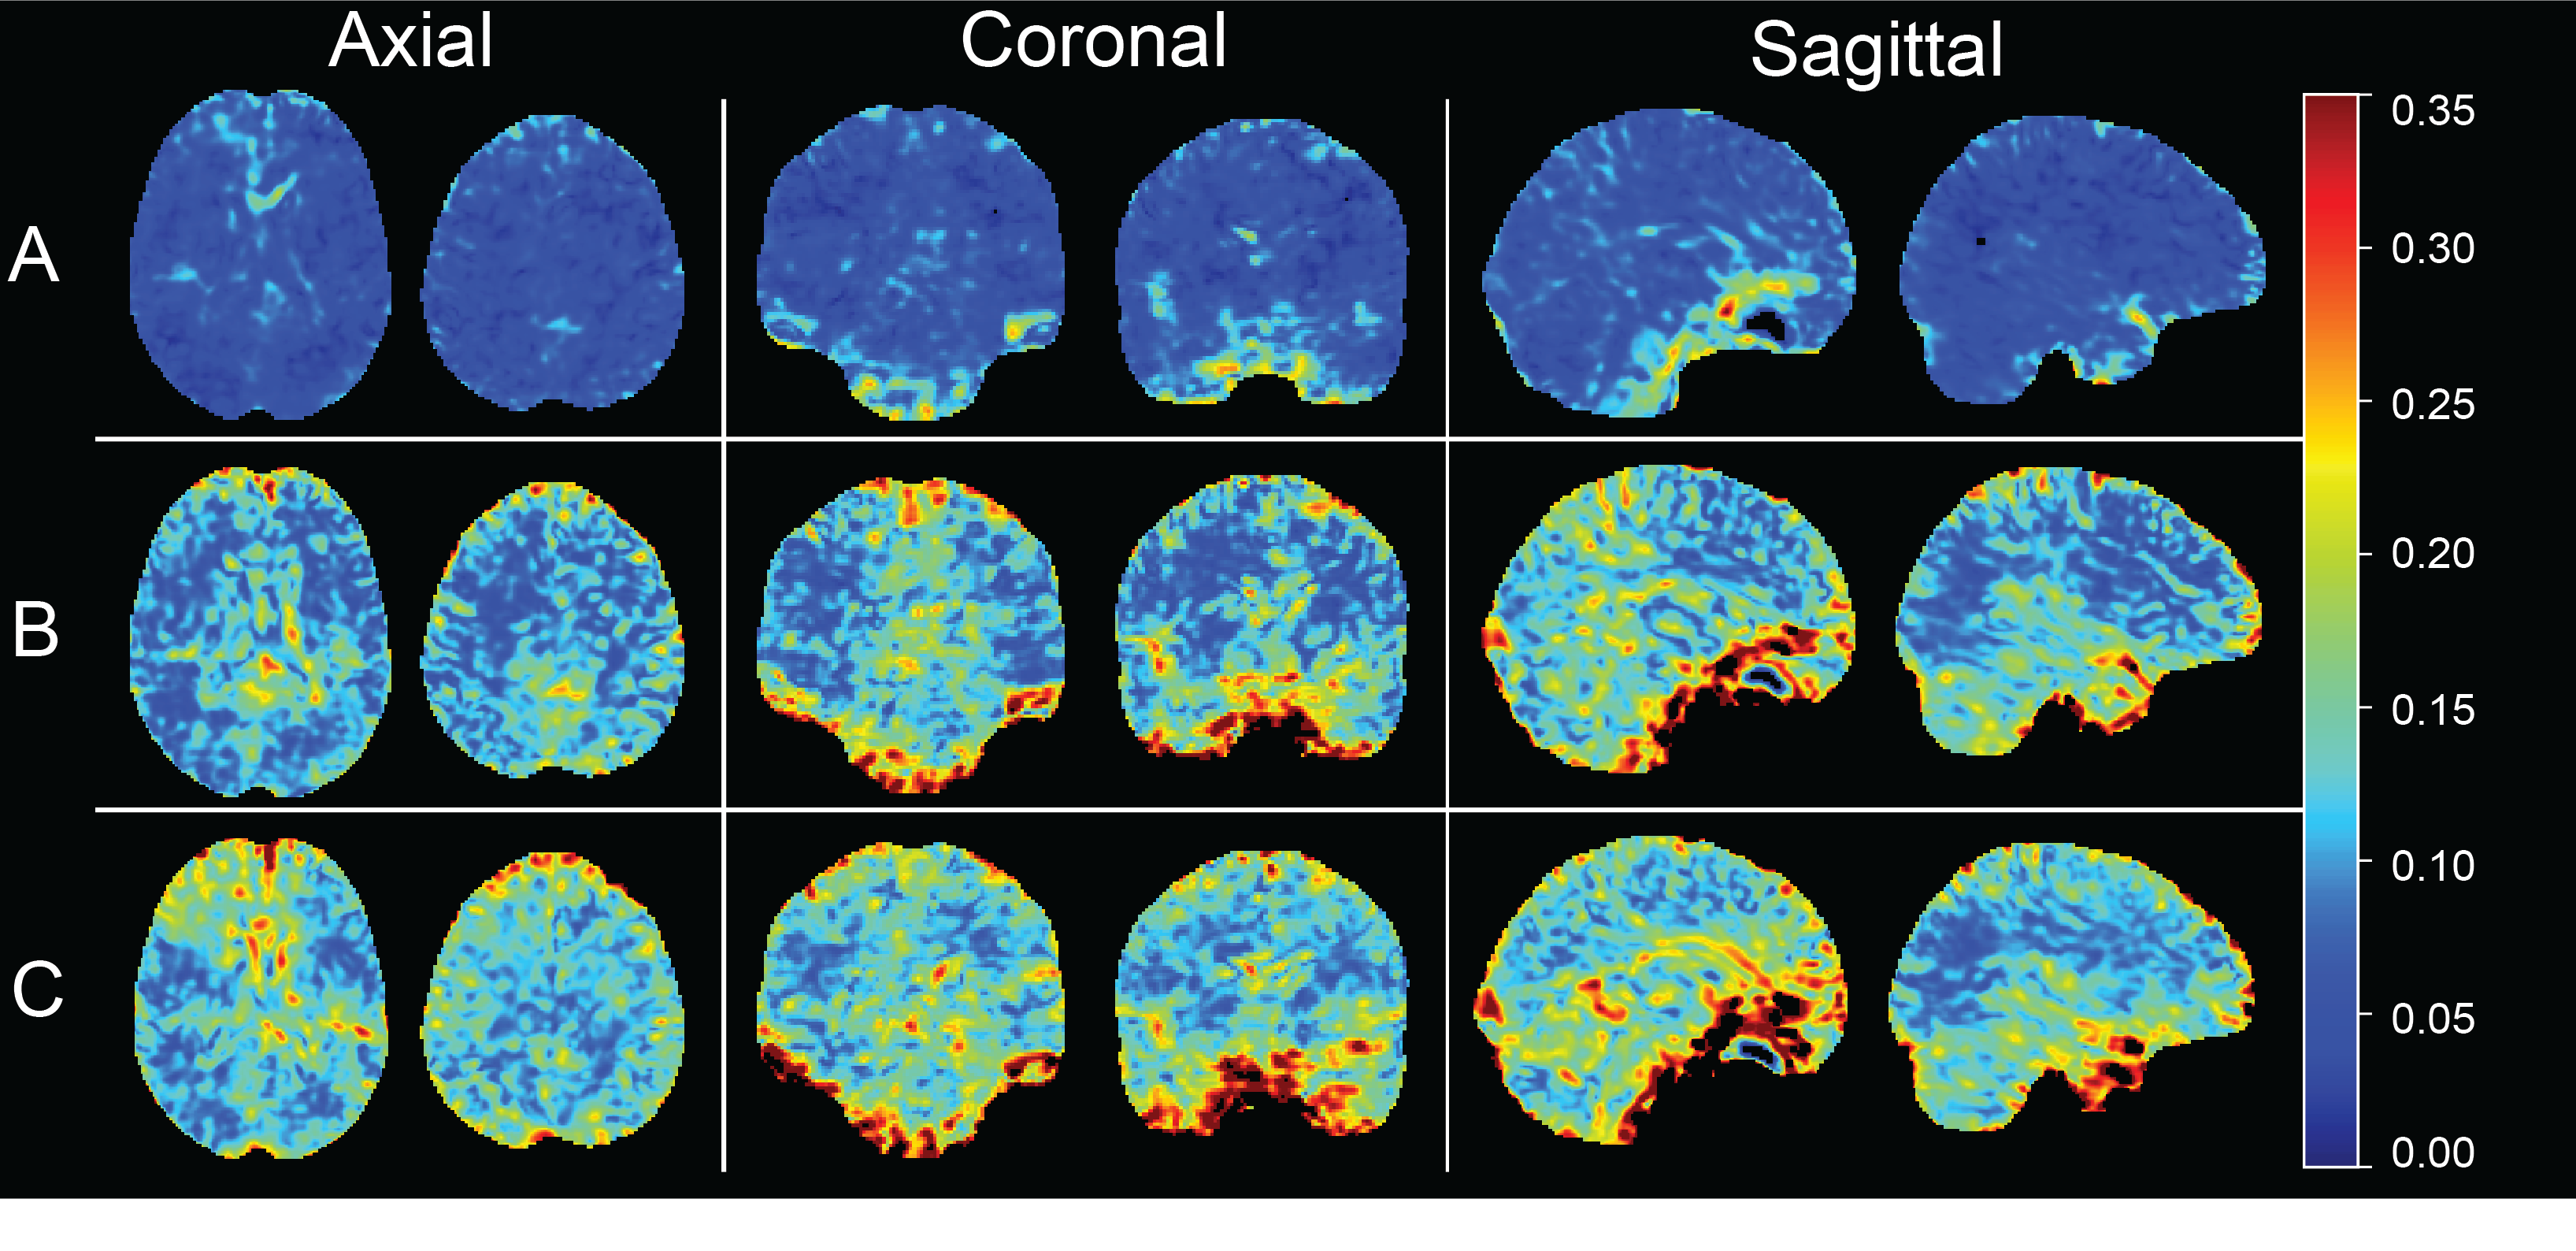
Figure 2. Standard deviation (SDdiff) maps of the within-subject difference between scan sessions 1-2, 1-4, and 1-6 (rows A, B, and C, respectively), for all participants (n=21). Higher SD of the difference means lower reproducibility. Note how the reproducibility lowers as physiological variability seems to increase with a larger time difference.
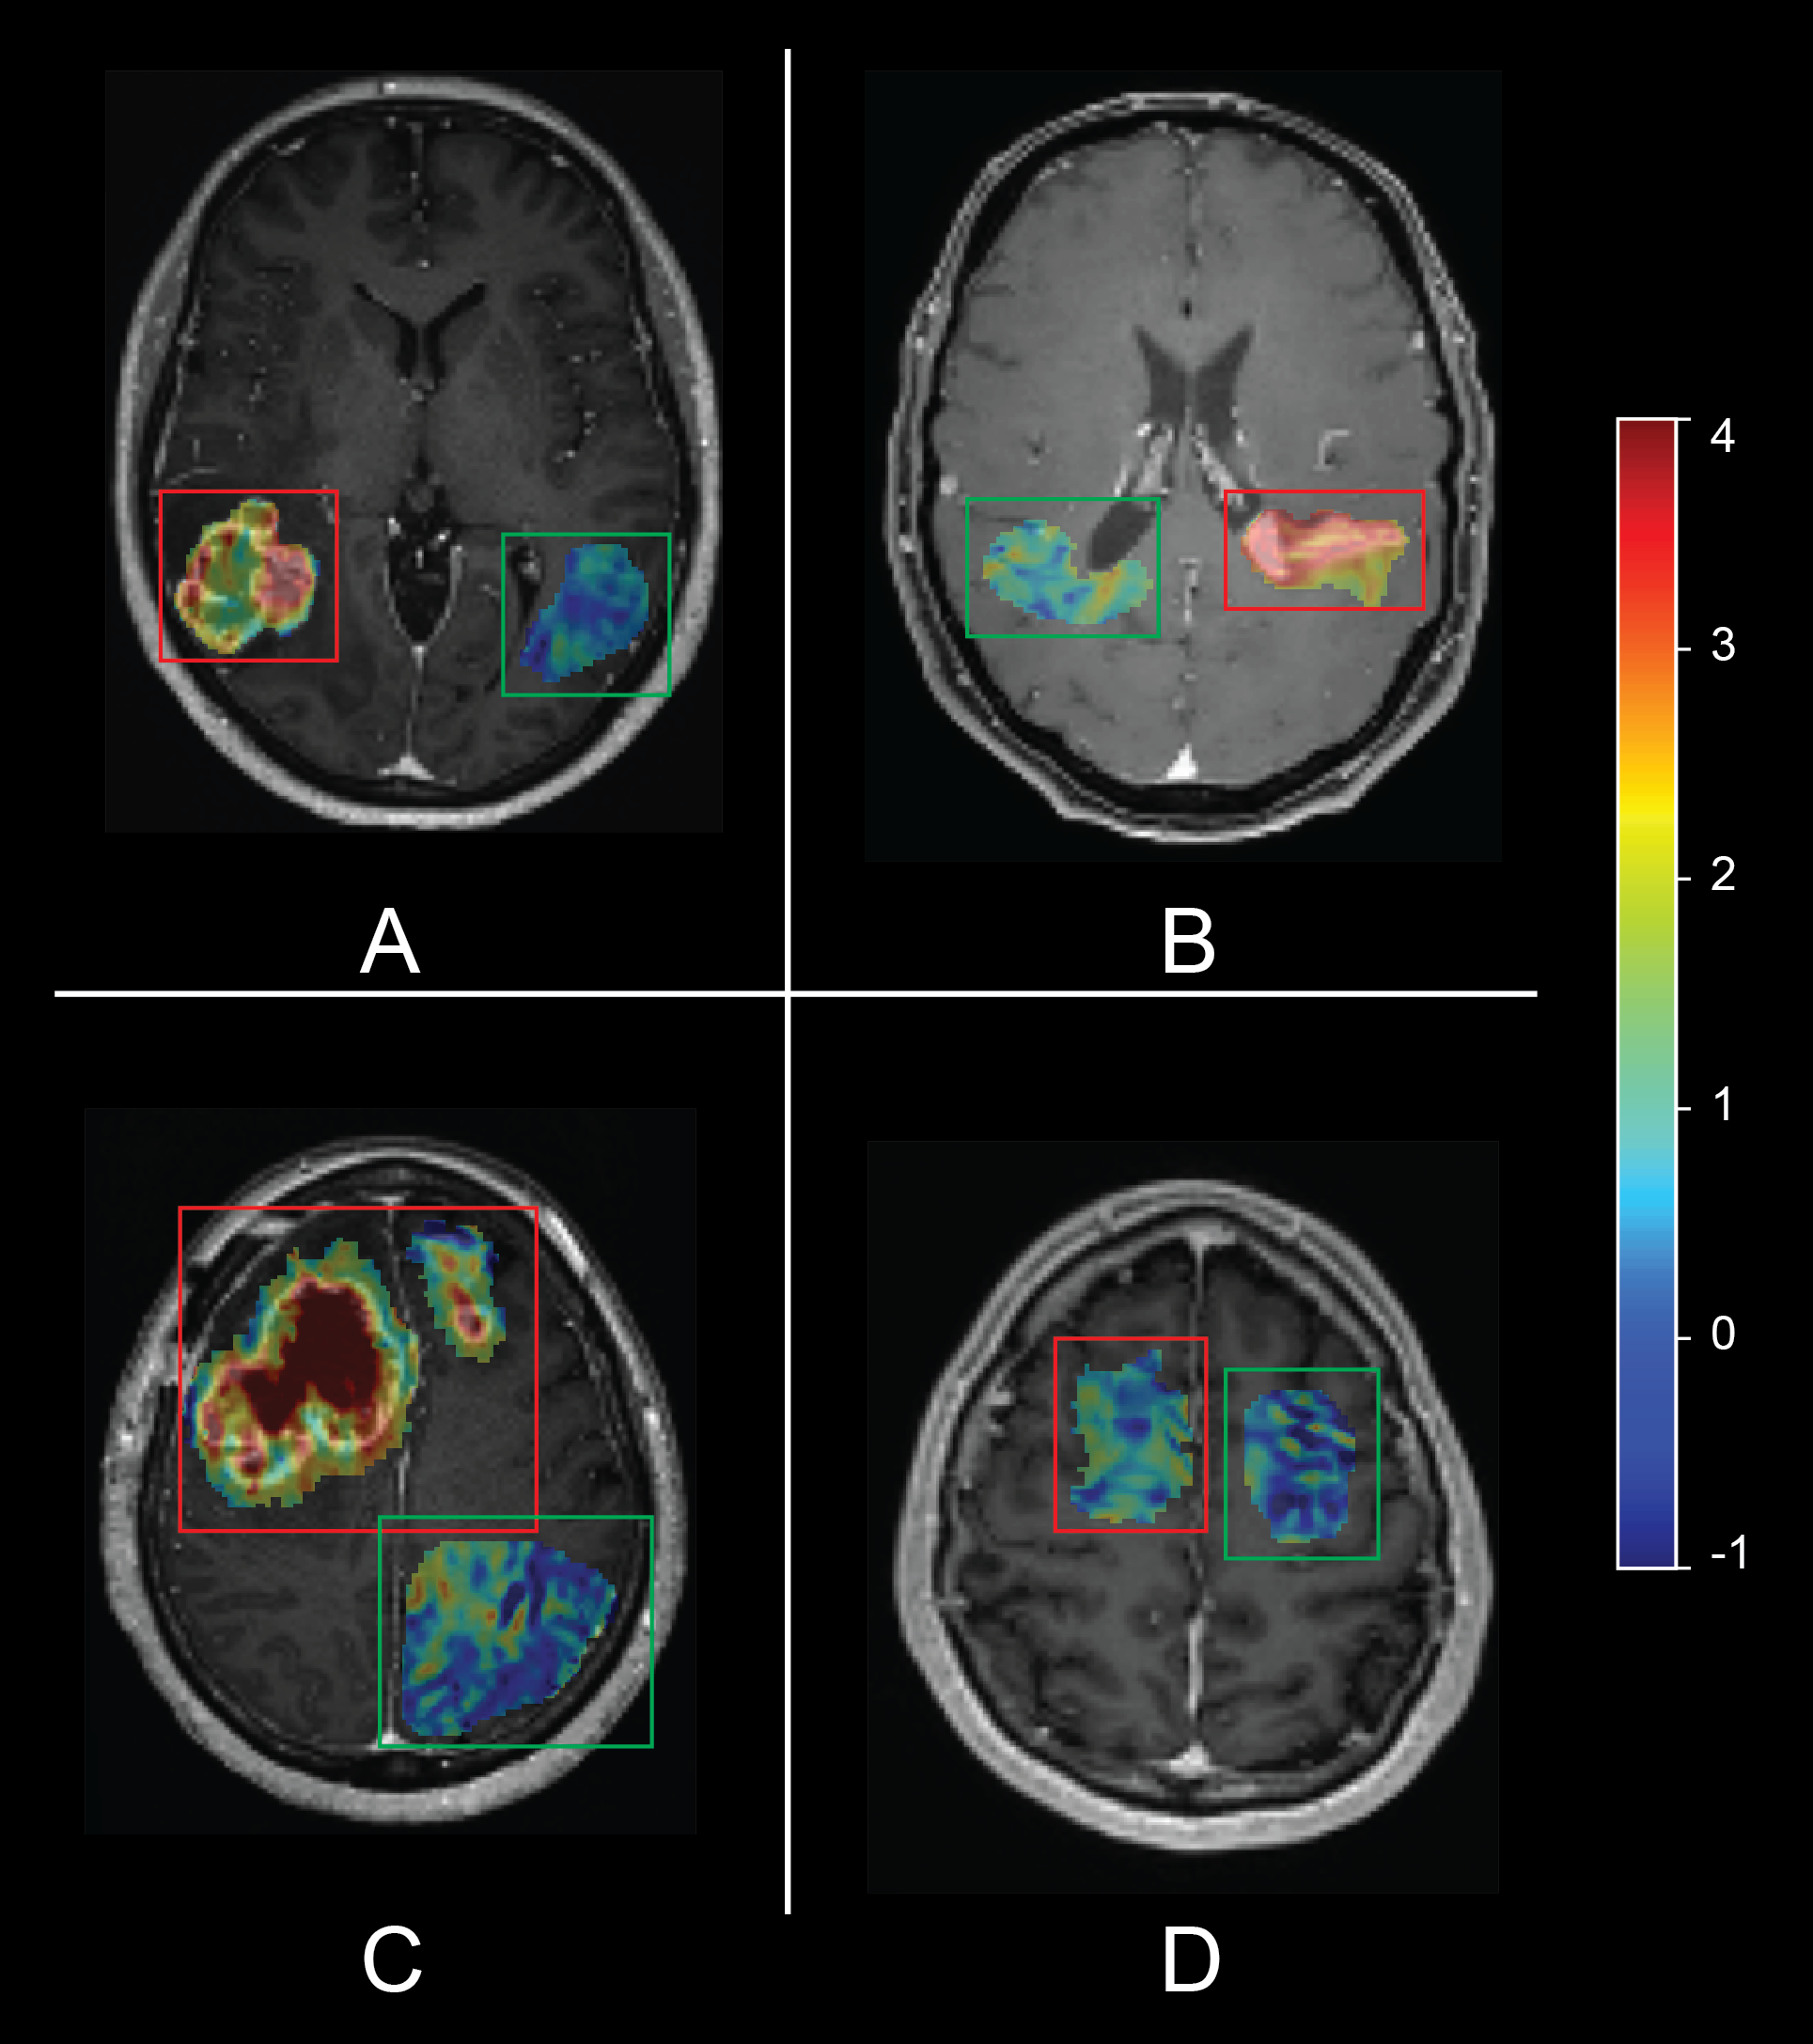
Figure 3. Single transversal APT-CEST slices of four glioblastoma patients, CEST values in color scale projected on the post-contrast T1w image, within the tumor ROI only. Red and green boxes are positioned around the tumor and contralateral ROIs, respectively. Note the heterogeneous hyperintensity in the tumorous regions on the T1 when compared to the contralateral region (A-C). D shows the APT-CEST value of a non-enhancing GBM.