2786
Non-steady-state sequences for multi-parametric MRI need to be evaluated in the context of gradient-encoding1Computational Imaging Group for MR Diagnostics and Therapy, Center for Image Sciences, University Medical Center Utrecht, Utrecht, Netherlands, 2Department of Radiology, Division of Imaging and Oncology, University Medical Center Utrecht, Utrecht, Netherlands
Synopsis
In non-steady-state multi-parametric quantitative MRI (e.g. MR-STAT or MR Fingerprinting (MRF)), it is a non-trivial task to devise good sequences of time-varying flip angles. Recent work addresses this issue, albeit assuming a single-voxel approach, i.e. the k-space encoding is not taken into account when optimizing. In this work we show, using examples from MR-STAT reconstructions and using a Cramer-Rao based BLAKJac analysis, that two apparently similar sequences can have vastly different outcomes when applied in an actual (2-dimensional) measurement setup - showing that the context of encoding is very relevant.
Introduction
In MR-STAT1 as well as in MR Fingerprinting (MRF)2 and in Hybrid-state imaging3, flip angle trains are usually time-varying. This gives many degrees of freedom to devise good sequences of flip angles, which is a non-trivial task. Recent work addresses this issue3-9, albeit assuming a single-voxel approach, i.e. the k-space encoding is not taken into account when optimizing. In the context of MR-STAT multi-parametric reconstructions, in this study we use experiments as well as BLAKJac12, an analytical framework to analyze the combined effects of RF and gradient-encoding, to show that two sequences with equivalent performance in a single-voxel approach can have vastly different outcomes when applied in an actual (2-dimensional) measurement setup.Methods
Single-slice (2D) MR-STAT scans were made of a phantom setup and of a volunteer. The phantom setup consisted of 16 vials of the Eurospin II phantom set10 plus one kiwifruit in order to visually assess the rendition of high spatial frequencies. In addition, a single-voxel scan (without encoding gradients) was done of on a homogenous central slice of vial 7 of the set.We used a Cartesian pseudo-SSFP sequence on a 3T scanner (Philips Elition), with TR=10ms and TE=5ms. we define two RF tip angle patterns, called "Incoherent" and "Coherent", as shown in fig. 1. The latter is chosen to be in-sync with the phase-encoding pattern. These two have almost identical performance based on a single-voxel Cramer-Rao based analysis (see table 1).
For the 2D scans, the acquisition voxel size was 1mm x 1mm, slice thickness of 5mm, with a Field Of View of 224mm, requiring 224 phase-encoding steps. The set of phase-encoding steps was repeated 5 times in order to allow MR-STAT reconstruction11 of maps of proton density, T1 and T2. In total, 1120 readout-lines were acquired. This setup was re-scanned 10 times which led to 10 separate reconstructions, in order to allow for an estimate of standard deviations in the resulting maps.
In the single-voxel scans, the phase-encoding was switched off. The readout-gradient was still active, to obtain more measurement points over a homogenous region of the tube. The slice thickness was chosen to 1.5mm. This was 20 times re-scanned and re-reconstructed. For the phantom scans (2D and single-voxel), standard deviations (SD) were calculated per voxel over the 10 (or 20) re-scans. These SD were averaged over regions of interest (ROI) for all the vials for 2D.
Concurrently, a Cramer-Rao based BLAKJac analysis12 was applied to predict the outcomes of the standard deviations.
Results
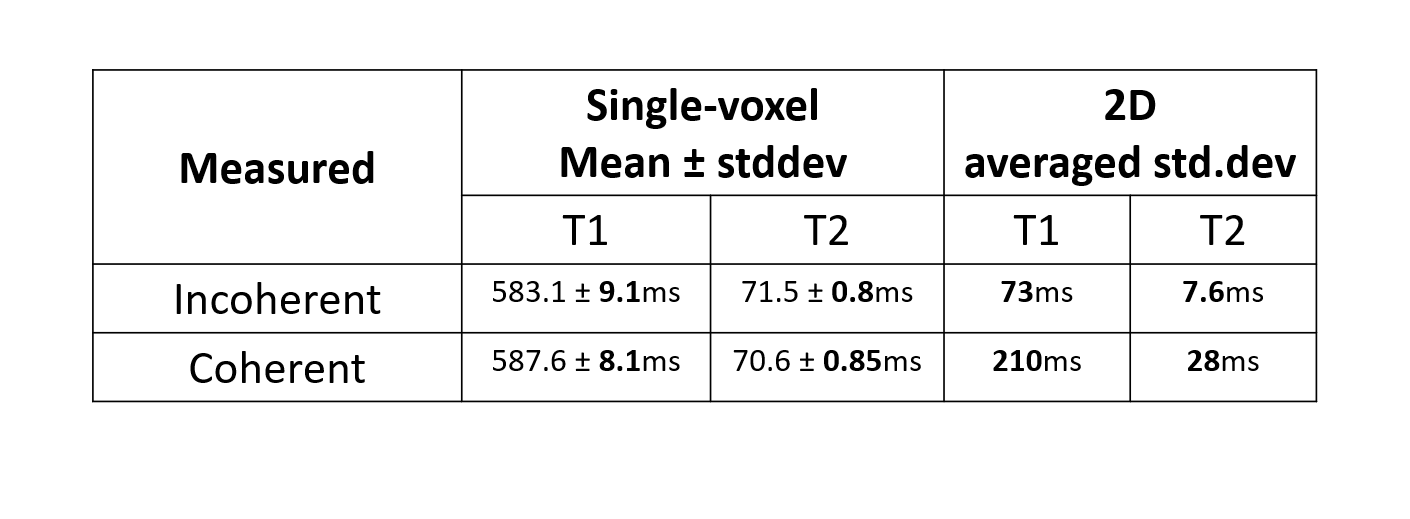
The Cramer-Rao based BLAKJac analysis results are provided in table 1, indicating that the two sequences are expected to have identical performance on single-voxel, yet to be different by a factor of 3 to 7 on a 2D measurement.The results of the single-voxel scan are summarized in the left half of table 2. The differences in SD between the Coherent and Incoherent sequences are not significant.
Figure 2 shows the phantom results, showing very poor rendition of the Coherent sequence. In addition, the measured standard deviations - averaged over all vials - is 2.9 times (T1) resp. 3.7 times (T2) higher on the Coherent sequence compared to "Incoherent". This ratio is slightly smaller than predicted; this is due to early stopping of the iteration of the Coherent sequence, which has not reached a stable result after 50 iterations, while "Incoherent" usually stabilizes already after 6 iterations.
Figure 3 shows the in-vivo results. The measured standard deviation, averaged over the whole image, is a factor of 2.0 (T1) resp. 2.4 (T2) higher for the Coherent sequence compared to "Incoherent". Also the bias (deviation from literature values) is substantially higher.
Discussion
The two test sequences of RF angles perform similarly in a single-voxel setup, as was predicted by the Cramer-Rao based analysis. In the absence of phase-encoding, the calculated performance is identical.Yet, in the context of gradient-encoding, it really does matter whether the RF sequence shows incoherence with the phase-encoding pattern or whether it synchronizes to it. Without incoherence, all spatial frequencies are measured under almost identical sensitivities to T1 and T2, which makes the inversion problem ill-posed. Indeed, in the context of encoding, the Coherent sequence shows roughly 3 times more noise than the Incoherent sequence, as predicted by BLAKJac.
Conclusion
A sequence that is optimal in a single-voxel approach might be suboptimal in a setup where phase-encoding (or, encoding in general) is applied. So the Cramer-Rao based analysis has to take the encoding pattern into account, which is effectively done by our BLAKJac analysis.Acknowledgements
This work has been financed by NWO grant number 17986References
- A. Sbrizzi et al, “Fast quantitative MRI as a nonlinear tomography problem”, Magnetic Resonance Imaging 46(2018): 56-63 O. van der Heide et al, NMR in Biomedicine, 202;33:e4251
- Ma D, Gulani V, Seiberlich N, et al. Magnetic resonance fingerprinting. Nature, 2013;495187–495192.
- Assländer J, Novikov DS, Lattanzi R, Sodickson DK, Cloos MA. Hybrid‐state free precession in nuclear magnetic resonance. COMMUNICATIONS PHYSICS (2019) 2:73
- K.Sommer, T.Amthor, M.Doneva, P.Koken, J.Meineke, P.Börnert. Towards predicting the encoding capability of MR fingerprinting sequences. Magnetic Resonance Imaging, Volume 41, September 2017, Pages 7-14.
- Bo Zhao, Justin P. Haldar, Kawin Setsompop, Lawrence L. Wald. Maximum Likelihood Reconstruction for Magnetic Resonance Fingerprinting. Conf Proc IEEE Eng Med Biol Soc. 2016 August ; 2016: 453–456.
- Bo Zhao, Justin P. Haldar, Congyu Liao, Dan Ma, Yun Jiang, Mark Griswold, Kawin Setsompop, Lawrence L. Wald. Optimal Experiment Design for Magnetic Resonance Fingerprinting. Conf Proc IEEE Eng Med Biol Soc. 2016 August ; 2016: 453–456.
- Ouri Cohen, Matthew Rosen. Algorithm comparison for schedule optimization in MR fingerprinting. Magnetic Resonance Imaging, Volume 41, September 2017, Pages 15-21
- Mickevicius, Nencka, Paulson. Reducing the Dimensionality of Optimal Experiment Design for Magnetic Resonance Fingerprinting. https://ui.adsabs.harvard.edu/abs/2020arXiv201000674M/abstract
- Philip K. Lee et al. Flexible and efficient optimization of quantitative sequences using automatic differentiation of Bloch simulations. Magn Reson Med. 2019;82:1438–1451
- TO5, Eurospin II test system, Scotland
- Oscar van der Heide, A. Sbrizzi, P. Luijten, C.A.T. van den Berg. High-resolution in vivo MR-STAT using a matrix-free and parallelized reconstruction algorithm. NMR in Biomedicine. 2020;33:e4251
- M. Fuderer, O. van der Heide, A. Sbrizzi, C.A.T. van den Berg. BLAKJac
- A computationally efficient noise-propagation performance metric for
the analysis and optimization of MR-STAT sequences. Proc. Intl. Soc. Mag. Reson. Med. 29 (2021), 3059.
Figures

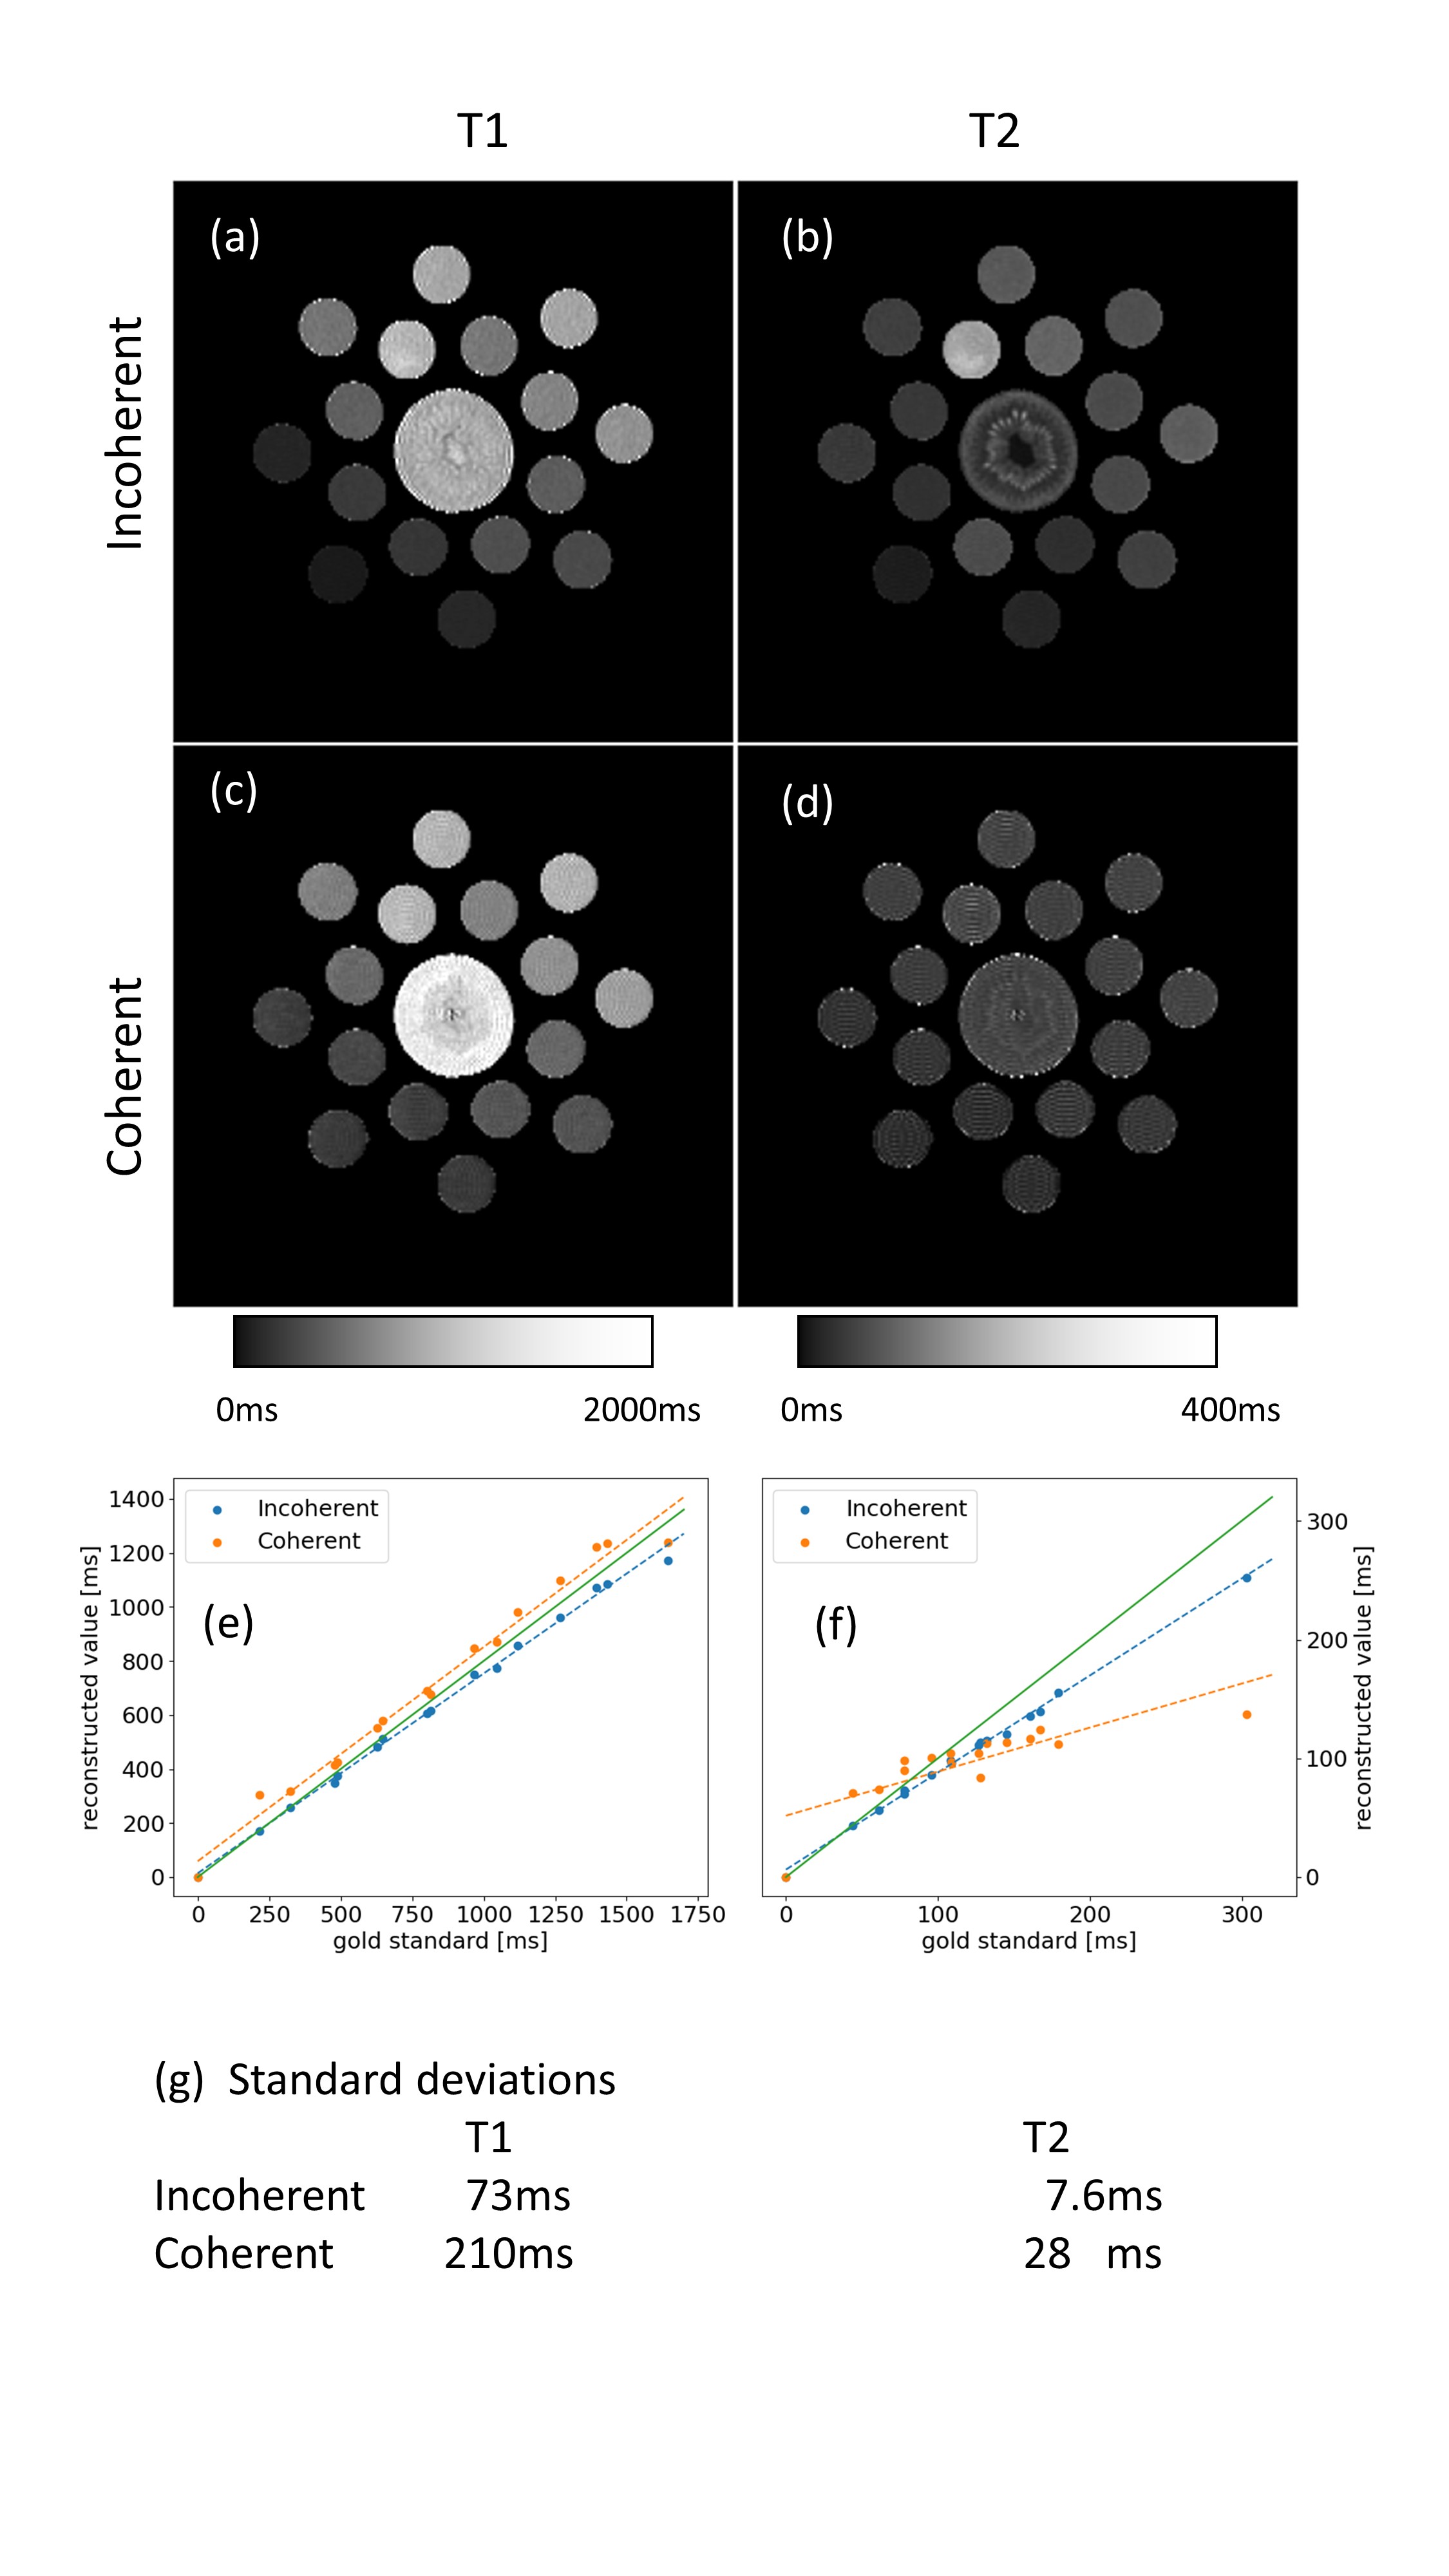
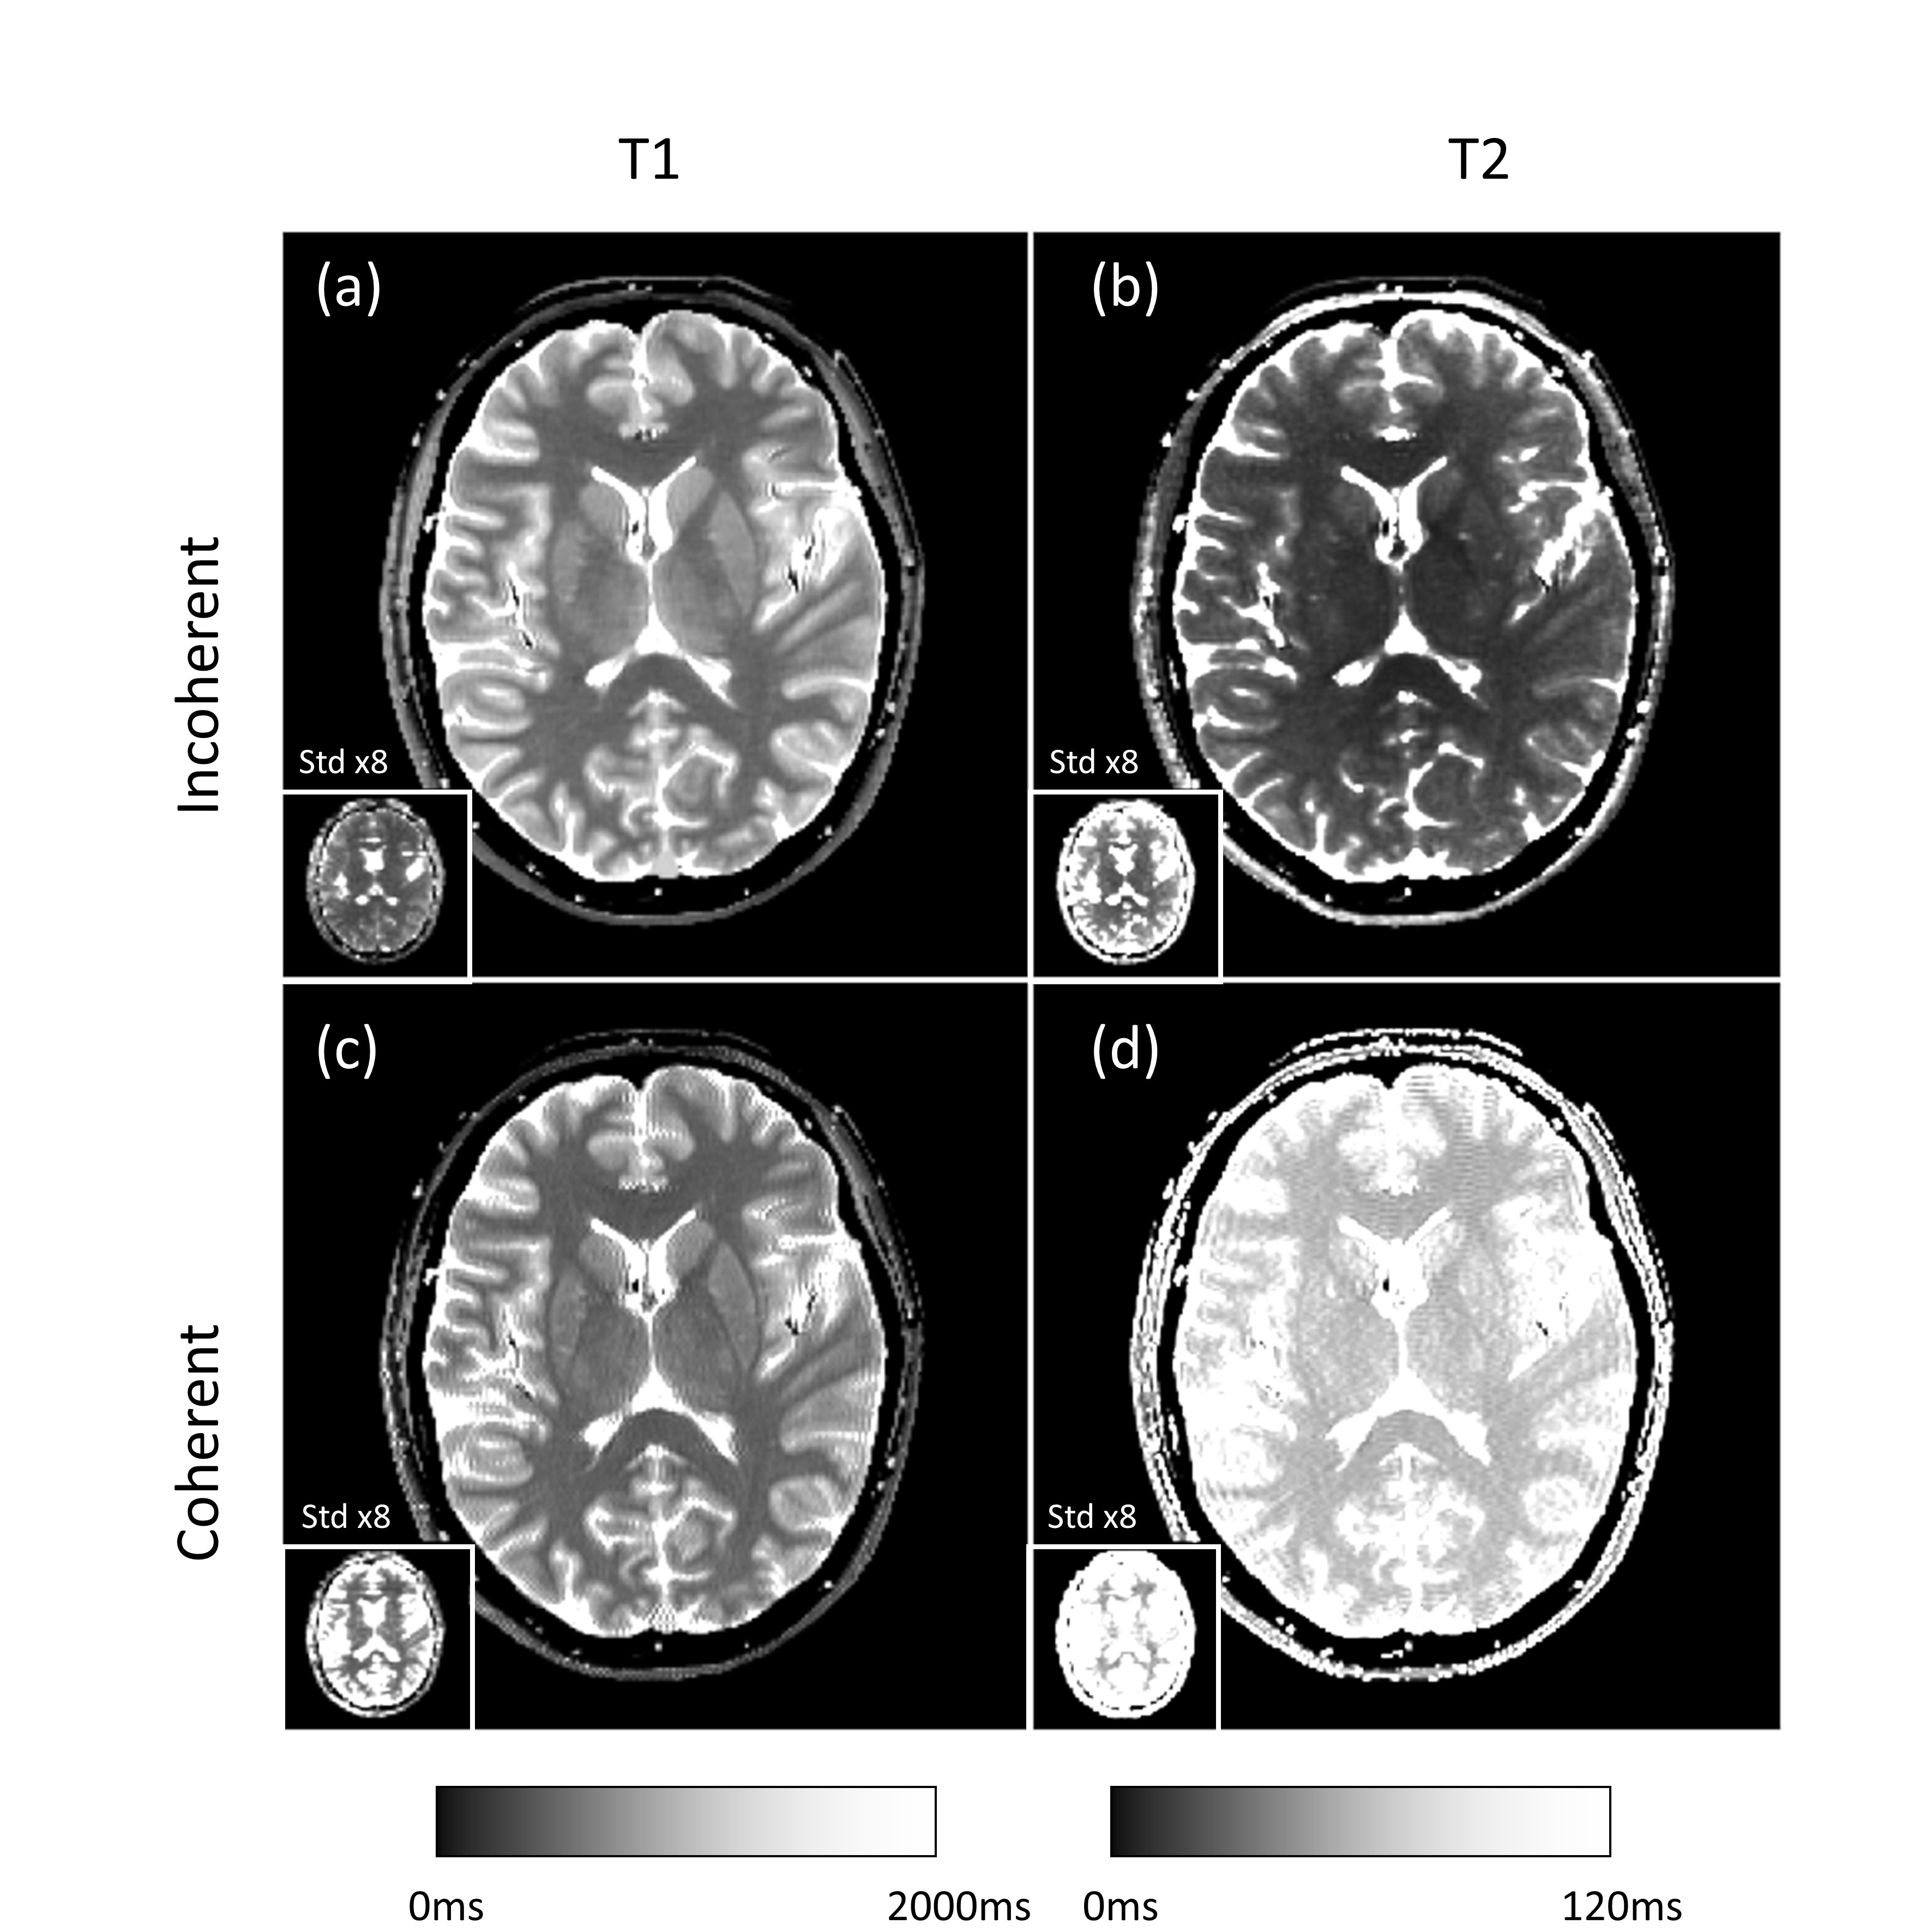
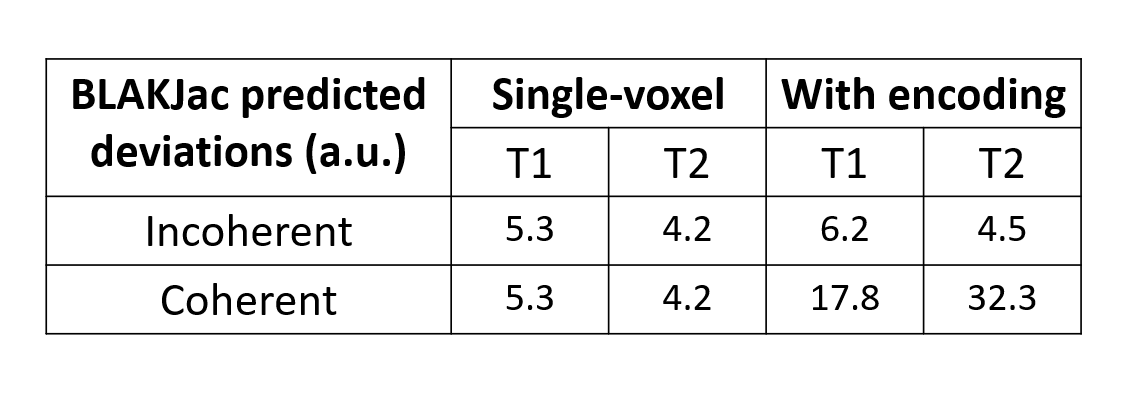
Table 1: The Cramer-Rao based analysis (BLAKJac) prediction of noise standard deviation values (arbitrary units) on T1- and T2-maps for the two sequences; this indicates that the Incoherent sequence is greatly superior to the Coherent sequence when taking encoding into account.