2785
Multi-center, Multi-vendor evaluation of quantitative susceptibility mapping for quantification of liver iron
Collin J. Buelo1,2, Ruiyang Zhao1,2, Julia V. Velikina1, Steffen Bollmann3, Ante Zhu4, Qing Yuan5, Mounes Aliyari Ghasabeh6, Stefan Ruschke7, Dimitrios C. Karampinos7, David T. Harris1, Ryan J. Mattison8, Michael R. Jeng9, Ivan Pedrosa5, Ihab R. Kamel5, Shreyas Vasanawala10, Takeshi Yokoo5,11, Scott B. Reeder1,2,8,12,13, and Diego Hernando1,2
1Radiology, University of Wisconsin-Madison, Madison, WI, United States, 2Medical Physics, University of Wisconsin-Madison, Madison, WI, United States, 33School of Information Technology and Electrical Engineering, The University of Queensland, Brisbane, Australia, 4GE Global Research, Niskayuna, NY, United States, 5Radiology, University of Texas Southwestern Medical Center, Dallas, TX, United States, 6Radiology, The Johns Hopkins University, Baltimore, MD, United States, 7Department of Diagnostic and Interventional Radiology, Technical University of Munich, Munich, Germany, 8Medicine, University of Wisconsin-Madison, Madison, WI, United States, 9Pediatrics - Hematology & Oncology, Stanford University, Palo Alto, CA, United States, 10Radiology, Stanford University, Palo Alto, CA, United States, 11Advanced Imaging Research Center, University of Texas Southwestern Medical Center, Dallas, TX, United States, 12Department of Biomedical Engineering, University of Wisconsin-Madison, Madison, WI, United States, 13Emergency Medicine, University of Wisconsin-Madison, Madison, WI, United States
1Radiology, University of Wisconsin-Madison, Madison, WI, United States, 2Medical Physics, University of Wisconsin-Madison, Madison, WI, United States, 33School of Information Technology and Electrical Engineering, The University of Queensland, Brisbane, Australia, 4GE Global Research, Niskayuna, NY, United States, 5Radiology, University of Texas Southwestern Medical Center, Dallas, TX, United States, 6Radiology, The Johns Hopkins University, Baltimore, MD, United States, 7Department of Diagnostic and Interventional Radiology, Technical University of Munich, Munich, Germany, 8Medicine, University of Wisconsin-Madison, Madison, WI, United States, 9Pediatrics - Hematology & Oncology, Stanford University, Palo Alto, CA, United States, 10Radiology, Stanford University, Palo Alto, CA, United States, 11Advanced Imaging Research Center, University of Texas Southwestern Medical Center, Dallas, TX, United States, 12Department of Biomedical Engineering, University of Wisconsin-Madison, Madison, WI, United States, 13Emergency Medicine, University of Wisconsin-Madison, Madison, WI, United States
Synopsis
Quantitative susceptibility mapping (QSM) of the liver is an emerging method to quantify liver iron concentration (LIC). Multiple new methods have recently been introduced for QSM in the liver. These methods include CobraChi, a deep learning-based method, as well as an L2-optimization based method. This work evaluates the performance of these liver QSM methods across multiple centers and MRI vendors.
Introduction
Quantitative susceptibility mapping (QSM) in the liver is an emerging method to quantify liver iron concentration (LIC) that offers significant advantages over other methods[1]. Multiple new methods have recently been introduced for QSM in the liver. These methods include CobraChi, a deep learning-based method[2,3], as well as an L2-optimization based method[4–6].Previous evaluations of these methods were limited to a single center with a single MRI vendor. Multi-center, multi-vendor validation of QSM in the liver is necessary to enable widespread dissemination of QSM as a non-invasive, quantitative measure of iron overload. Therefore, the purpose of this work was to evaluate these two QSM methods across multiple centers and MRI vendors.
Methods
QSM Methods: Two methods for QSM estimation without the need for prior background field removal were used in this study:- CobraChi was trained by generating synthetic field maps from a digital liver phantom, and feeding them into a modified 3D U-net (no explicit background field removal included when processing in-vivo data) [2,3].
- The L2-optimization based method is an iterative method that uses Laplacian-based background field removal and gradient-based penalty and subcutaneous adipose tissue as a zero-reference to regularize the QSM estimation[4–6]
MRI acquisition: An FDA-approved single spin-echo R2-based relaxometry method at 1.5T (Ferriscan, Resonance Health, Australia) was used at each site to provide a common reference for LIC. Ferriscan LIC was converted to susceptibility through a previously measured calibration, in order to obtain reference susceptibility measurements[8]. A multi-echo 3D spoiled gradient-echo (SGRE) sequence with monopolar readouts was acquired at 3T for QSM reconstruction. The acquisition parameters were as follows: FOV=40x32cm2, acquisition matrix=256x144, slice=8mm, TR=8ms, flip=9°, 6 echoes with TE1=1.2ms, ΔTE=1.0ms.
Data Processing: From the multi-echo SGRE data, the following maps and images were reconstructed: B0 field map, proton density fat fraction (PDFF) map and R2* map, as well as separated water- and fat-only images. The B0 field map (without background field removal) was linearly interpolated from 8mm to 2.25mm slice thickness for input into CobraChi. The uninterpolated B0 field map, PDFF, and R2* maps were used as input for the L2-based method. PDFF maps were used to create a fat mask for a zero reference throughout the image volume, and a scaled R2* map was used as an initial guess to decrease computation time. Data processing pipelines are shown for both methods in Figure 1.
Measurement and analysis: For both QSM algorithms, multiple region-of-interest (ROI)-based susceptibility measurements were performed in different slices in the right liver lobe as well as in the adjacent subcutaneous fat (as a known susceptibility reference that does not accumulate iron). Overall liver susceptibility was calculated as the average of the liver ROI measurements after subtracting the corresponding adjacent fat ROI measurements. Linear correlation analysis was performed for each method with reference susceptibility estimates.
Results
179 patients with LIC between 0.3 and 32.3 mg Fe/g dry tissue were included in this study. Four patients with LIC above 37 mg Fe/g dry tissue were excluded due to poor signal-to-noise ratio (SNR) leading to poor field map reconstruction. Example images are shown in Figure 2, with field map, CobraChi reconstruction, and L2 QSM reconstruction shown for each of the 3 vendors in this study.Correlation with Ferriscan susceptibility is shown in Figure 3 for CobraChi and Figure 4 for the L2 method. Correlation between the two QSM methods is shown in Figure 5. Across sites, CobraChi underestimated susceptibility (slope with reference between 0.85 and 0.98), but less than the L2 method (slope with reference between 0.42 and 0.79). The L2 method tends to estimate a lower susceptibility value across all sites at higher iron levels; in comparison, CobraChi performed substantially better in patients with high iron
Discussion
In this work we evaluated two different liver QSM methods across multiple centers and MRI vendors in patients with iron overload. Both methods achieved strong correlation across centers and across patients with a wide range of iron concentrations. These data suggest good reproducibility across centers and vendors.Both QSM methods demonstrated promising performance, but also had limitations. CobraChi suffered from shading across the susceptibility map, which the L2 method avoids through the use of the fat constraint. However, CobraChi demonstrated a wider dynamic range with better performance at high LIC compared to the L2 method. The rapid reconstruction time of CobraChi (approximately 1 second on an NVIDIA A100 Ampere GPU vs 20 minutes for CPU computation of the L2 method) was an additional advantage.
A limitation of this work is that it only evaluated patients at 3T. Further validation across field strengths remains as future work. Correlation with non-MRI reference for iron concentration (such as SQUID liver biosusceptometry or biopsy-based liver iron quantification) would be desirable.
In conclusion, this work evaluates the performance of two liver QSM methods in patients with iron overload across multiple centers and MRI vendors.
Acknowledgements
The authors wish to acknowledge support from the NIH (R01 DK117354, R01 DK100651, R01 DK088925). Also, GE Healthcare provides research support to the University of Wisconsin. Dr. Reeder is a Romnes Faculty Fellow and has received an award provided by the University of Wisconsin-Madison Office of the Vice Chancellor for Research and Graduate Education with funding from the Wisconsin Alumni Research Foundation.References
[1] J. Li et al., “Quantitative susceptibility mapping (QSM) minimizes interference from cellular pathology in R2* estimation of liver iron concentration,” J. Magn. Reson. Imaging, vol. 48, no. 4, pp. 1069–1079, 2018, doi: 10.1002/jmri.26019.[2] R. Zhao et al., “Quantitative Susceptibility Mapping of Liver Iron Overload using Deep Learning,” presented at the ISMRM, 2020.
[3] K. G. B. Rasmussen et al., “DeepQSM - Using Deep Learning to Solve the Dipole Inversion for MRI Susceptibility Mapping,” Mar. 2018, doi: 10.1101/278036.
[4] J. V. Velikina et al., “Comparison of Background Field Removal Strategies in Joint Quantitative Susceptibility Mapping in Abdomen,” presented at the ISMRM, 2020.
[5] S. D. Sharma, D. Hernando, D. E. Horng, and S. B. Reeder, “Quantitative susceptibility mapping in the abdomen as an imaging biomarker of hepatic iron overload: QSM as a Biomarker of Hepatic Iron Overload,” Magn. Reson. Med., vol. 74, no. 3, pp. 673–683, Sep. 2015, doi: 10.1002/mrm.25448.
[6] S. D. Sharma et al., “MRI-based quantitative susceptibility mapping (QSM) and R2* mapping of liver iron overload: Comparison with SQUID-based biomagnetic liver susceptometry: QSM and R2*: Comparison With SQUID,” Magn. Reson. Med., vol. 78, no. 1, pp. 264–270, Jul. 2017, doi: 10.1002/mrm.26358.
[7] D. Hernando et al., “Liver R2* as a Biomarker of Liver Iron Concentration: Interim Results from a Multi-Center, Multi-Vendor Reproducibility Study at 1.5T and 3T,” 2018, vol. 0514.
[8] S. Liu et al., “Quantification of liver iron concentration using the apparent susceptibility of hepatic vessels,” Quant. Imaging Med. Surg., vol. 8, no. 2, pp. 123–134, Mar. 2018, doi: 10.21037/qims.2018.03.02.
Figures
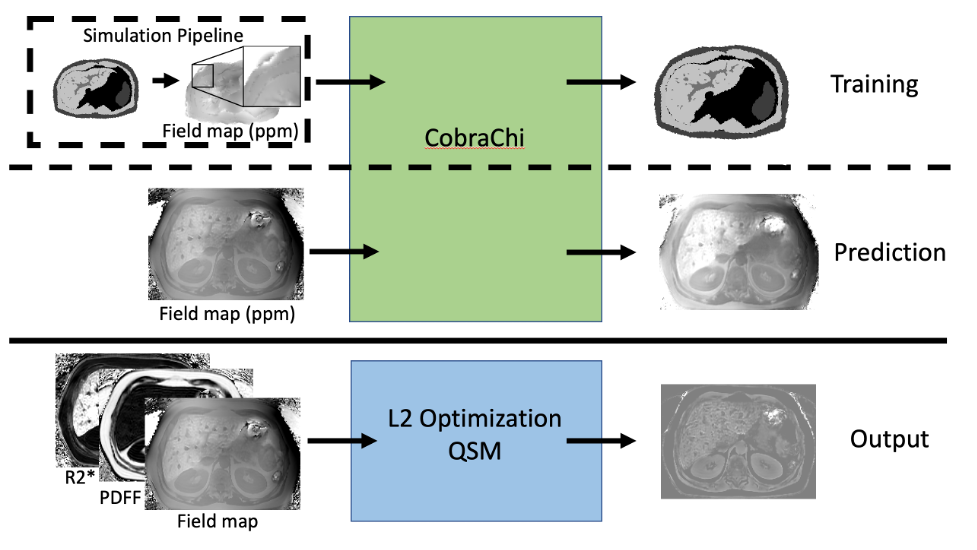
Figure 1: CobraChi workflow, and L2 optimization-based QSM workflow. Training data are simulated from a 3D digital liver phantom, which is then convolved with a dipole kernel to produce a B0 map, from which 64x64x64 volumes are extracted. The input for prediction is the measured B0 map, converted to ppm. Note that no background field removal is performed on the training data or prediction input. L2 optimization-based QSM uses the B0 map, proton density fat fraction (PDFF), and R2* maps as input.
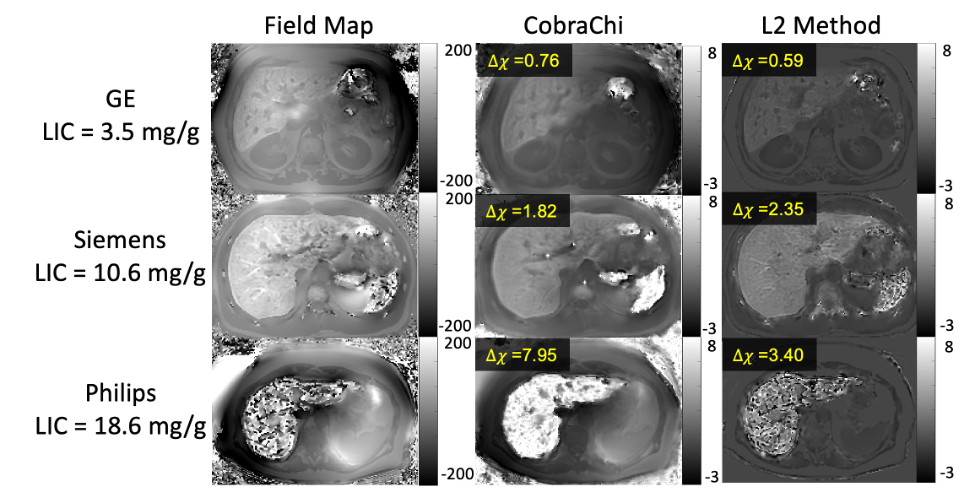
Figure 2: Example images from different vendors. The field map was used as input into CobraChi, while B0, PDFF, and R2* were used as inputs into the L2 method. Field map shown from -200 to 200 Hz, Susceptibility maps shown from -3 to 8 ppm. Both methods are feasible across all centers and vendors, however CobraChi has a wider dynamic range in the presence of high LIC (example Philips image), although CobraChi susceptibility maps exhibited residual shading that is largely avoided with the L2 method.

Figure 3: Multi-site regression analysis between CobraChi and reference LIC-based susceptibility values. High correlation between CobraChi QSM and reference susceptibility measurements was observed across centers and vendors over a broad range of liver iron levels.
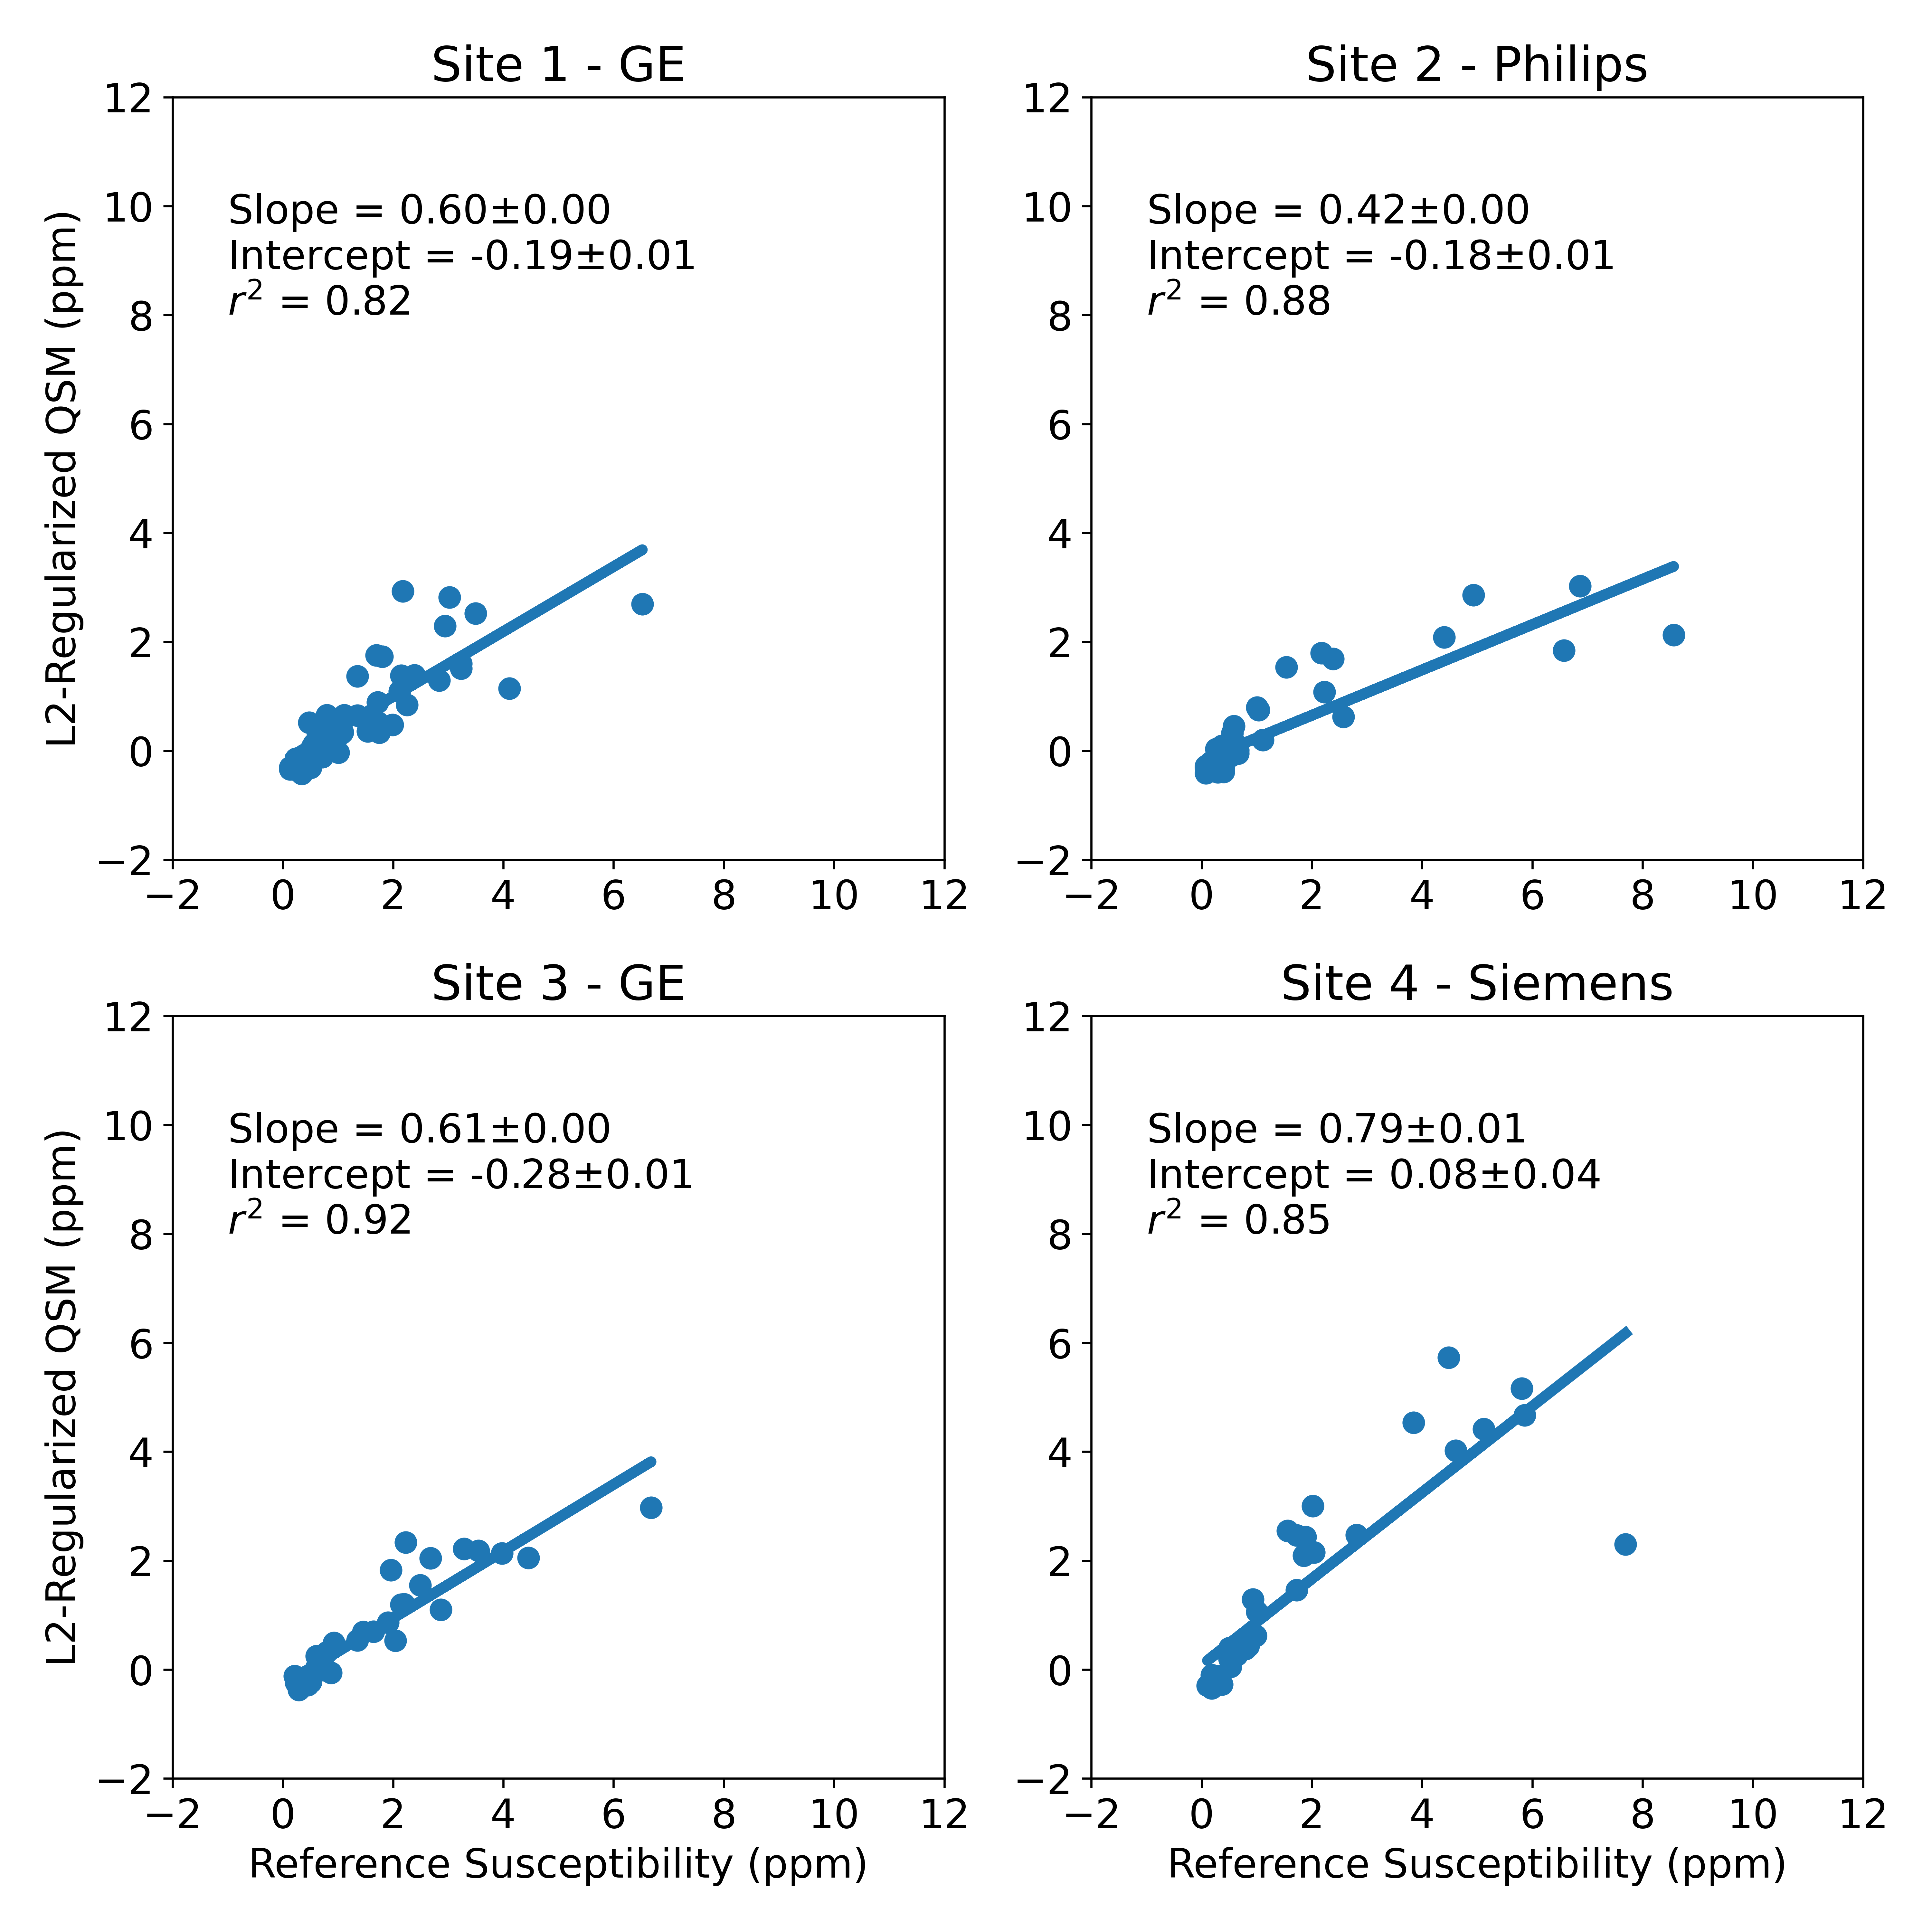
Figure 4: Multi-site regression analysis between L2-based QSM method and reference LIC-based susceptibility values. High correlation between L2-based QSM and reference susceptibility measurements was observed across centers and vendors over a broad range of liver iron levels. However, a slope of approximately 0.6 was observed, consistent with previous L2-based methods.
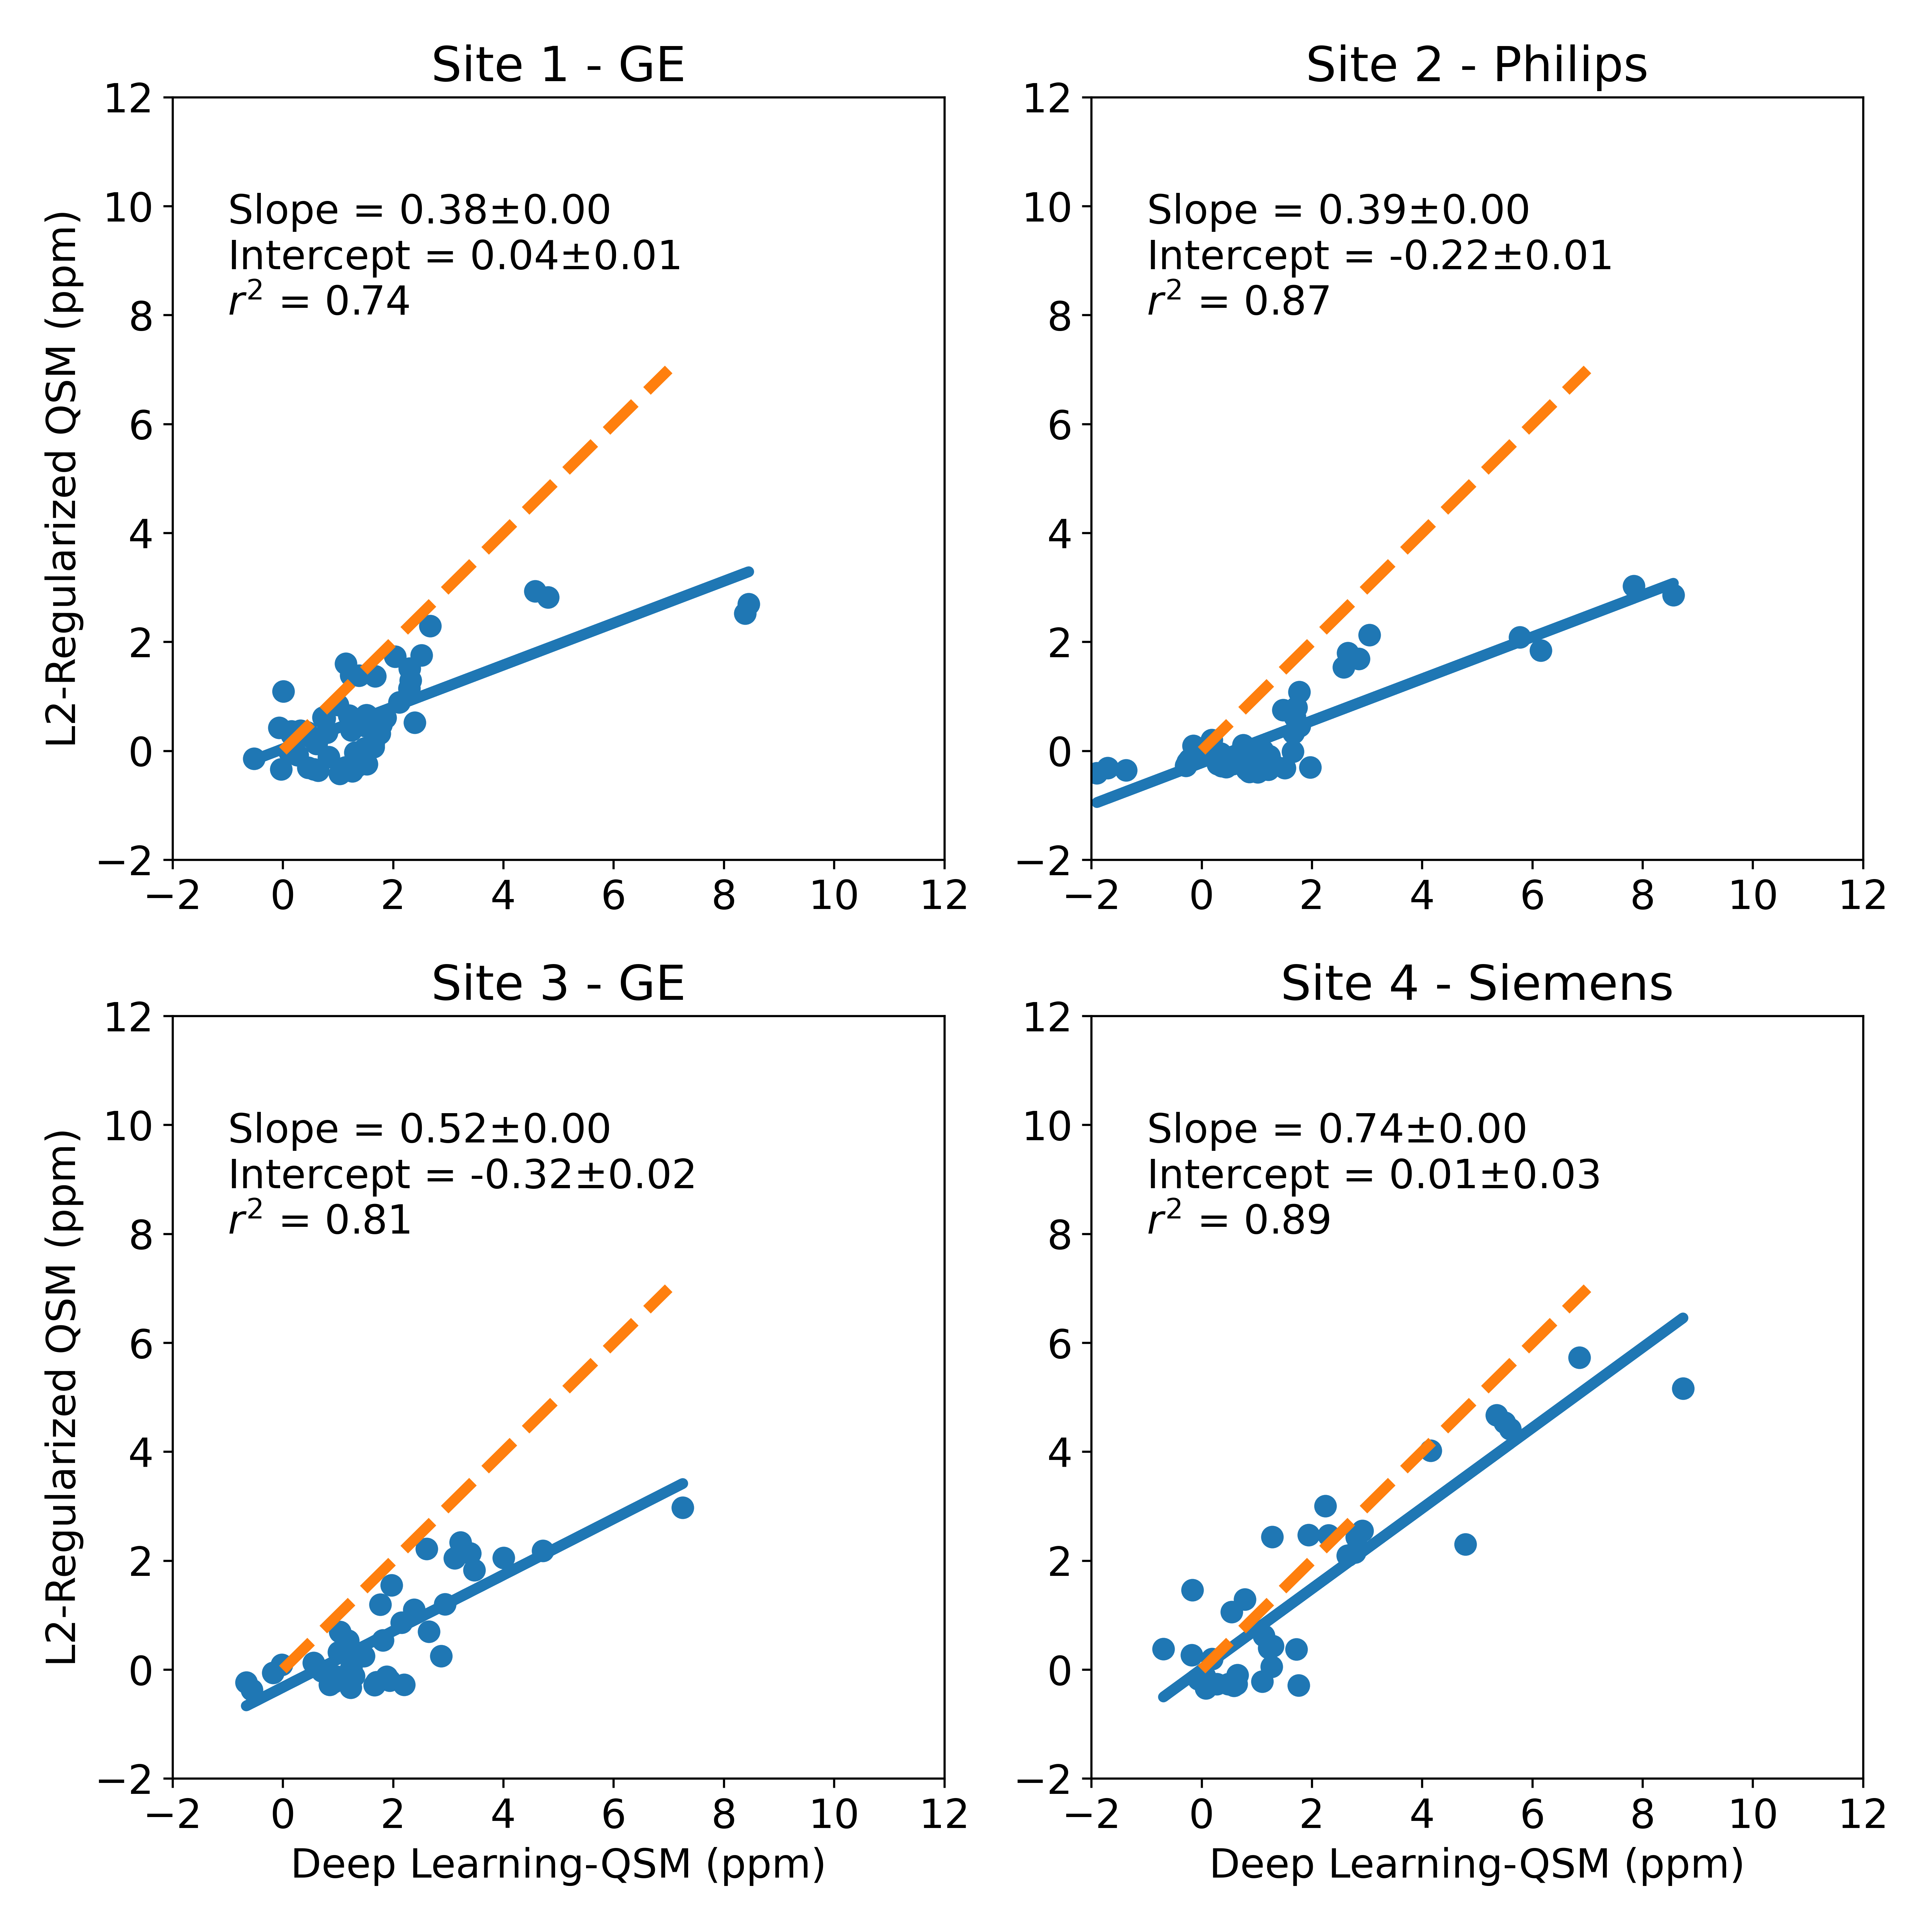
Figure 5: Multi-site regression analysis between L2-based QSM method and CobraChi susceptibility values. Dashed orange line is a line of slope 1, indicating perfect agreement between methods. High correlation between both QSM methods was observed, but the L2 method significantly underestimated susceptibility compared to the DL-based (CobraChi) method.
DOI: https://doi.org/10.58530/2022/2785