2783
A Software Tool for Inline Post-processing and Visualization of Chemical Exchange Saturation Transfer (PV-CEST) on 3T Scanner1Center for Biomedical Imaging Research, Department of Biomedical Engineering, Tsinghua University, Beijing, China, 2Philips Healthcare, Beijing, China, 3Institute of Science and Technology for Brain-Inspired Intelligence, Fudan University, Shanghai, China, 4MR Clinical Science, Philips Healthcare, Suzhou, China
Synopsis
We developed a real-time software for CEST post-processing and visualization on Philips 3T scanner, termed as PV-CEST. PV-CEST runs in the vendor provided PRIDE 2.0 environment, providing image view, Z-spectra analysis and quantitative maps calculation functionalities during scanning procedure, which could have great clinical utility.
Introduction
Chemical Exchange Saturation Transfer MRI is emerging as a promising ‘label-free’ molecular imaging tool available in clinical applications, providing quantitative information about low-concentration solutes indirectly by measuring changes in water signal during exchange process. However, CEST data is not intuitive and its interpretation relies on dedicated post-processing and quantification[1-2]. Currently, only simple post-processing like the calculation of MTRasym is available in some vendors system, which may not suffice for more dedicated research needs. Here we introduce a software, PV-CEST, for online postprocessing and quantification for CEST imaging, which could have significant clinical utility.Methods
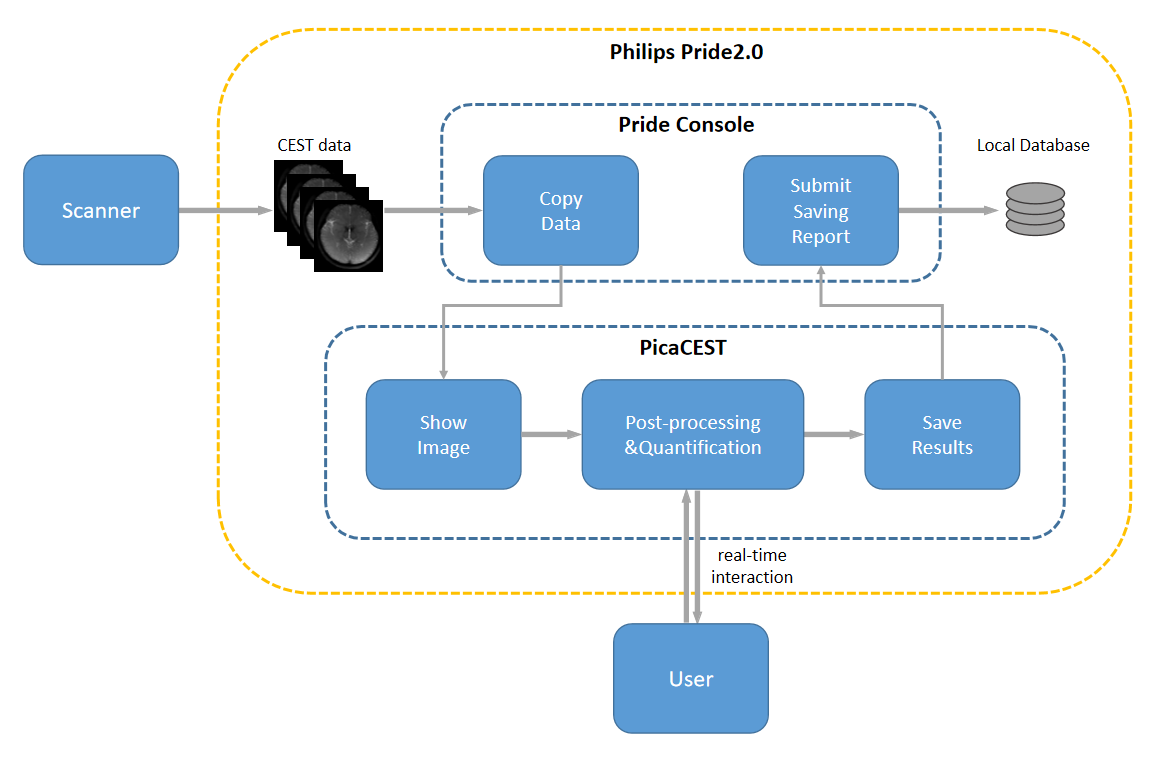
Figure 1 shows the basic architecture of PV-CEST. The software is developed in Python 3.7 and runs in the PRIDE 2.0 environment on Philips MR scanner console. When the user triggered the PRIDE and select PV-CEST, the PRIDE engine copies CEST data from the scanner’s database to a local processing node and launches the software interface. Users can view CEST images and the corresponding Z-spectra, calculate quantitative maps, and compare them online. After post-processing and quantification procedure, PV-CEST will push all the results back to PRIDE environment and save them to the scanner’s database.Workflow
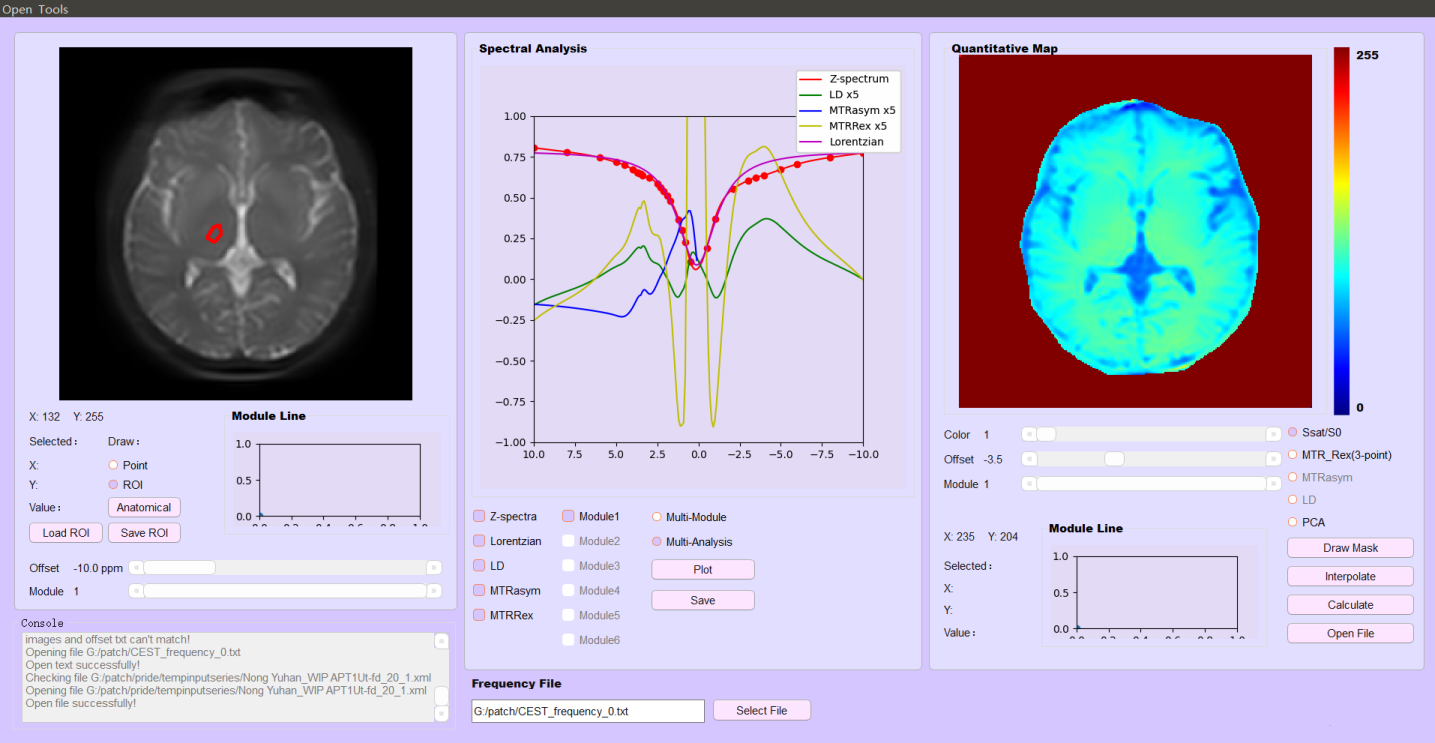
The interface of PV-CEST is shown in Figure 2. The UI is divided in three parts.Image View
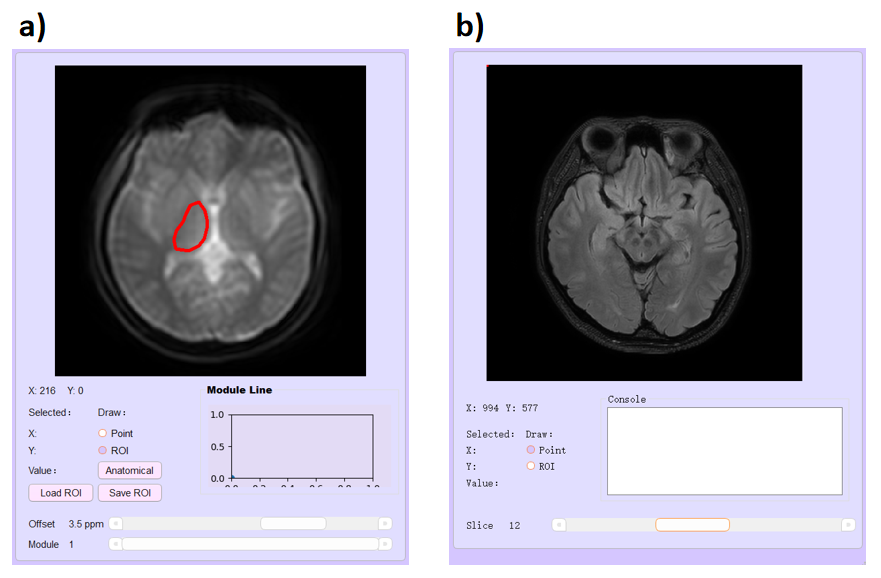
For CEST images, usually, there are some extra dimensions including saturation offsets or modules for MeLOVARS[3]. It is unfriendly for user to view the data from interleaved slices, modules and saturation offsets intuitively. PV-CEST provides a window, in which the CEST data will be split automatically, allowing the user to view images on different dimensions(Figure 3).In addition, PV-CEST supports opening and viewing a structure data as a anatomical reference.
Spectra Analysis
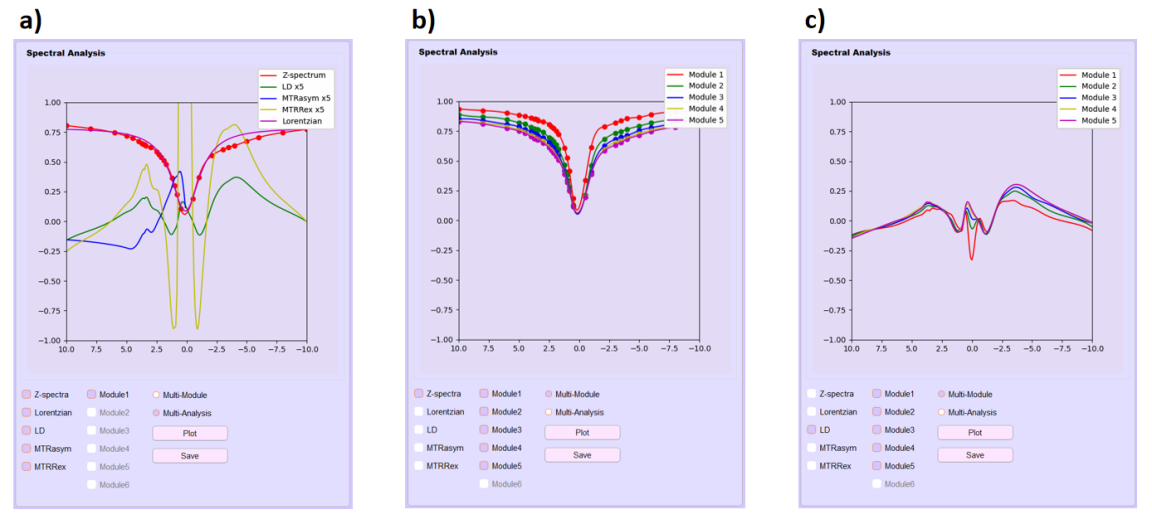
After opening a CEST image, the user can select a point or draw a ROI interactively. PV-CEST will extract the Z spectrum information of the selected point or ROI from the image series and push it to spectra analysis module. The user can choose one or more analysis modes, including raw Z-spectrum, Lorentian fitting line, MTR asymmetry, Lorentzian difference and MTR Rex. The ROI location and corresponding Z-spectra information can be saved or loaded respectively. In addition, for a MeLOVARS sequence, the user can compare Z-spectra information from different modules(Figure 4b c).
Quantitative Map
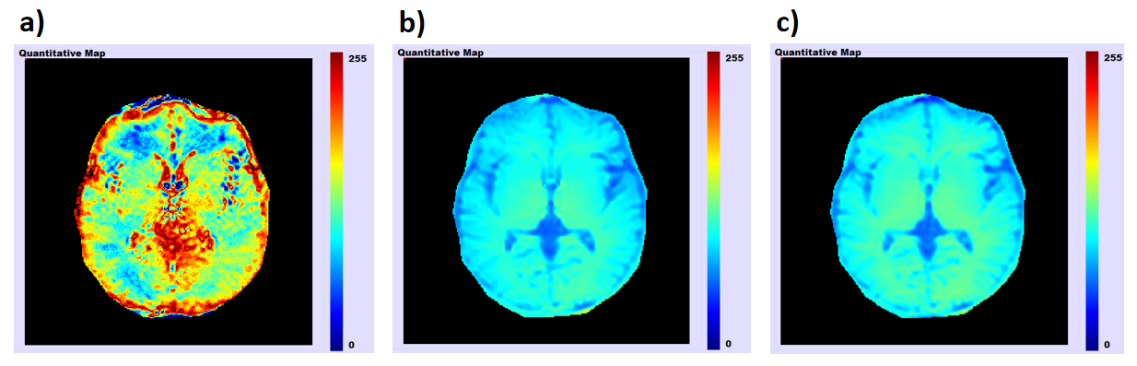
For loaded CEST data, PV-CEST can show the quantitative results, including relative saturation signal map, MTR asymmetric map, Lorentzian difference map, MTRRex map and Principal Component Analysis(PCA) of the maps above. Saturation offsets will first be interpolated to -10 to 10ppm for the follow-up calculation. After calculation, quantitative maps will be saved automatically, and can be displayed online in pseudo-color(Figure 5). All the operations can be finished in 5 seconds except for the Lorentzian difference map which is fitted point by point, which usually needs about 3 to 5 minutes.
Discussion
We developed a software, PV-CEST, for real-time post-processing and quantification of CEST, which can give doctors an intuitive result instantly. PV-CEST is simple for installation, allowing user to process CEST data online or offline, as it is developed as an execute program. Note that, in the current implementation, the calculation of Lorentzian difference map is time-consuming,which can be accelerated using parallel computation.Conclusion
PV-CEST provides a platform from which CEST data can be processed inline on Philips scanner. Various Z-spectra analysis and quantification functions have been embedded in the existing scanning workflow.Acknowledgements
The authors acknowledged funding from National Natural Science Foundation of China (82071914). and the startup package from Tsinghua University to Dr. Song.References
[1] Guivel-Scharen V, Sinnwell T, Wolff SD, Balaban RS. Detection of proton chemical exchange between metabolites and water in biological tissues. J Magn Reson 1998;133:36–45.
[2] Jones C, Polders D, Hua J. In vivo 3D whole-brain pulsed steady state chemical exchange saturation transfer at 7T. Magn Reson Med. 2012;67(6):1579–89.
[3] X. Song, J. Xu, S. Xia, N.N. Yadav, B. Lal, J. Laterra, J.W. Bulte, P.C. van Zijl, M.T.McMahon Multi-echo length and offset VARied saturation (MeLOVARS) method for improved CEST imaging. Magn. Reson. Med., 73 (2015), pp. 488-496
Figures