2782
Study of potential immediate effects of neuronal activity on the MRI signal in humans1Advanced MRI section, LFMI, National Institute of Neurological Disorders and Stroke, National Institutes of Health, Bethesda, MD, United States
Synopsis
A recent study has shown rapid MRI signals in response to whisker pad stimulation in mice that track electrical activity. We used rapid, high SNR imaging at 7 T to look for a possible direct effect of visual stimulation on MRI signal in human visual cortex. Two rapid stimulation protocols and variation of T1-weighting failed to generate observable signal changes above the 0.01% detection threshold, well below the previously reported effect size of 0.15%. This confirms the well-established difficulty in developing more direct measures of neuronal activity than available with BOLD-fMRI.
Introduction
Despite its exquisite sensitivity and widespread use, BOLD fMRI is limited by hemodynamic response induced temporal and spatial blurring of the underlying neuronal activity. Numerous studies have explored MRI techniques that more directly detect neuronal events, possibly through field changes associated with dendritic currents [1], or diffusion effects [2]. Recently, a novel method, 'direct imaging of neuronal activity' (DIANA) was proposed and demonstrated with whisker-pad stimulation in mice [3]. In both thalamus and whisker-barrel cortex, 10-ms duration electrical stimuli elicited rapid signal changes whose time-courses roughly tracked that of neuronal spiking rate. The contrast mechanism was speculated to involve T1 and/or T2 changes with neuronal activation. To explore feasibility in humans, we performed experiments using visual stimuli at 7 T, using rapid, high-SNR imaging.Methods
The following MRI experiments were performed on a Siemens Magnetom 7T+ with 32-channel receive array:#1: Functional localizer using 5-min block paradigm, with alternatingly 30-s duration, 7.5 Hz contrast reversing checkerboard stimulation ('on') and 30-s duration uniform grey ('off') (gradient-echo EPI, 35 slices, 2 mm resolution, 17.5 ms TE, 3 s TR, 90-degree flip angle).
#2: Single slice rapid scan, 9200 repetitions (5.5-min duration), using 267-ms 'checkerboard on', 267-ms 'checkerboard off' (uniform grey) paradigm, multiplied with a 32-s 'on', 32-s 'off' block function, allowing simultaneous detection of direct/rapid and delayed/slow (BOLD) response. (During the 32-s 'off' blocks, only the uniform grey is presented.)
#3: Single slice rapid scan, 8400 repetitions (5-min duration) using a block stimulation paradigm (as #1).
#4: Single slice rapid scan, 8400 repetitions (5-min duration) using a single trial stimulation paradigm (33-ms checkerboard 'on'; 467-ms uniform grey 'off', repeated 600 times).
All rapid scans were performed with single-slice, single shot gradient-echo EPI with isotropic 3.5-mm resolution (64x48 matrix; 224x168 mm2 FOV), using 10o or 5 o flip angle, 35.9 ms TR, and 17.5 ms TE. The TR was chosen to perform MRI asynchronously with stimulation, as this would avoid a dependency of detection sensitivity on the uncertain timing of the direct effect. Three subjects participated in experiments #1-#3, and an additional five in #1,#3,#4. On four of the subjects in experiment #4, scans were also performed with a flip angle of 5o to investigate the potential role of T1 in the contrast mechanism.
Results
After image registration, linear regression was performed for activation (BOLD regressor for experiment #1 and #3; BOLD and 1 direct effect regressor for experiment #2; 3 direct effect regressors for experiment #4), accounting for physiology (4 RETROICOR regressors) and 2 polynomial drift terms. Time-to-peak and width of the direct response were ~36 ms; When 3 regressors were used, lags were an additional [0,1,2] TR (yielding ~[36,72,108] ms post-stimulus onset latency) to account for possible ~50-ms delay between stimulus onset and neuronal response [4]. Significance thresholds were determined from frequency-domain phase-scrambling of data to yield no more than 1 false-positive voxel. Experiment #2 or #3 BOLD was used to generate a mask of the activated area (32-119, or 82±11, voxels, referred to as BOLD-activated visual cortex, "VC"). Experiment #4 data from which trends & physiology were removed (using aforementioned regression) were high-pass filtered (1.35 Hz cutoff; 0.135 edge width), after which volumes 300-8299 were selected. The selected data were rebinned based on MR volume latency relative to preceding stimulus onset, either at 35.9 (MR TR) or 10 ms bin duration, then averaged in VC and over volunteers.Discussion
Noise and stability analysis showed that in VC, single pixel SNR averaged around 172±17, while temporal SNR (TSNR) was 160±10. In VC-averaged data, TSNR was 552±58. For 5o flip angle data, these values were 122±25, 120±9 and 652±89, respectively.The functional localizer (experiment #1) showed significant BOLD activation in all 8 subjects and was used to select a slice for the rapid scans (experiments #2-#4). BOLD activation was also significant in the 3 subjects with mixed design (experiment #2), while the direct effect was insignificant (Figure 1). Spectral analysis showed absence of a significant peak at the rapid (1.875 Hz in experiment #2) stimulation frequency, in the presence of a major (BOLD) peak at the frequency of the slow block paradigm (0.016 Hz) (Figure 2). Similarly, experiment #3 led to a robust BOLD effect, without a significant rapid effect being seen with repeated single trial stimulation (experiment #4) (Figures 3-5) at either high (10o) or low (5o) flip angle (Figures 3&5). The latter finding appears to exclude the possibility that counteracting T1 and T2* effects led to our failure to see effects.
Acknowledgements
This work was funded by the intramural program of the National Institute of Neurological Disorders and Stroke at the NIH.References
[1] Bodurka J, Bandettini PA. Toward direct mapping of neuronal activity: MRI detection of ultraweak, transient magnetic field changes. Magn Reson Med. 2002;47:1052-1058
[2] Le Bihan D, Urayama S, Aso T, Hanakawa T, Fukuyama H. Direct and fast detection of neuronal activation in the human brain with diffusion MRI. Proc Natl Acad Sci U S A. 2006;103:8263–8268
[3] Toi PT, Jang HJ, Min K, Kim SP, Lee SK, Lee J, Kwag J, Park JY. In vivo direct imaging of neuronal activity at high temporo-spatial resolution. bioRxiv. 2021;May21:444581v2
[4] Bair W, Cavanaugh JR, Smith MA, Movshon JA. The timing or response onset and offset in macaque visual neurons. J Neurosci. 2002;22:3189-3205
[5] Chu R, de Zwart JA, van Gelderen P, Fukunaga M, Kellman P, Holroyd T Duyn JH. Hunting for neuronal currents: absence of rapid MRI signal changes during visual-evoked response. Neuroimage. 2004;23:1059-1067
Figures
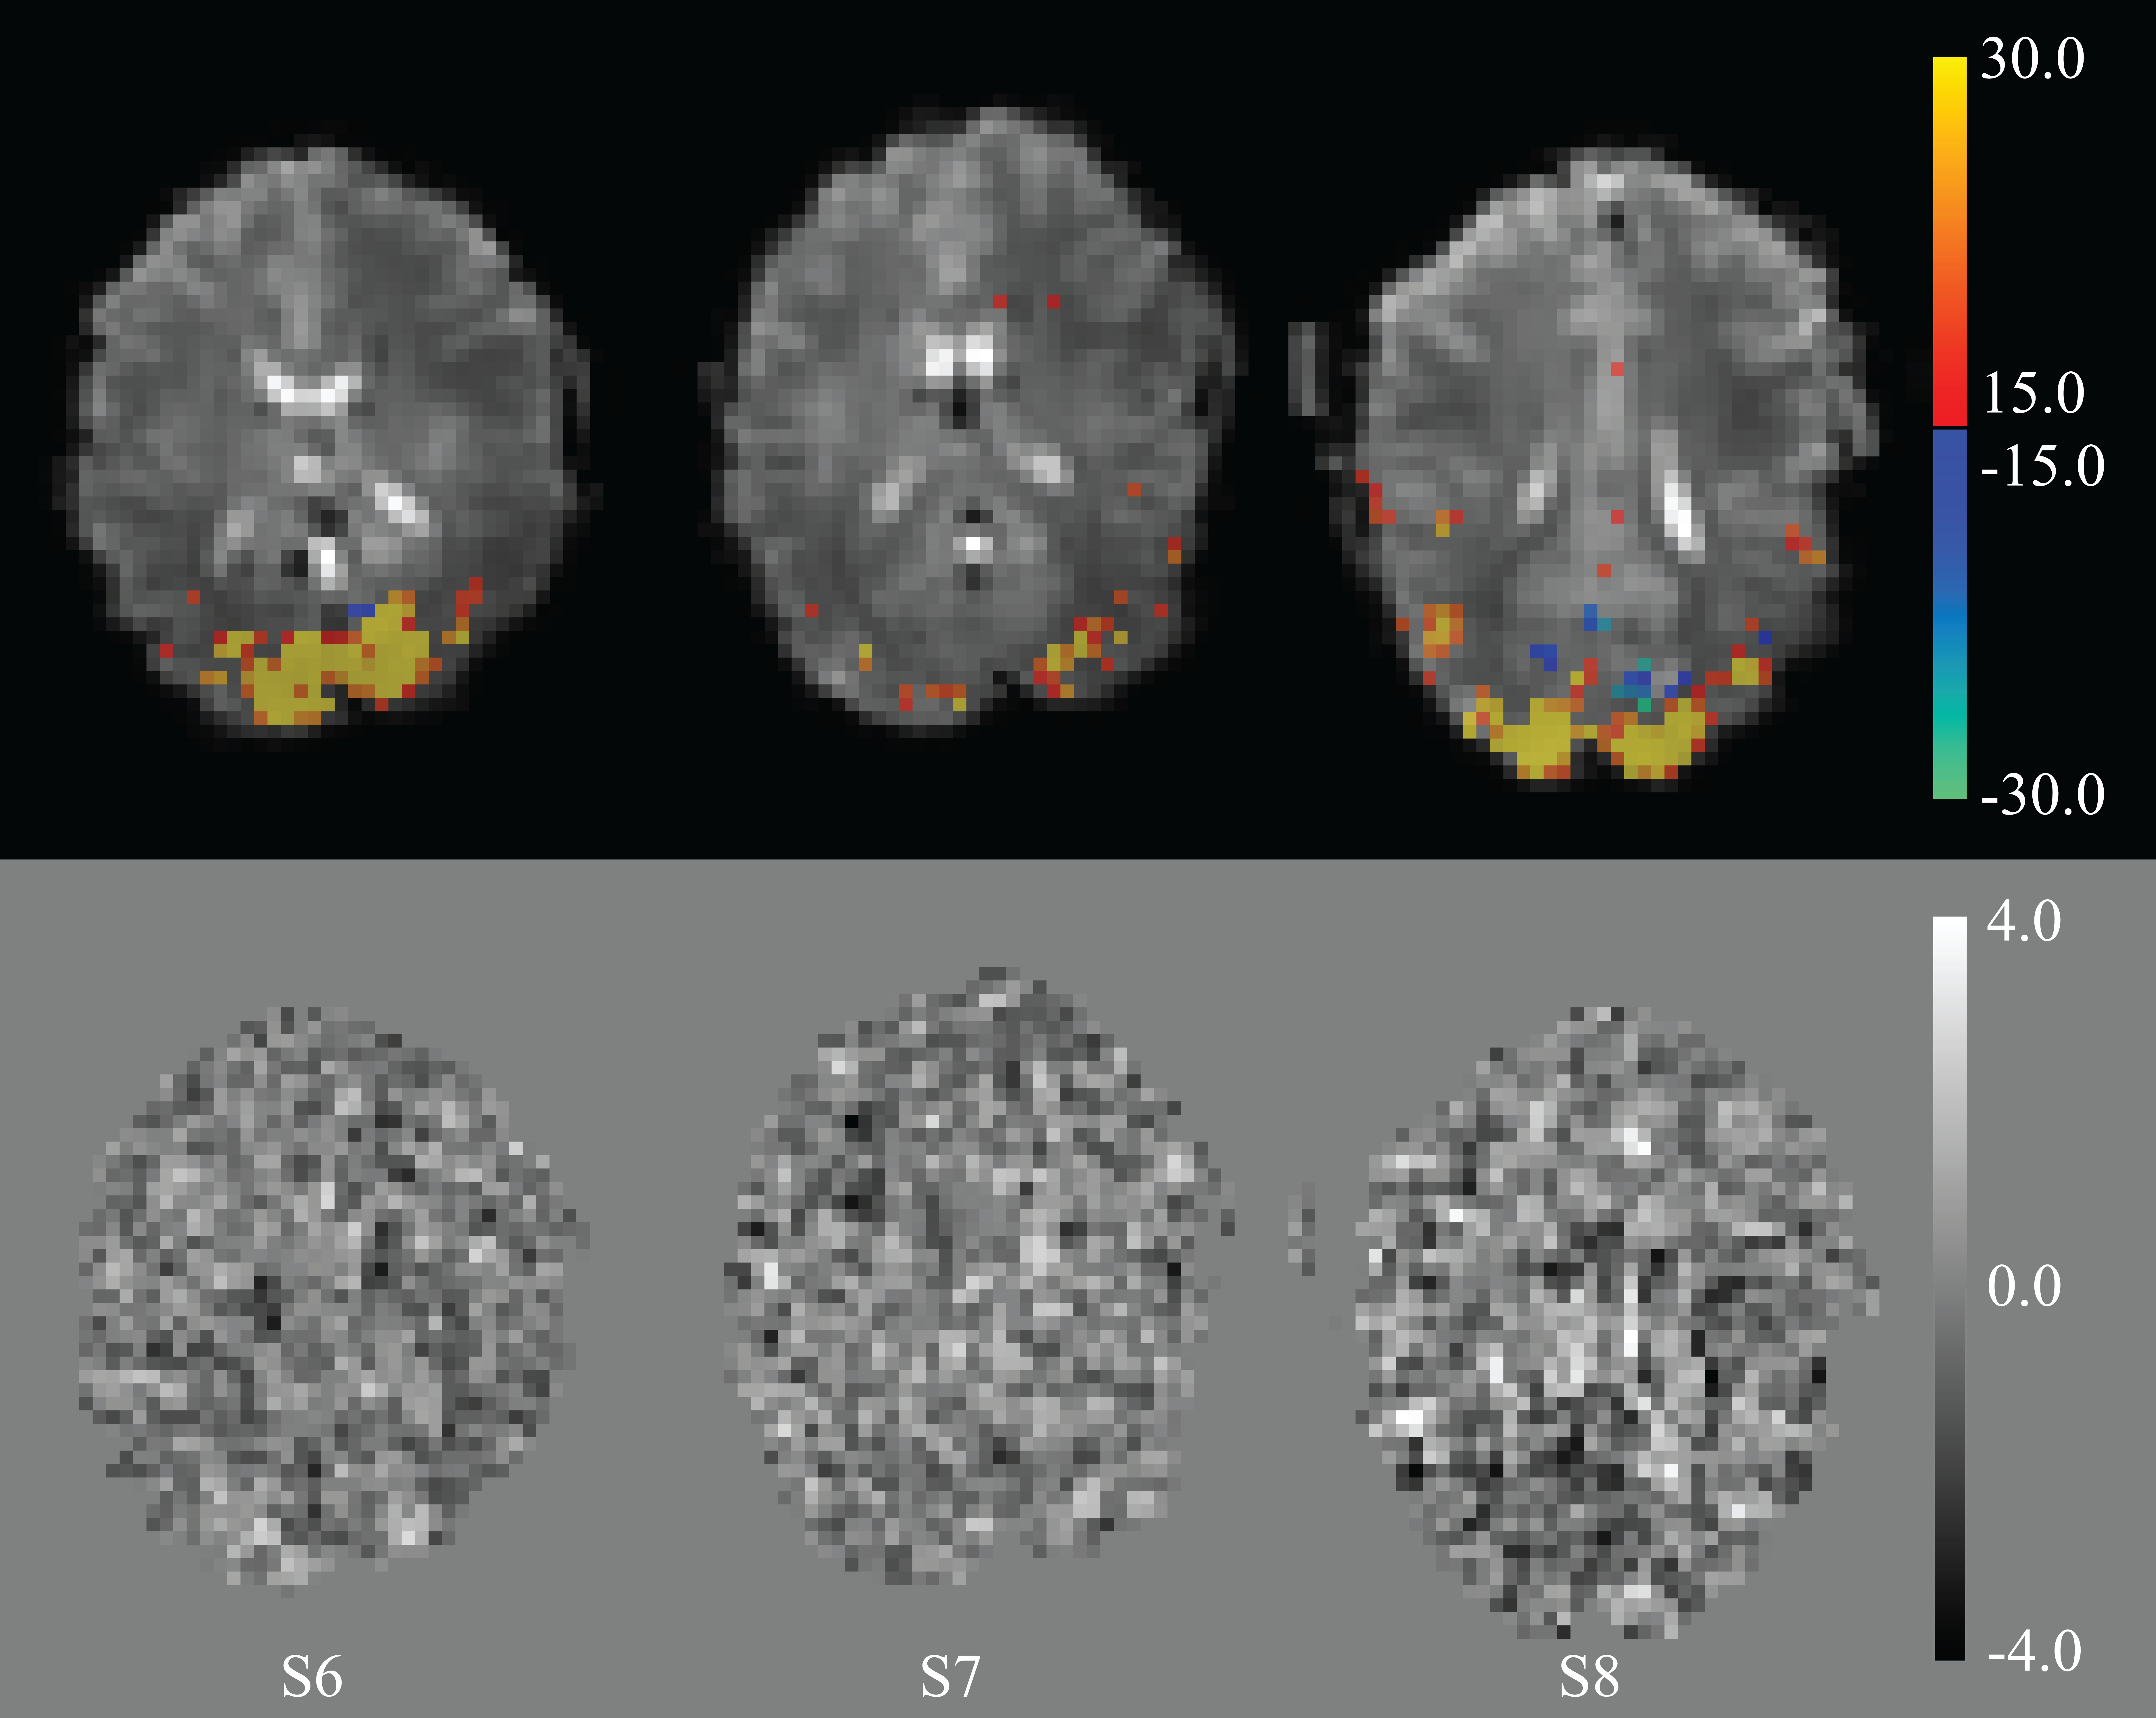
Figure 1. Results from the analysis of experiment #2 (n=3) using a BOLD and single direct effect regressor. Top row: BOLD activation maps, showing voxels above the threshold derived from scrambling of the data to give approximately one false positive voxel. The bottom row shows un-thresholded t-maps from the direct effect regressor. At this frequency, the threshold for significance was estimated at 3.9; two pixels exceeded this threshold, neither were in the visual area.
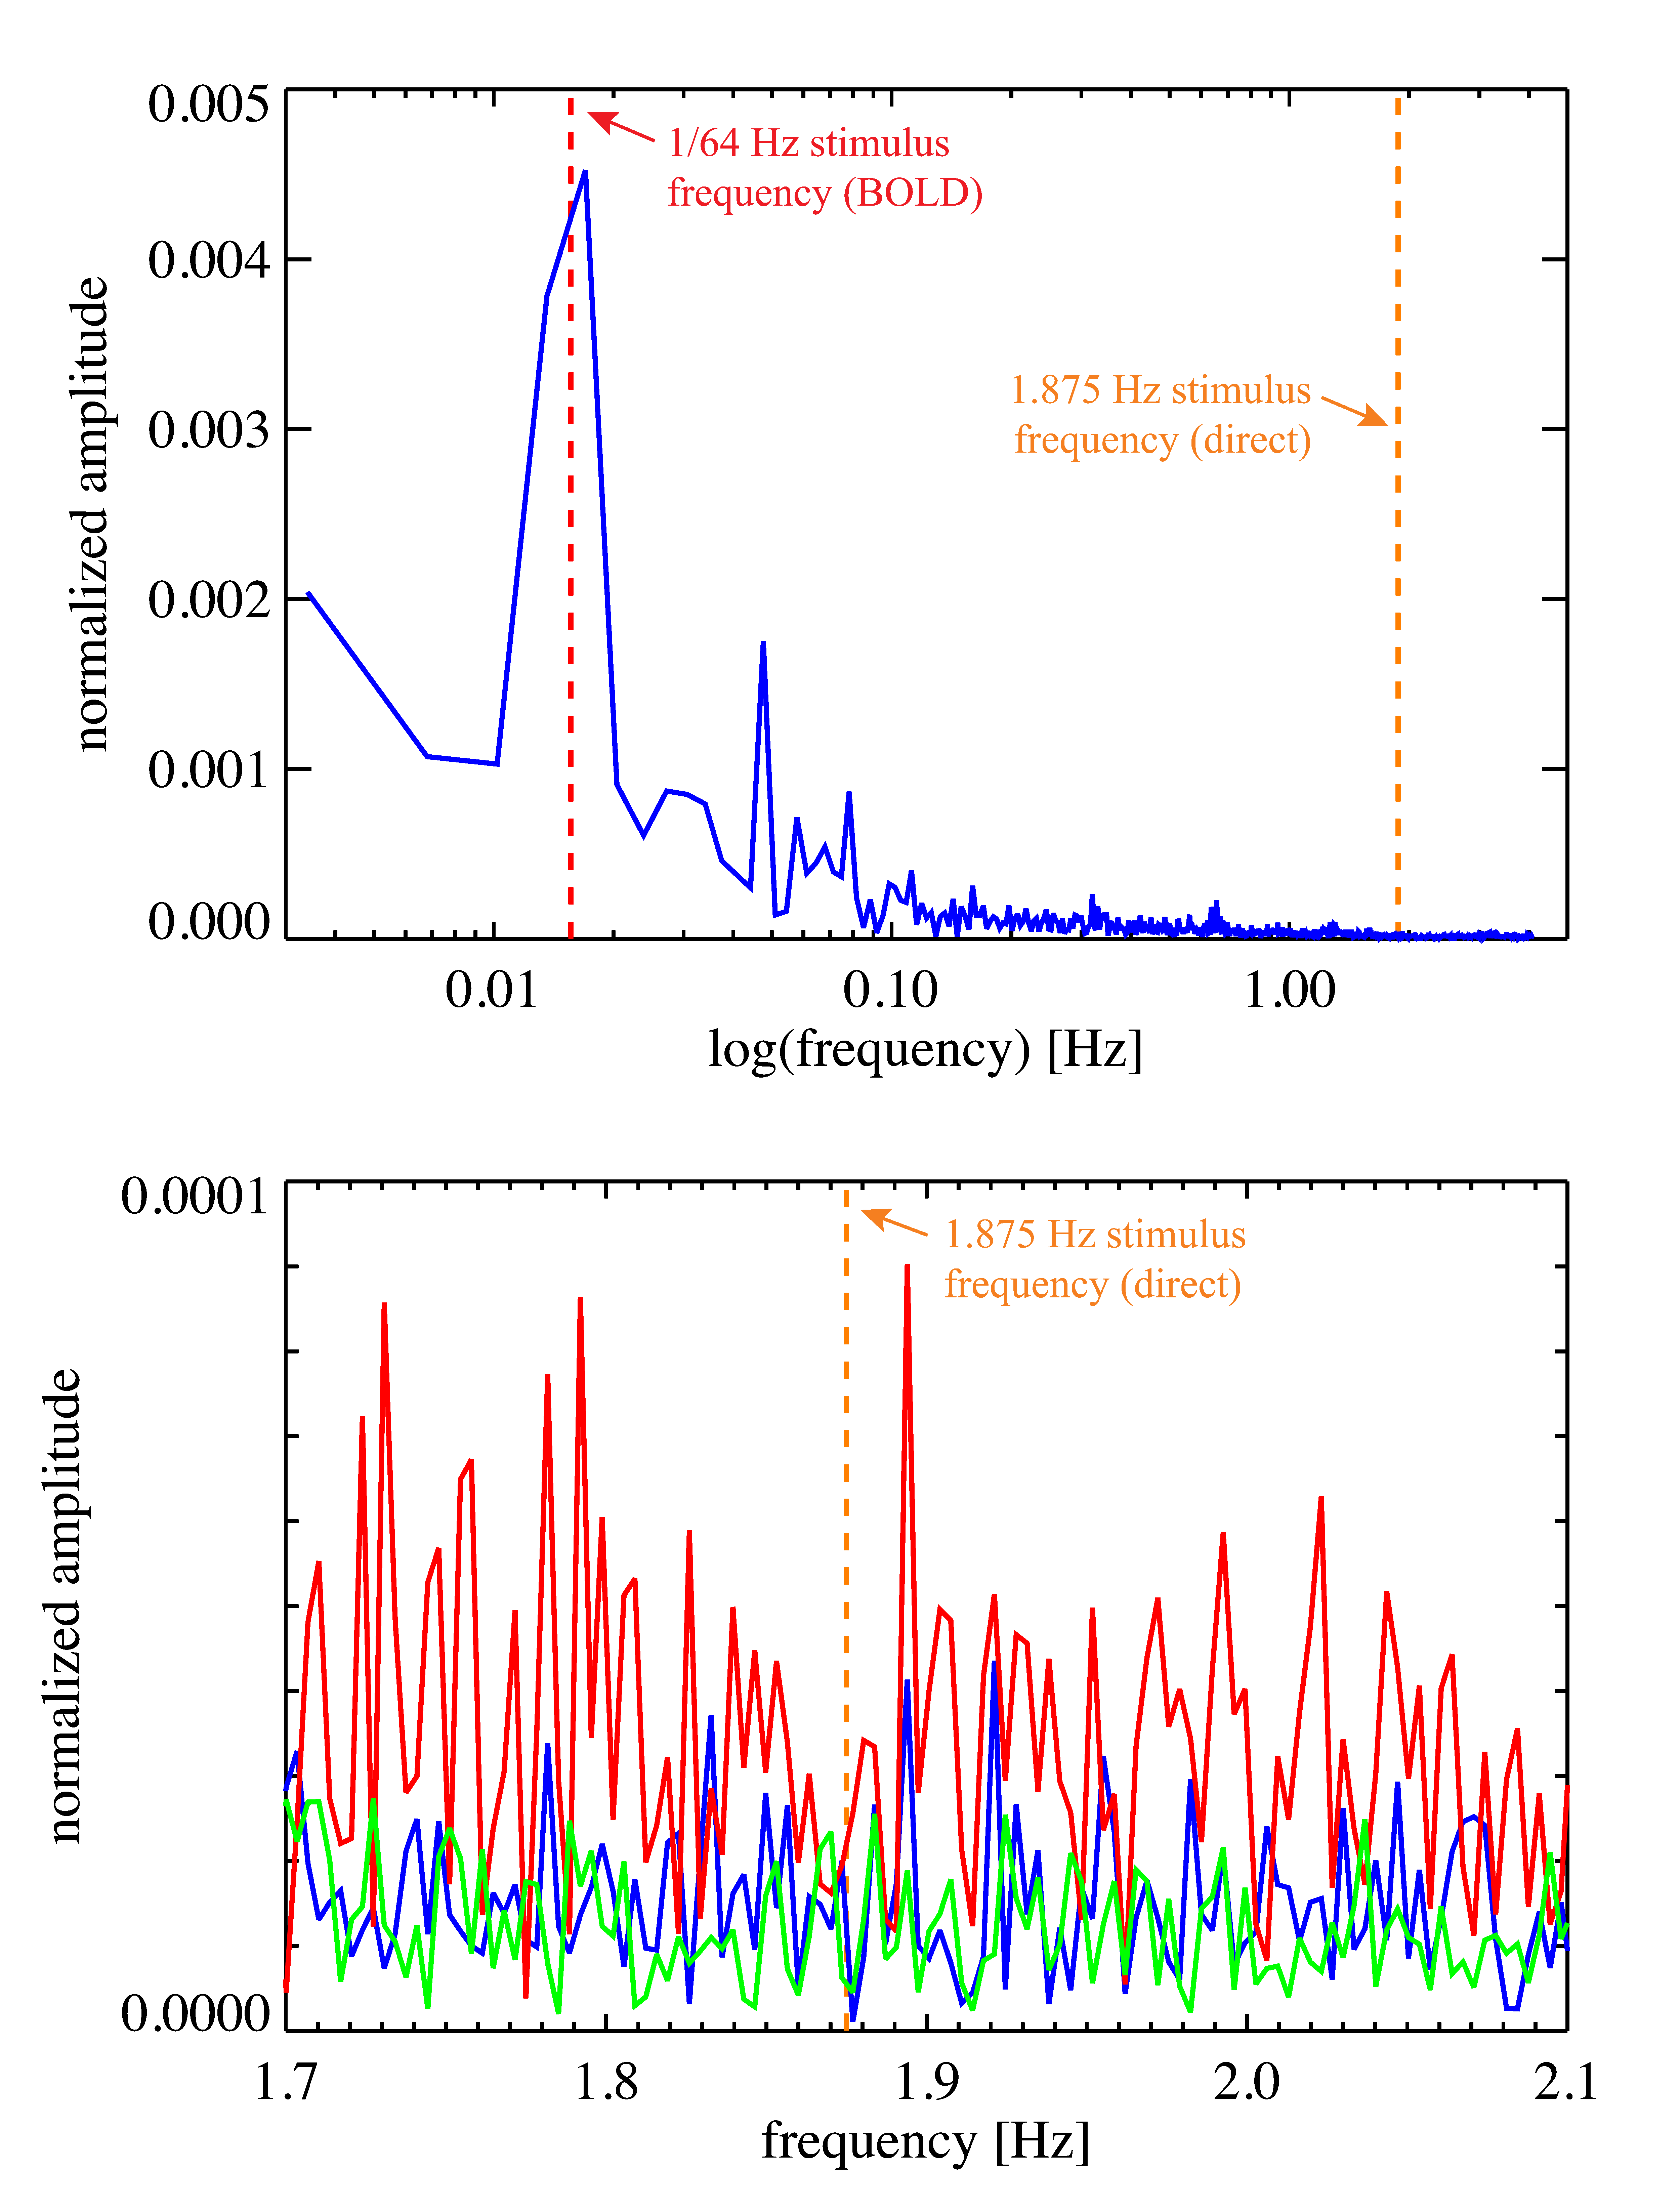
Figure 2. Magnitude spectra of the average signal in VC for the mixed stimulus experiment (experiment #2). The amplitude was normalized to baseline. The dashed red line indicates the slow (BOLD) stimulus frequency (at 1/64, or 0.0156, Hz), the orange line indicates the fast, direct effect, stimulus frequency (1.875 Hz). The top plot shows data from one subject, the bottom plot is a zoomed in version with data from all three subjects on which experiment #2 was performed.
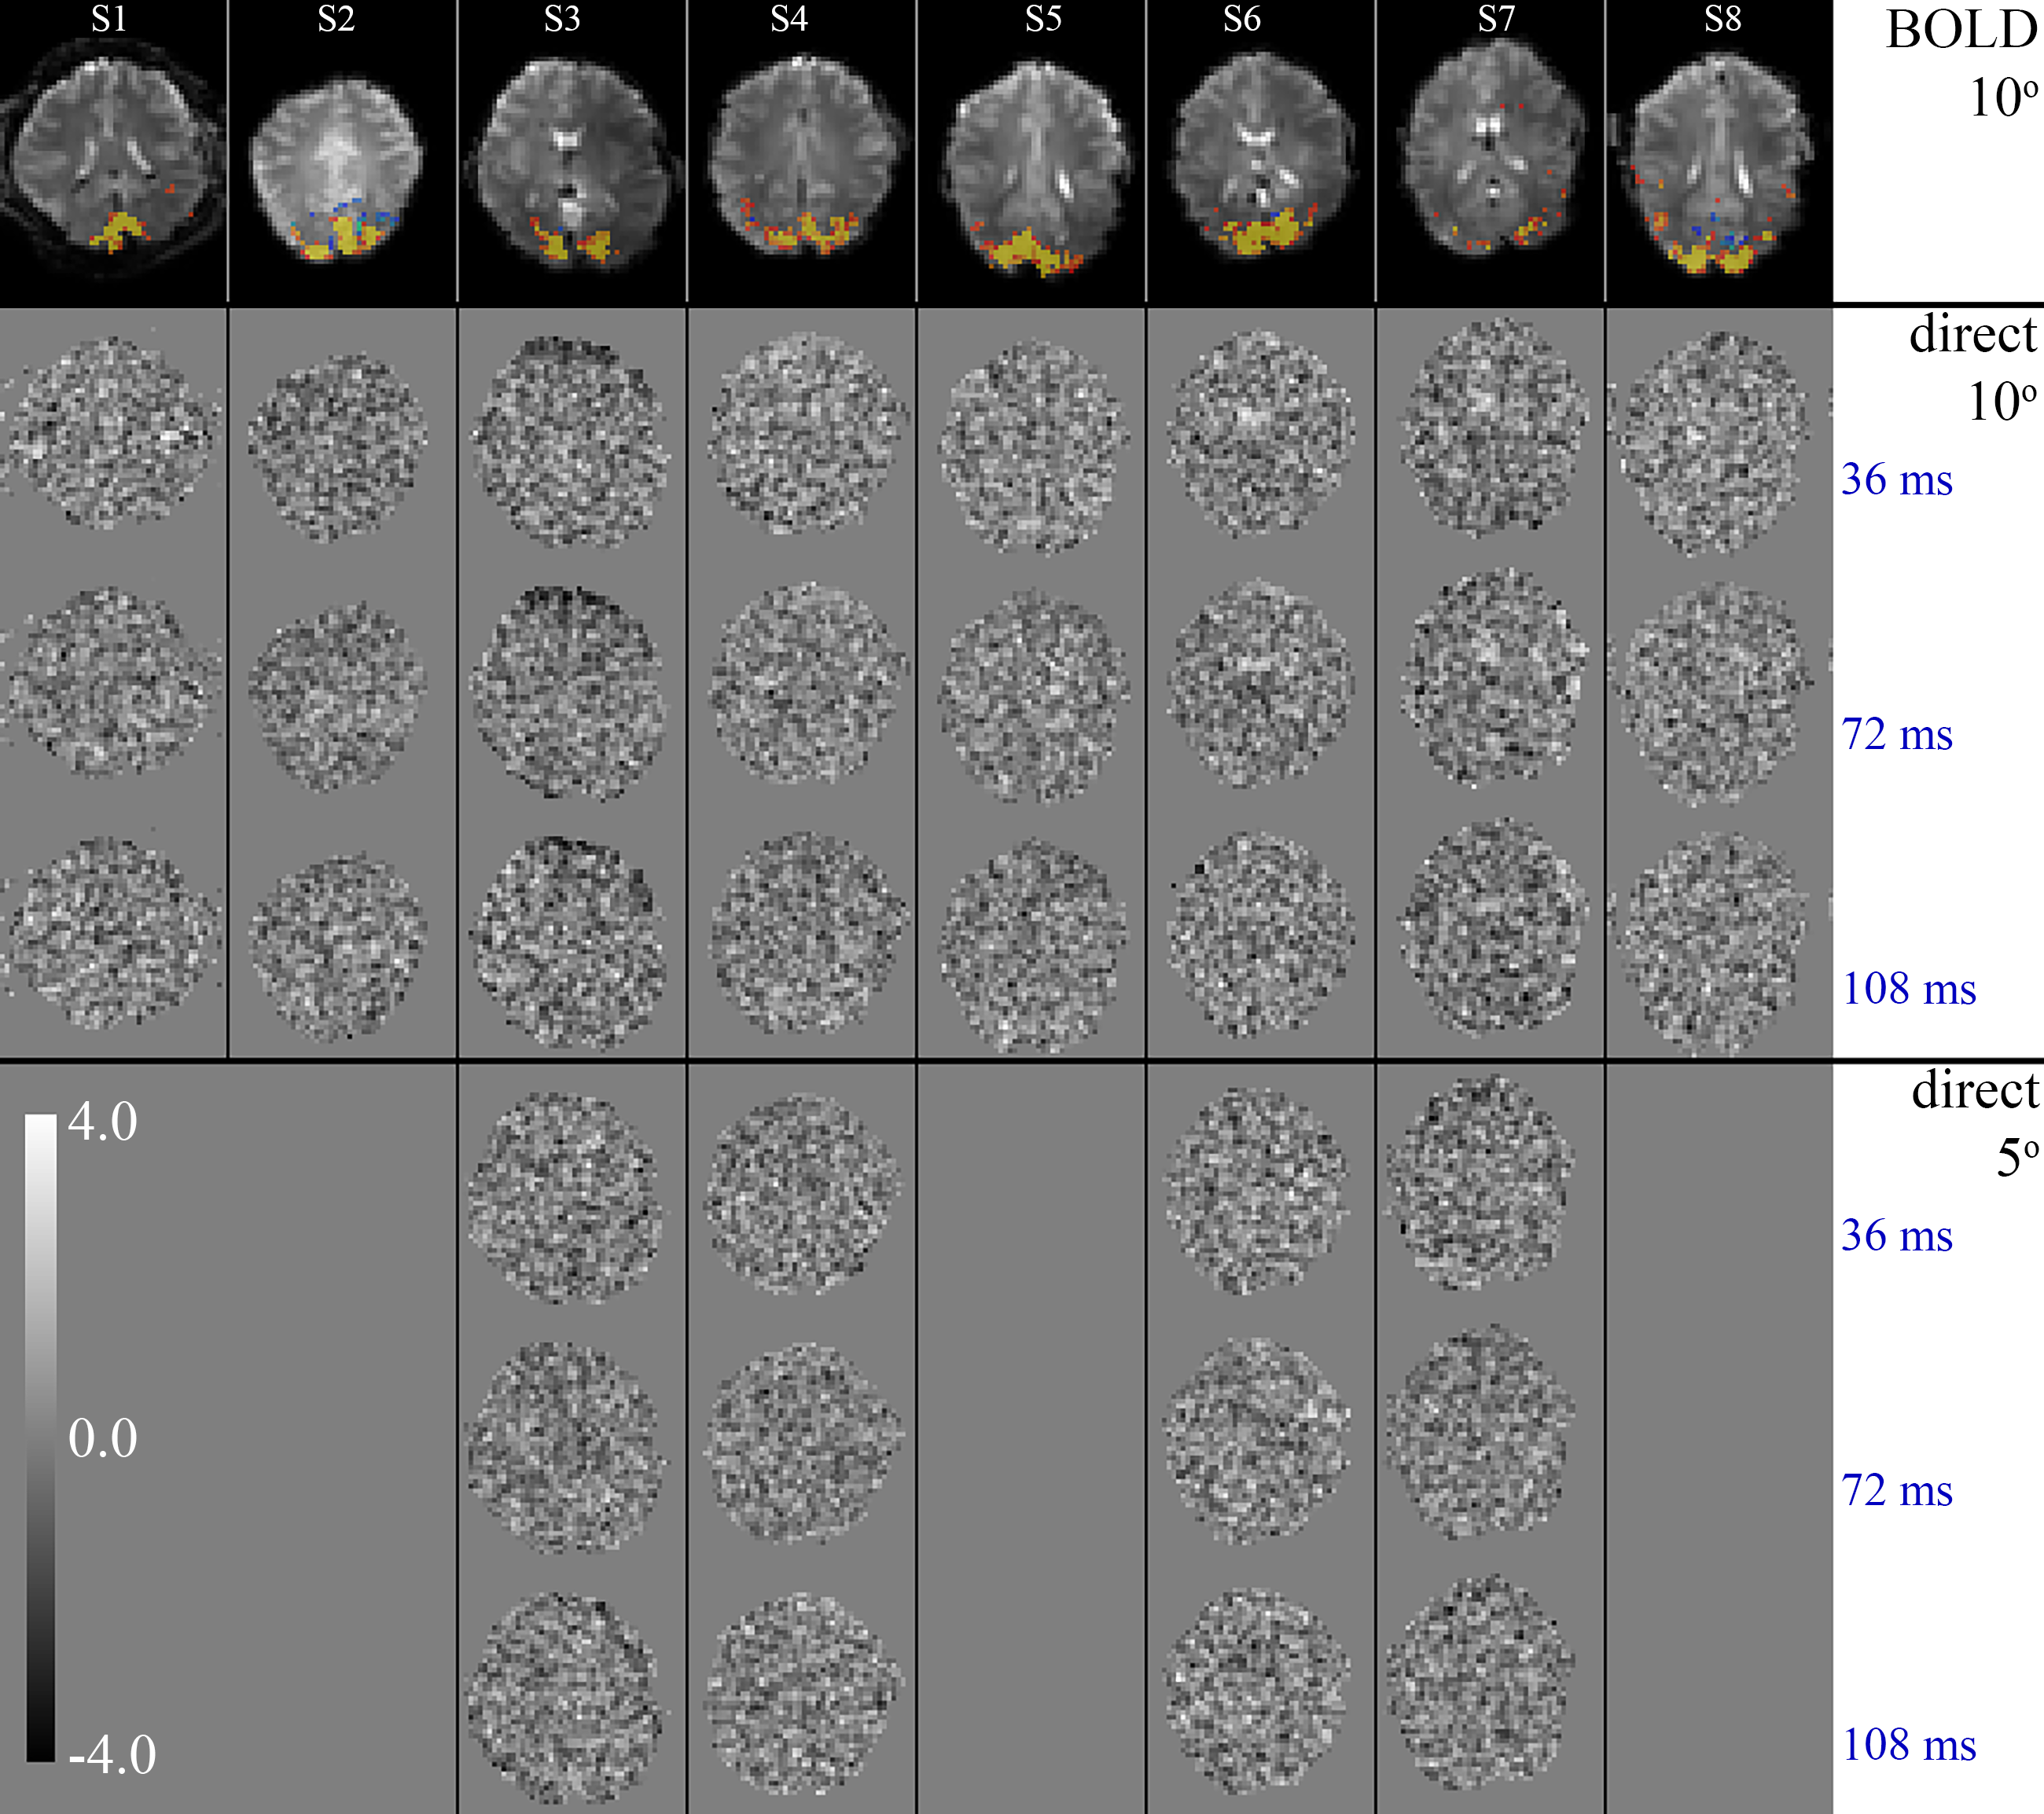
Figure 3. T-maps of the response to the fast stimulus (2.0 Hz, experiment #4), for eight subjects (columns), at 3 lags of 36, 72 and 108 ms post stimulus onset. The top row shows BOLD activation maps from either experiment #3 (subject 1-5) or experiment #2 (subject 6-8). Row 2-4 show the results for the three direct effect regressor lags using 10-degree flip angle acquisition (n=8); rows 5-7 show equivalent results from 5-degree flip angle scans (n=4). The permutation-based threshold for significance is estimated to be 4.0, which no voxels exceeded.
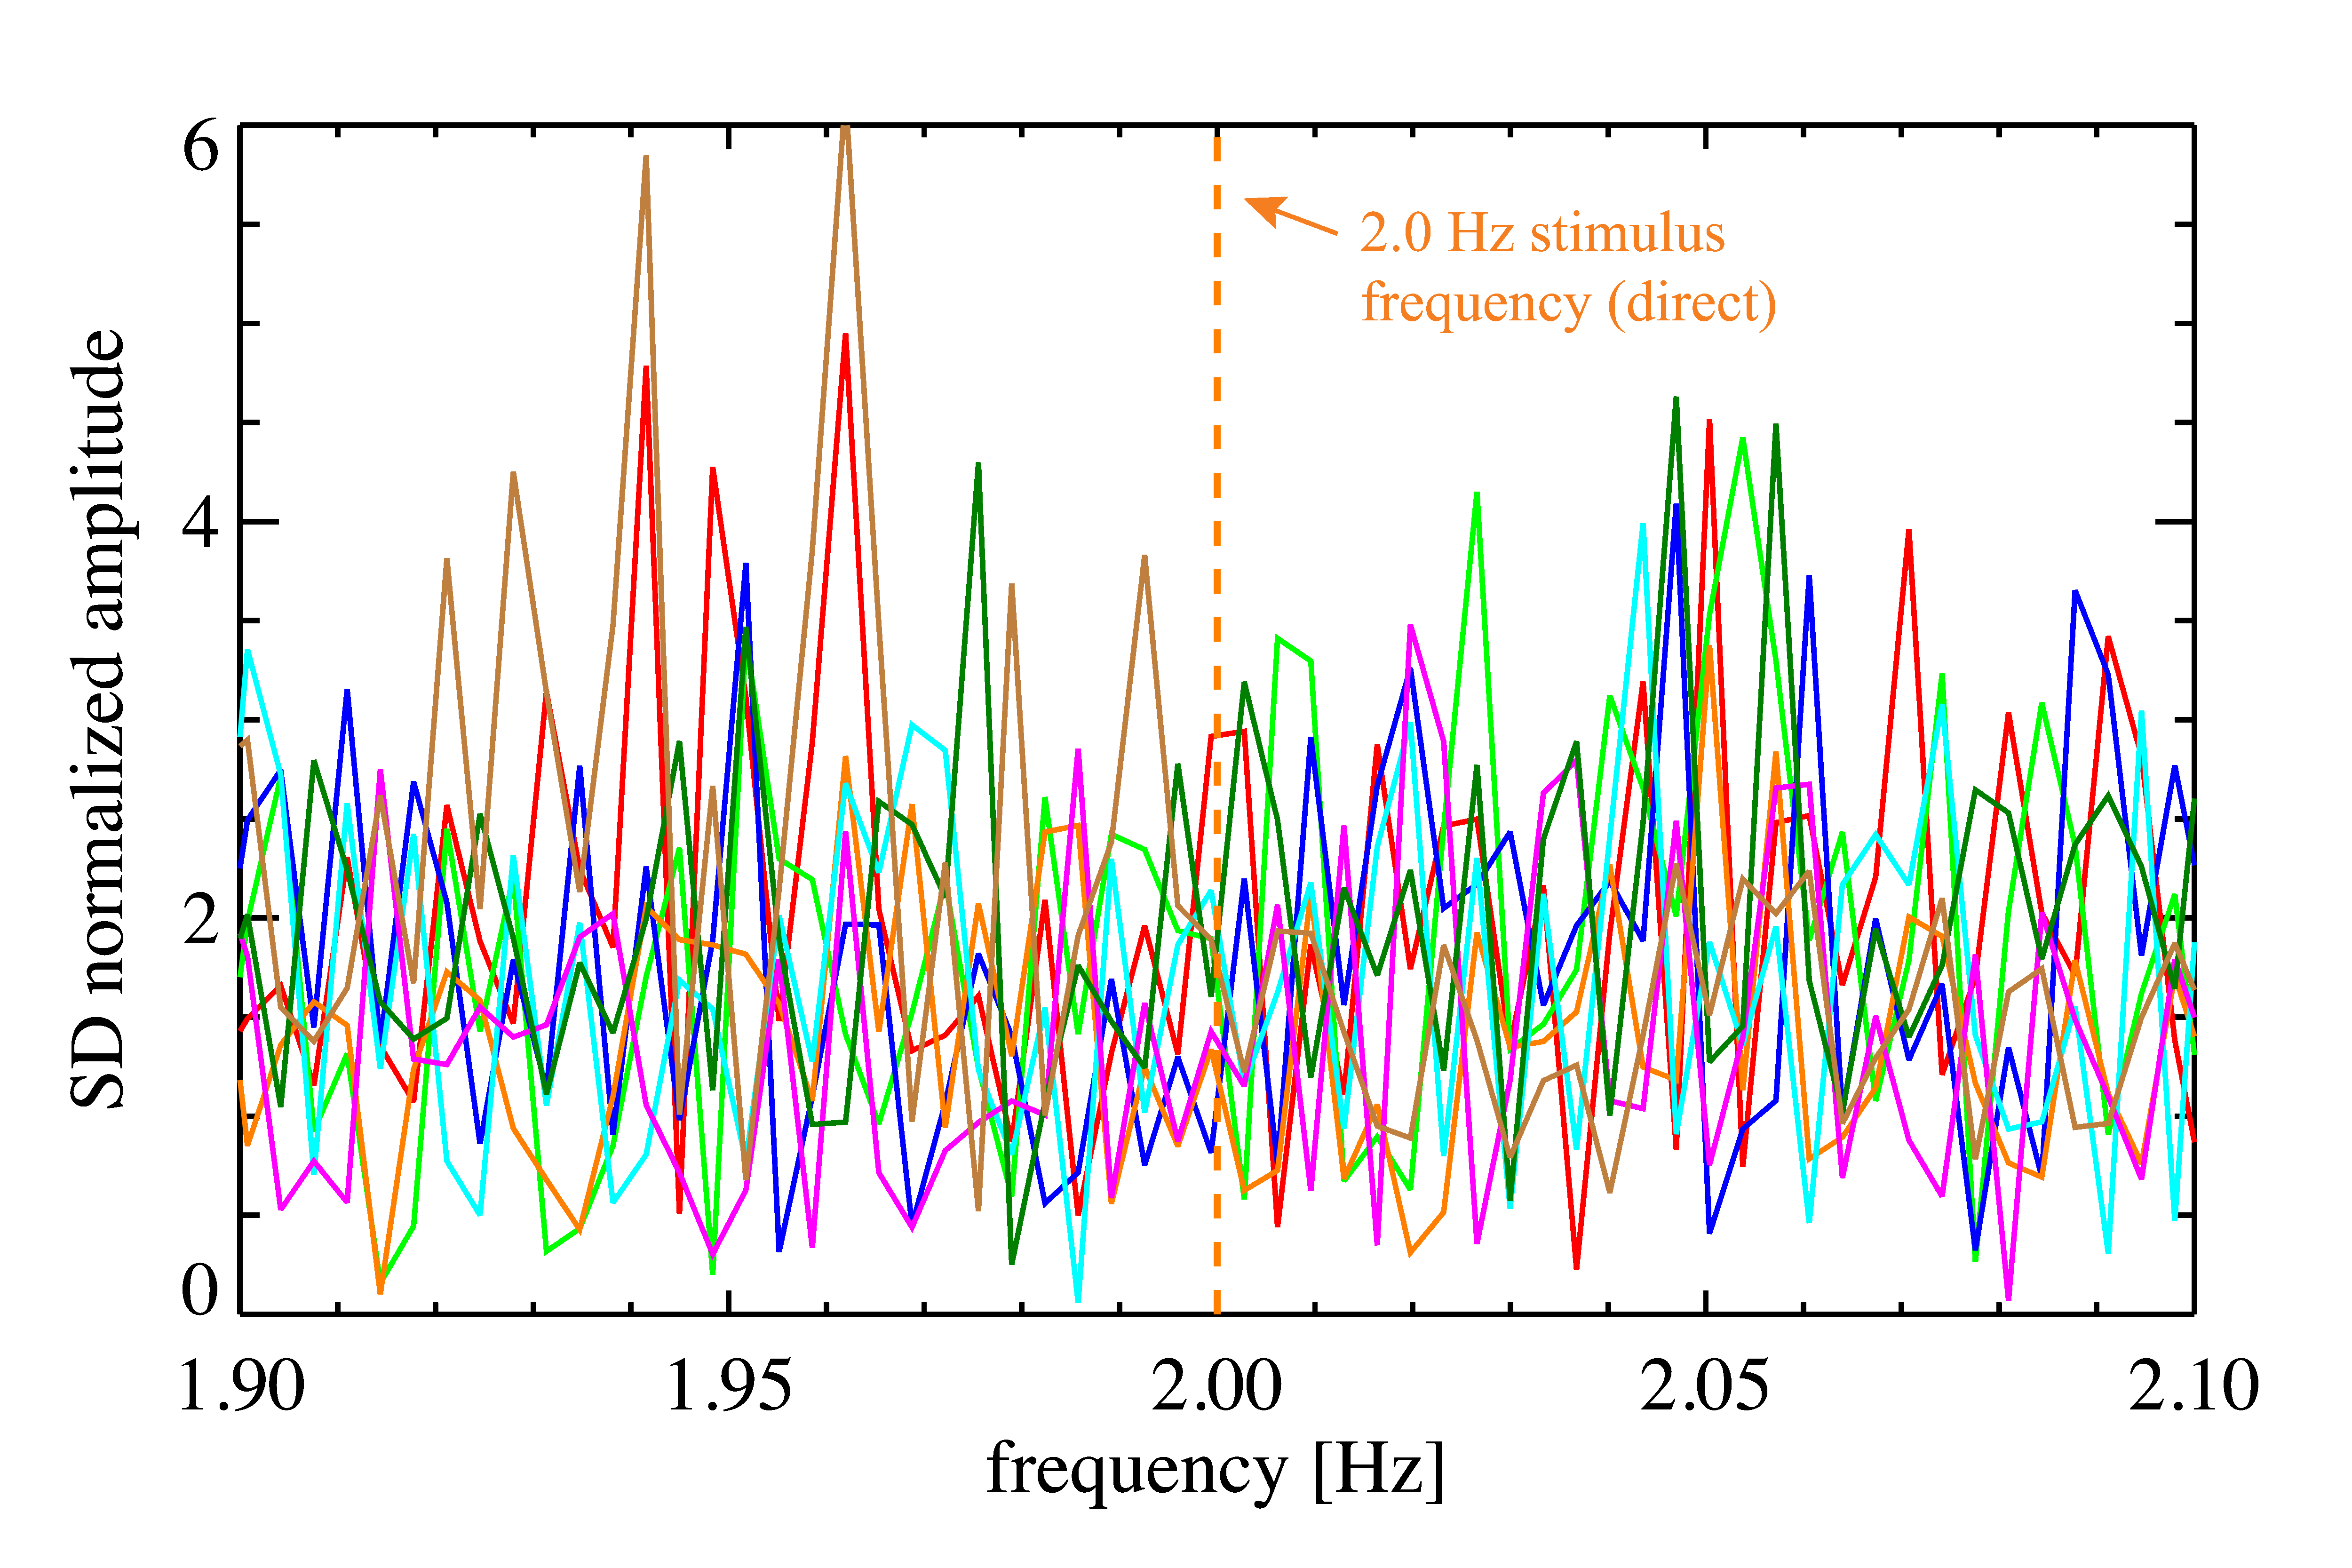
Figure 4. The magnitude of the spectra of VC averaged signals in fast stimulus experiments (experiment #4), for eight subjects. The amplitudes were normalized to the SD (in each subject) over the range of 1.36 to 4.1 Hz. Stimulus frequency was 2.0 Hz, marked by the orange line.
Figure 5. Time locked, bin averaged difference from the mean, relative to baseline, for the 500 ms period after stimulus onset in experiment #4. Experiments were performed using 10-degree flip angle, top tow (n=7, since accurate timing information was not recorded for one experiment) and 5-degree flip angle (n=4), bottom row. MR data were binned to either MR TR (35.9 ms, left) or 10 ms (right). Results were averaged within VC, then over volunteers. The pink shaded area shows the estimated p<0.05 confidence interval based on variance over volunteers, accounting for the number of bins used.