2779
Realistic Simulation of Body Composition MRI and Field-Strength Dependence
Ecrin Yagiz1, Sophia X. Cui2, Nam G. Lee1, Bilal Tasdelen1, Ye Tian1, and Krishna S. Nayak1,3
1Ming Hsieh Department of Electrical and Computer Engineering, University of Southern California, Los Angeles, CA, United States, 2Siemens Medical Solutions USA, Inc.,, Los Angeles, CA, United States, 3Department of Biomedical Engineering, University of Southern California, Los Angeles, CA, United States
1Ming Hsieh Department of Electrical and Computer Engineering, University of Southern California, Los Angeles, CA, United States, 2Siemens Medical Solutions USA, Inc.,, Los Angeles, CA, United States, 3Department of Biomedical Engineering, University of Southern California, Los Angeles, CA, United States
Synopsis
MRI is used extensively for body composition assessment in large part due to the increasing prevalence of metabolic disease and obesity. In this work, we provide a framework for simulating body composition MRI, including non-Cartesian sequences and emerging low field strengths. This framework can be utilized to investigate the optimality of acquisition parameters (e.g., resolution, TE, sampling trajectory) and the performance of fat/water separated reconstruction algorithms.
Introduction
MRI is used extensively for body composition assessment, including the quantification of regional adipose tissue and ectopic fat. This is in large part due to the increasing prevalence of metabolic disease and obesity, and the need for short-term biomarkers of intervention efficacy. With the emergence of high-performance low-field (HPLF) scanners, it is important to translate the existing techniques and explore new opportunities [1,2]. In this work, we provide a framework for simulating body composition MRI, including non-Cartesian sequences and emerging field strengths. This framework can be utilized to investigate the optimality of acquisition parameters (e.g., resolution, TE, trajectory) and the performance of water/fat separated reconstruction algorithms.Methods
General Simulation Framework:Figure 1 illustrates the simulation flowchart. The input is a 450x500x200mm3 volume corresponding to the abdomen region with 0.25mm isotropic resolution from the XCAT phantom [3]. Physical parameters were assigned to different tissues as listed in Table 1 [4-6]. The Proton-Density (PD), field-dependent T1 and T2 values were used to generate MR image contrast (e.g., SPGR) using steady-state equation. Susceptibilities were used to generate off-resonance map using a Fourier-based convolution method [7]. For the chemical shift of adipose tissue, a 6-peak model was opted [5,6]. k-Space data was simulated including the off-resonance effects with a given sampling. Noise levels are calibrated via a reference dataset. Bivariate Gaussian noise is added to the synthesized k-space to match the SNR from a reference region, specifically subcutaneous adipose tissue. Signal intensity is scaled by $$$\bigg( B_0 / B_{0,ref}\bigg)^2$$$ and voxel size, and the noise standard-deviation is scaled by $$$ B_0/B_{0,ref} \sqrt{BW/{BW}_{ref}}$$$. The synthetic raw data can be processed with an appropriate fat-water separated reconstruction.
Evaluation:
Experiments were performed using a whole-body 0.55T system (prototype MAGNETOM Aera, Siemens Healthineers, Erlangen, Germany) equipped with high-performance shielded gradients (45 mT/m amplitude, 200 T/m/s slew rate). Two sets of measurements were taken, one of them was used for noise matching.
Cartesian imaging: Single breath-hold Cartesian 2-point 3D GRE VIBE, 320x450 mm2 FOV; 4mm slice thickness; 52 slices in axial direction; 15° FA; 8.7ms TR and TE1/TE2 = 2.1/6 ms, a) 4.6x4.6 mm2 b) 2.8x2.8 mm2 in-plane resolution (for calibration), 3-point 3D axial GRE VIBE acquisition TE1/TE2/TE3 = 2.1/6/9.9 ms with 3.5x3.5 mm2 in-plane resolution. Spiral imaging: Single breath-hold prototype stack of spiral [8] 3-point axial GRE VIBE; 450x450 mm2 FOV; 1.75x1.75 mm2 in-plane resolution; 4mm slice thickness; same TE times (2.1/6, 2.1/6/9.9 ms); 14.8ms TR. Spiral scans were done with 42 interleaves with spiral read-out duration of 3ms. The imaging time didn’t exceed 22 seconds. To match the in-vivo acquisitions, the same set of imaging parameters were used in the framework.
Fat-water separated reconstruction was performed using the flexible two-point algorithm and multi-seed growing algorithm as implemented in the ISMRM Fat/Water toolbox [9-12]. Simulated and experimental data were compared qualitatively/quantitatively using SNR metric.
Field Strength Prediction:
Simulations were then performed for B0 = 0.2T, 0.55T, 1.5T, and 3T for 2-point and 3-point acquisition scheme. The in-plane resolution and slice thickness were kept fixed at 3.5x3.5x4 mm3. The echo time placement was adjusted with field strength [13]. FA was selected as Ernst angle for adipose tissue given the field strength and TR. Table 1 summarizes the selected simulation sequence parameters. The echo images were reconstructed using NUFFT [14], fat/water separated images were calculated in the same fashion as the experimental data.
Results
Figure 2 shows the noise matching dataset together with the simulation results. We show a slice near the pelvic bone as it provides a good visual landmark together with the presence of adipose tissue, muscle tissue, and gastrointestinal (GI) gas bubbles. The simulated images display comparable contrast to the in-vivo images, and SNR values from the simulation and in-vivo counterparts are within 10% of one another. Figure 3 shows a 3-point Dixon imaging comparison. The fat/water separated images and fat fraction maps are consistent for both cartesian and spiral sampling schemes between in-vivo and simulated images. Figure 4 compares simulated image quality over a range of B0 field strengths. It also displays PDFF maps and field maps from fat/water separation algorithm. For lower field strengths, the separation algorithm performs worse due to lower SNR. For higher field strengths the inhomogeneity around GI gas bubbles result in local distortions.Discussion
We present a framework for simulating body composition MRI, including non-cartesian trajectories and emerging field strengths. This simulator can be used to compare different imaging parameters and to evaluate the image quality across different field strengths enabling translation of well-established body composition protocols in traditional field strengths to HPLF. One important application that can benefit from HPLF is extension of body composition MRI to pediatric and fetal scans since the reduced acoustic noise in the lower field strengths enable these types of cohort studies. System imperfections such as gradient non-linearity and concomitant fields are not yet included in this work and remain future work. Their inclusion will increase the computational cost.Conclusion
We have demonstrated a framework for realistic simulation of body composition MRI for different field strengths and validated it with in-vivo images. This framework enables rapid evaluation of different imaging parameters and compare/fine-tune imaging protocols at different field strengths.Acknowledgements
We acknowledge grant support from the National Science Foundation (#1828736) and research support from Siemens Healthineers.References
- Campbell-Washburn AE, Ramasawmy R, Restivo MC, Bhattacharya I, Basar B, Herzka DA, et al. Opportunities in Interventional and Diagnostic Imaging by Using High-performance Low-Field-Strength MRI. Radiology. 2019 Oct 1;:190452.
- C. Guenthner, H. Dillinger, P. Boernert and S. Kozerke, "Three-Point Dixon Abdominal Water/Fat Separation using a Lower-Field 0.75T MRI", in Proc. Intl. Soc. Mag. Reson. Med., 2021 [Online]. #3844
- Segars WP, Sturgeon G, Mendonca S, Grimes J, Tsui BMW. 4D XCAT phantom for multimodality imaging research. Med Phys. Published online 2010. doi:10.1118/1.3480985.
- Bottomley PA, Hardy CJ, Argersinger RE, Allen-Moore G. A review of 1H nuclear magnetic resonance relaxation in pathology: are T1 and T2 diagnostic?. Med Phys. 1987;14(1):1-37. doi:10.1118/1.596111
- Hamilton, G., Yokoo, T., Bydder, M., Cruite, I., Schroeder, M. E., Sirlin, C. B., & Middleton, M. S. (2011). In vivo characterization of the liver fat ¹H MR spectrum. NMR in biomedicine, 24(7), 784–790. https://doi.org/10.1002/nbm.1622
- G. Simchick, A. Yin, H. Yin, and Q. Zhao, “Fat spectral modeling on triglyceride composition quantification using chemical shift encoded magnetic resonance imaging,” Magnetic Resonance Imaging, vol. 52, pp. 84–93, Oct. 2018, doi: 10.1016/j.mri.2018.06.012.
- Bouwman JG, Bakker CJG. Alias subtraction more efficient than conventional zero-padding in the Fourier-based calculation of the susceptibility induced perturbation of the magnetic field in MR. Magn Reson Med. Published online 2012. doi:10.1002/mrm.24343
- Mugler JP, Fielden SW, Meyer CH, Altes TA, Miller GW, Stemmer A, et al. Breath-hold UTE Lung Imaging using a Stack-of-Spirals Acquisition. In: Proc ISMRM. 2015. p. 1476.
- Berglund, J., Ahlström, H., Johansson, L., & Kullberg, J. (2011). Two-point dixon method with flexible echo times. Magn Reson Med., 65(4), 994–1004. doi: 10.1002/mrm.22679
- H. H. Hu et al., “ISMRM workshop on fat-water separation: Insights, applications and progress in MRI,” Magnetic Resonance Medicine, vol. 68, no. 2, pp. 378–388, Aug. 2012, doi: 10.1002/mrm.24369.
- Johan Berglund, Lars Johansson, HŒkan Ahlstršm, and Joel Kullberg 'Three-point Dixon Method Enables Whole-Body Water and Fat Imaging of Obese Subjects'. Magnetic Resonance in Medicine 63 (6): 1659-1668 (2010).
- Johan Berglund, HŒkan Ahlstršm, Lars Johansson, and Joel Kullberg 'Closed-form solution for the three-point Dixon method with advanced spectrum modeling' Submitted to Proc. ISMRM 2011
- Ma, J. (2008). Dixon techniques for water and fat imaging. Journal of Magnetic Resonance Imaging: An Official Journal of the International Society for Magnetic Resonance in Medicine, 28(3), 543-558.
- BART Toolbox for Computational Magnetic Resonance Imaging. doi:10.5281/zenodo.592960. [Online] https://zenodo.org/record/4570601
Figures
Table 1: Simulation Parameters. (top) Tissue Parameters
for several tissue types in the XCAT phantom.
(bottom left) Sequence parameters used in this study. Note that the simulator can be applied to
arbitrary sequences. (bottom right)
Details of the fat spectral model derived from Ref [5,6]. Note that the simulator can use any model,
and can support using different models for different tissue regions (e.g.,
liver vs. adipose tissue)
Figure 1: Simulation Flowchart. Inputs to the simulator include the
indexed voxelized phantom, table of NMR tissue properties (PD, T1, T2,
susceptibilty, chemical shift), sequence parameters including k-space
trajectory, and realistic per-sample noise measurements. The output is
synthesized noisy raw data. This data
can be reconstructed and processed using the same pipeline used for
experimental data.
Figure 2: Validation at 0.55T. The simulation framework was noise matched
using the displayed in-vivo images with parameters: single breath-hold
Cartesian multi-echo 3D axial GRE VIBE sequence; TE1/TE2
= 2.1/6 ms; TR = 8.77ms; (a) 4.6 x 4.6 mm2 (b) 2.8 x 2.8 mm2
in-plane resolution. The simulated images provide comparable depiction of
structures with similar contrast and tissue SNR within 10% of in-vivo images,
as expected due to in-vivo tissue heterogeneity.
Figure 3: 3-point cartesian and
spiral water/fat imaging comparison. Shown are (left) in-vivo and
(right) simulated images. in-vivo imaging parameters: single-breath hold
examination; TE1/TE2/TE3 = 2.1/6/9.9 ms; (top)
Cartesian multi-echo 3D axial GRE VIBE (bottom) spiral prototype
stack-of-spiral multi echo 3D GRE VIBE. For simulation, imaging parameters were
matched. Raw data was reconstructed via NUFFT, followed by fat/water separation.
Resulting fat, water images and proton density fat fraction (PDFF) maps shows excellent
agreement.
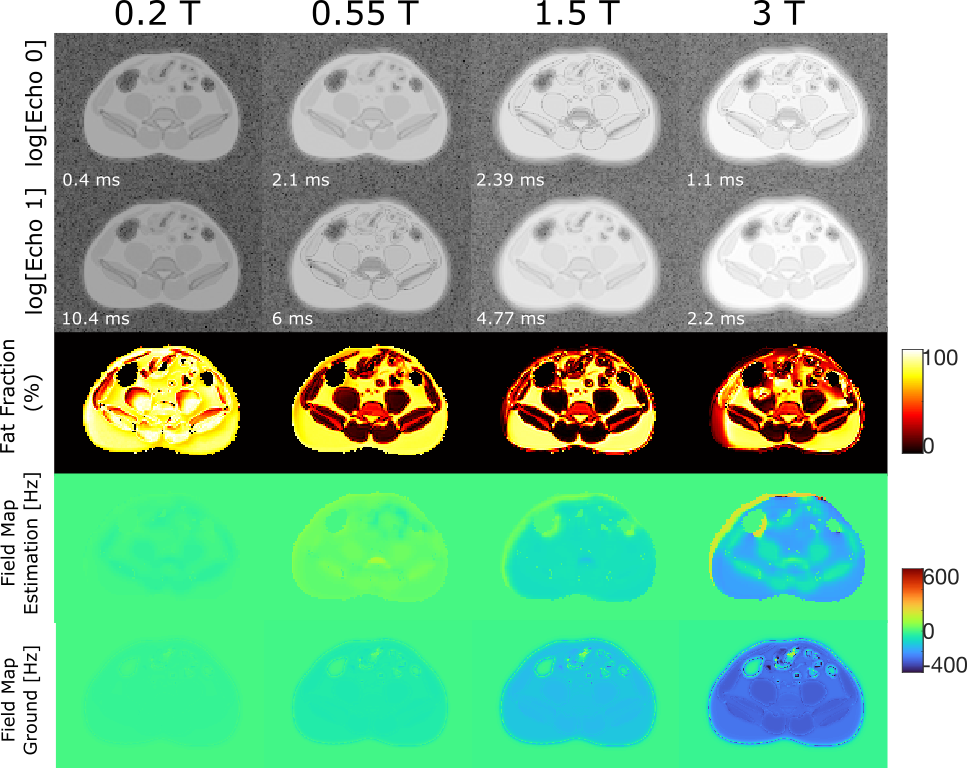
Figure 4: Simulation
of 2-point Dixon Cartesian body composition MRI at different field strengths. Echo times were chosen for
each field strength appropriately and are annotated. The echo magnitude images are
displayed in logarithmic scale. Proton density fat fraction (PDFF) maps and
estimated field maps are shown with the ground field maps for each field
strength. The inhomogeneity at the higher field strengths result in local
distortions, whereas in the SNR becomes a concern for lower field strengths.
DOI: https://doi.org/10.58530/2022/2779