2777
An open-source repository of minimum echo time sequences1Biomedical Engineering, Columbia University, New York, NY, United States, 2Columbia Magnetic Resonance Research Center, Columbia University, New York, NY, United States
Synopsis
Ultrashort Echo Time (UTE) sequences are clinically useful in short T2 tissues such as bone, cartilage, and lung parenchyma. To help harmonize UTE protocols across clinical sites, we present an open-source repository implementing three basic radial minimal TE sequences using PyPulseq: 2D UTE, 3D UTE, and COncurrent Dephasing and Excitation (CODE). Functions for customized sequences and reconstruction scripts were provided for a complete pipeline. Echo Times (TEs) from 0.12 to 0.82 ms were achieved, and 27.6% more signal was captured in the bone and connective tissue in 2D ex vivo images compared to the GRE reference.
Introduction
Ultrashort Echo Time (UTE) sequences facilitate clinical visualization of short T2 tissue components such as ligaments and tendons, periosteum, and cortical bone . Being less sensitive to T2* effects, it can be used effectively for lung imaging and has shown high agreement with CT with regard to pulmonary image findings in COVID-19 patients2. Typically, a radial trajectory is used to minimize TE and non-Cartesian reconstruction is needed. As a part of the effort to facilitate vendor-independent sequence development, we present a repository that implements three sequences in the multi-vendor Pulseq format3 and provide reconstruction scripts so that experiments may be replicated.Methods
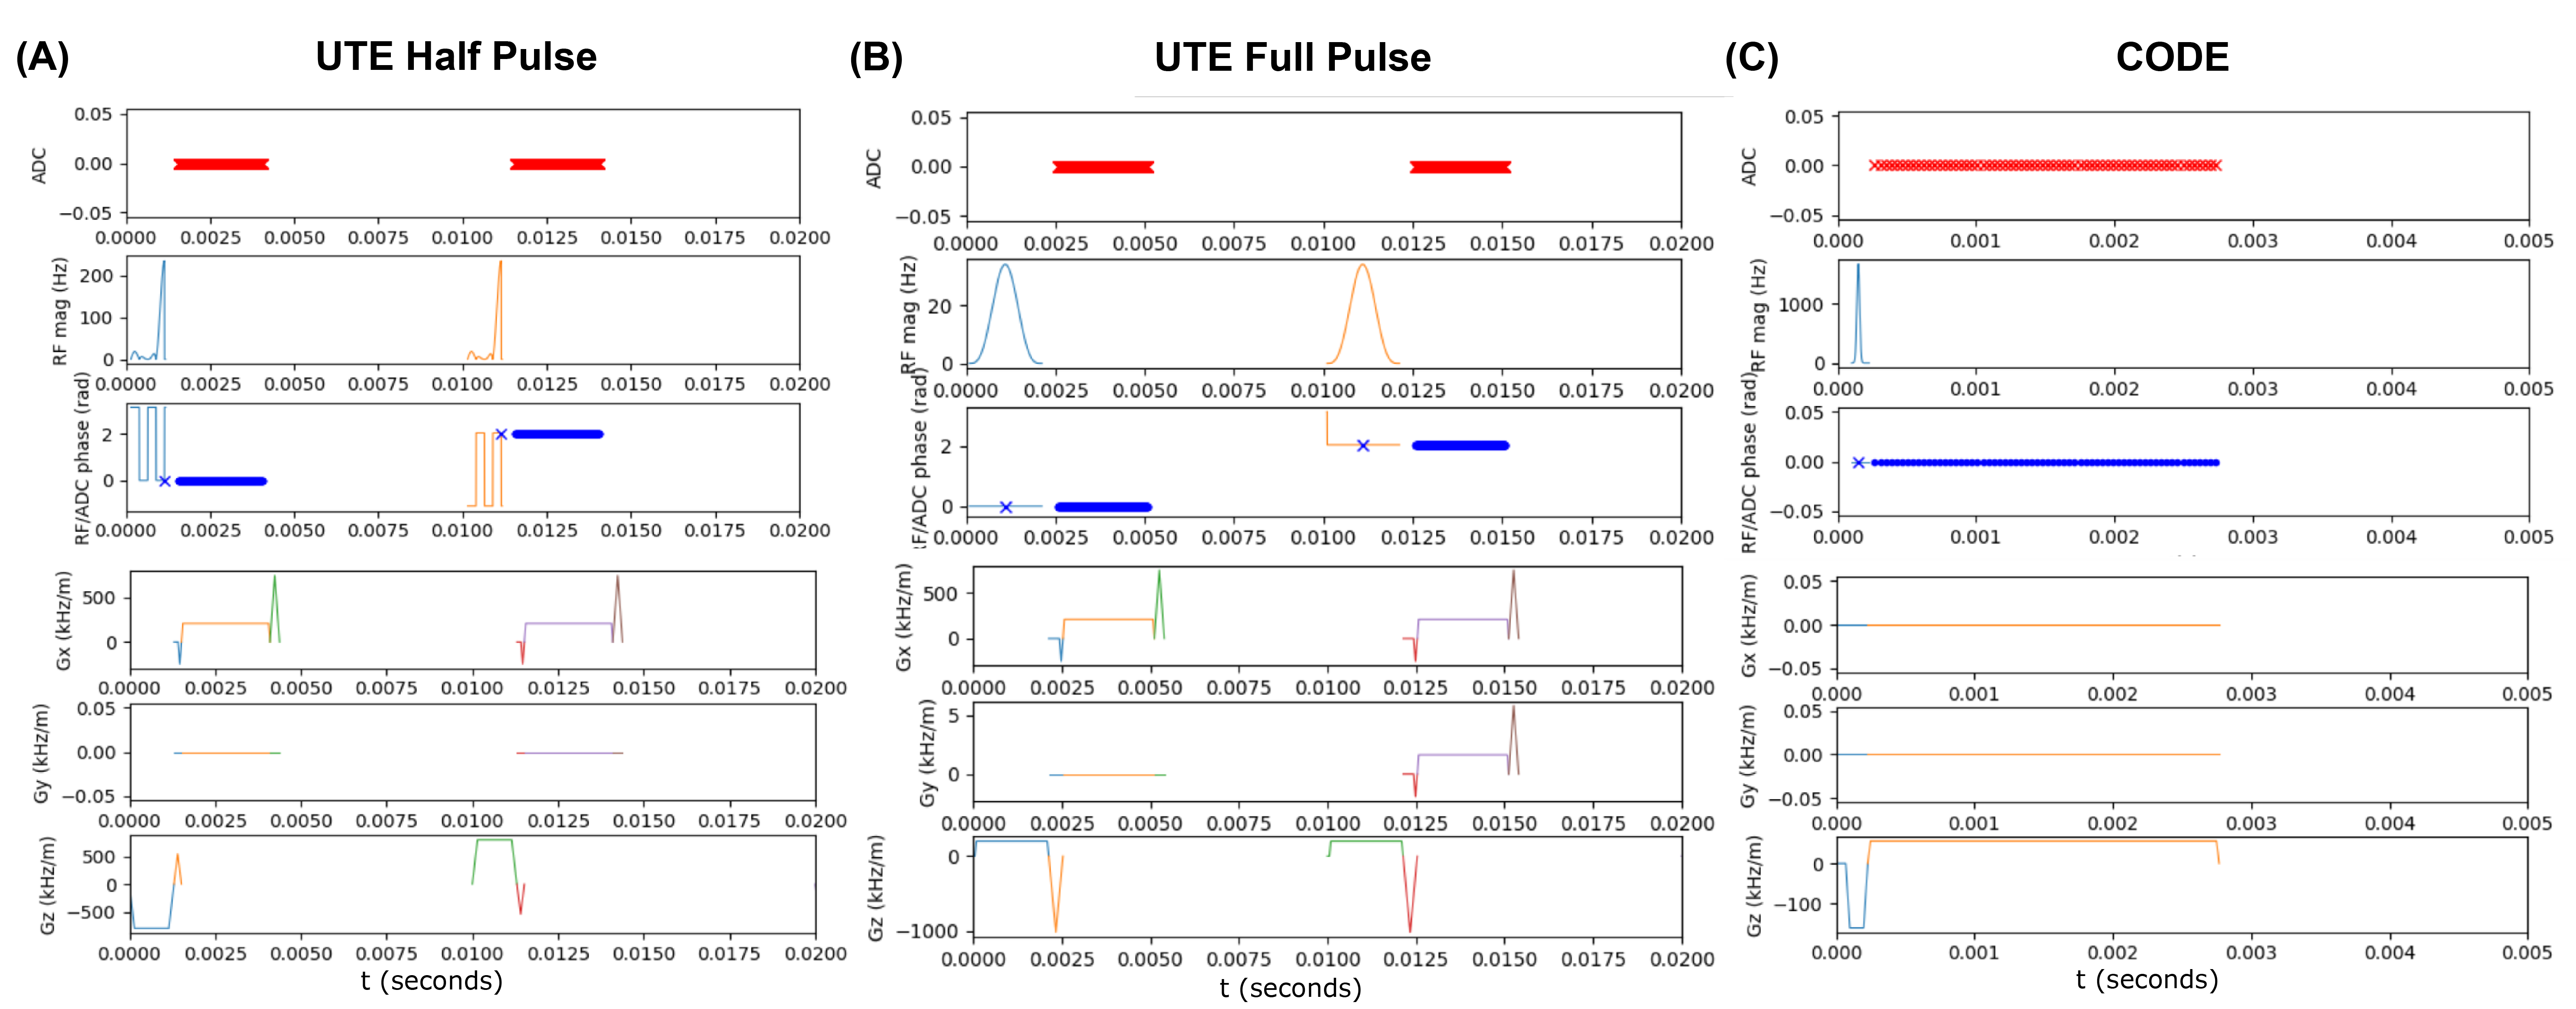
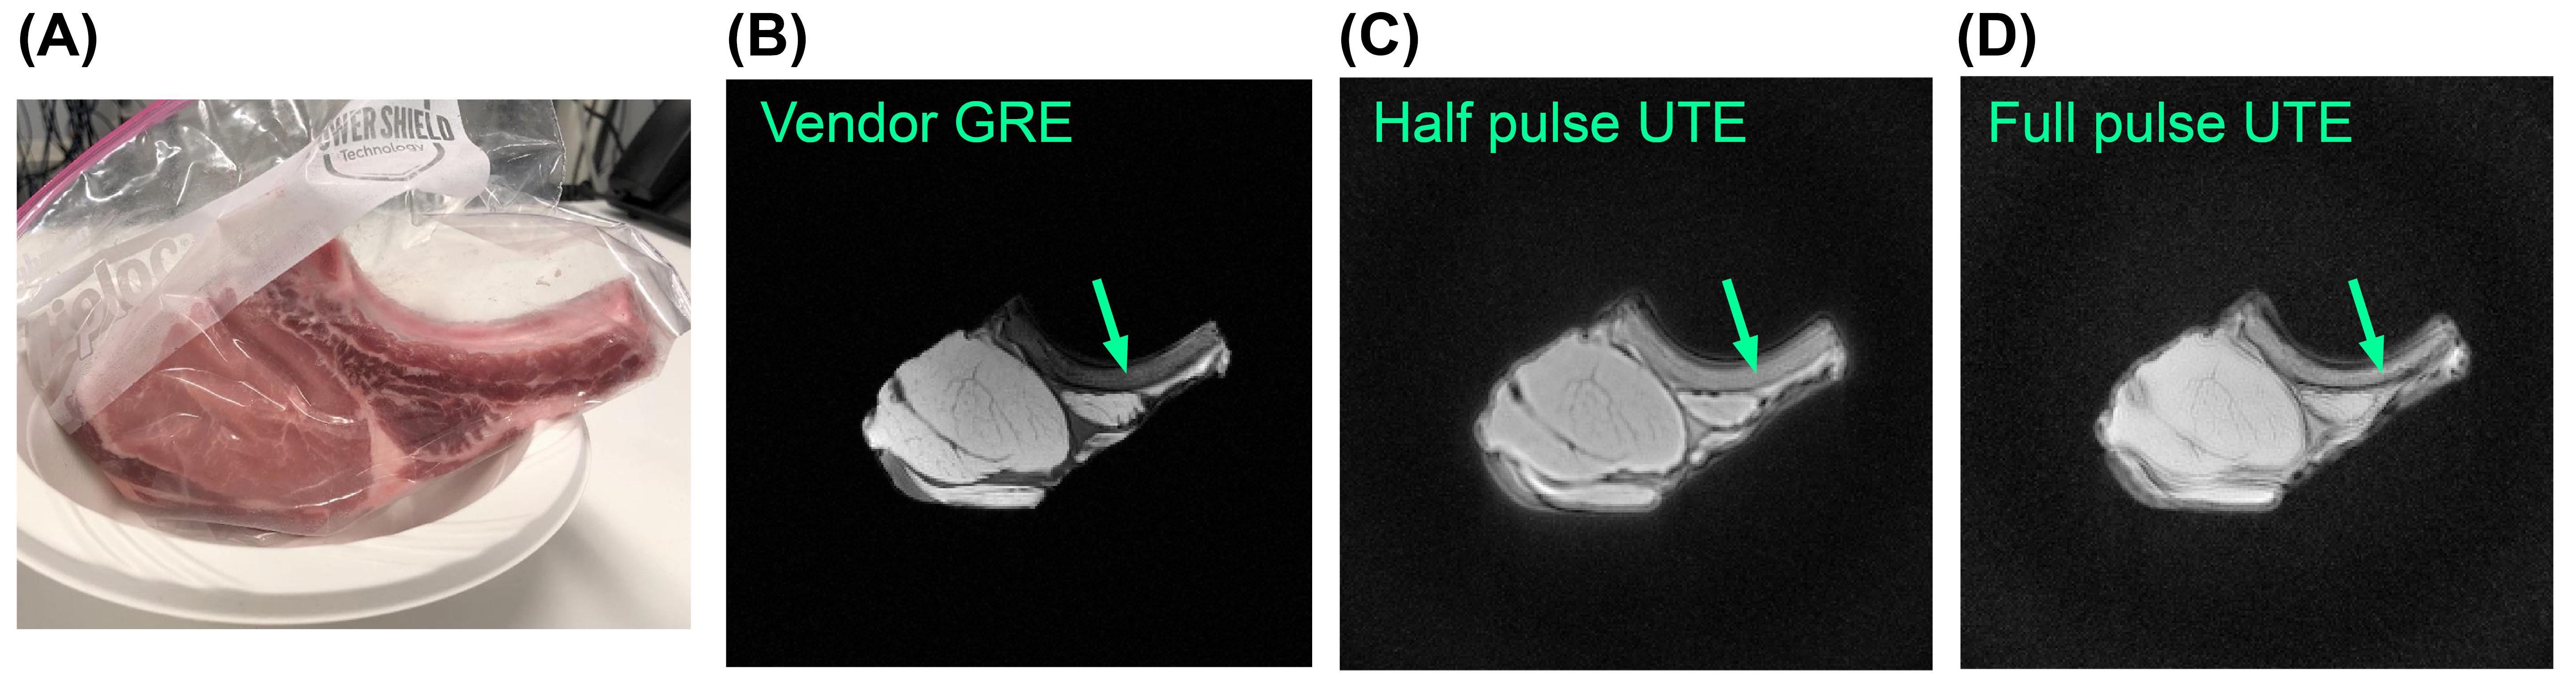
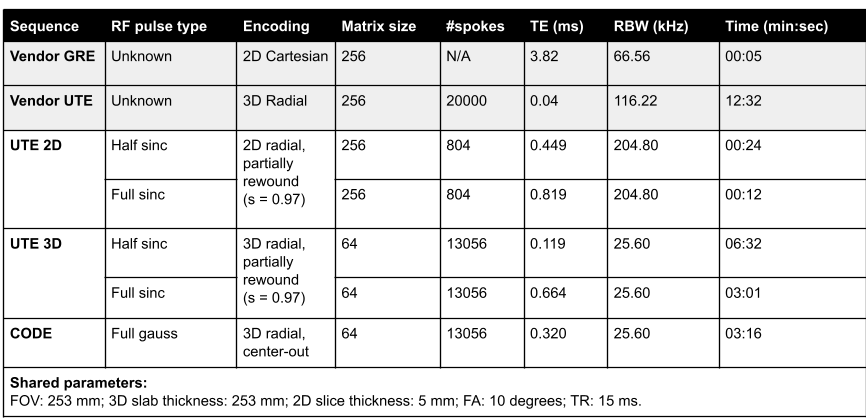
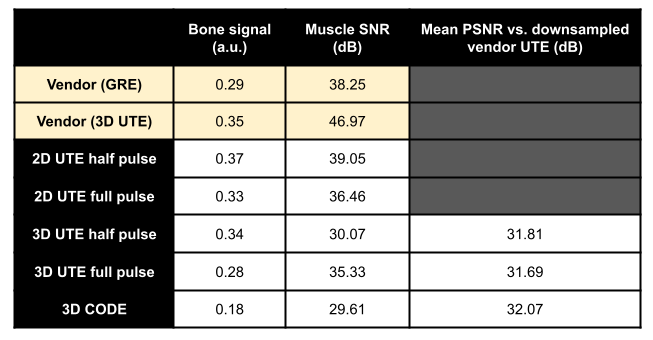
All sequences were implemented using the PyPulseq (version 1.3.1.post1)4,5 as Python functions with sequence parameters as arguments6. All sequences used partially rewound radial sampling at the Nyquist limit, where the amount of rewinding was tunable for the 2D and 3D UTE sequences. This factor was fixed by design in the CODE sequence7. A choice of full or half RF pulse was included for the UTE sequences, where the half pulse option reduced the minimum TE but doubled the acquisition time, as expected8. Figure 1 shows the sequence diagrams.We imaged an ex vivo sample of porcine muscle and bone using a 20-channel head coil in a 3T Siemens Prisma Fit system with its thickness along the axial direction (Figure 2(A)). Acquisition and reconstruction parameters for the five tested sequences are shown in Table 1. In addition, we ran vendor-provided 2D GRE and 3D UTE sequences with matched matrix size, FOV, TR, and flip angle. We reconstructed all images with the PyNUFFT library9 using the conjugate gradient method (maxiter = 50) and included reconstruction scripts in the repository6. For 2D sequences, we measured SNR using an elliptical ROI in the muscle for signal level and a circular ROI above the bone for noise level. A manual ROI in the bone measured mean bone signal after image normalization. We computed PSNR of the 3D images against a N=64, or four-times down-sampled version, of the vendor 3D UTE images.
Results
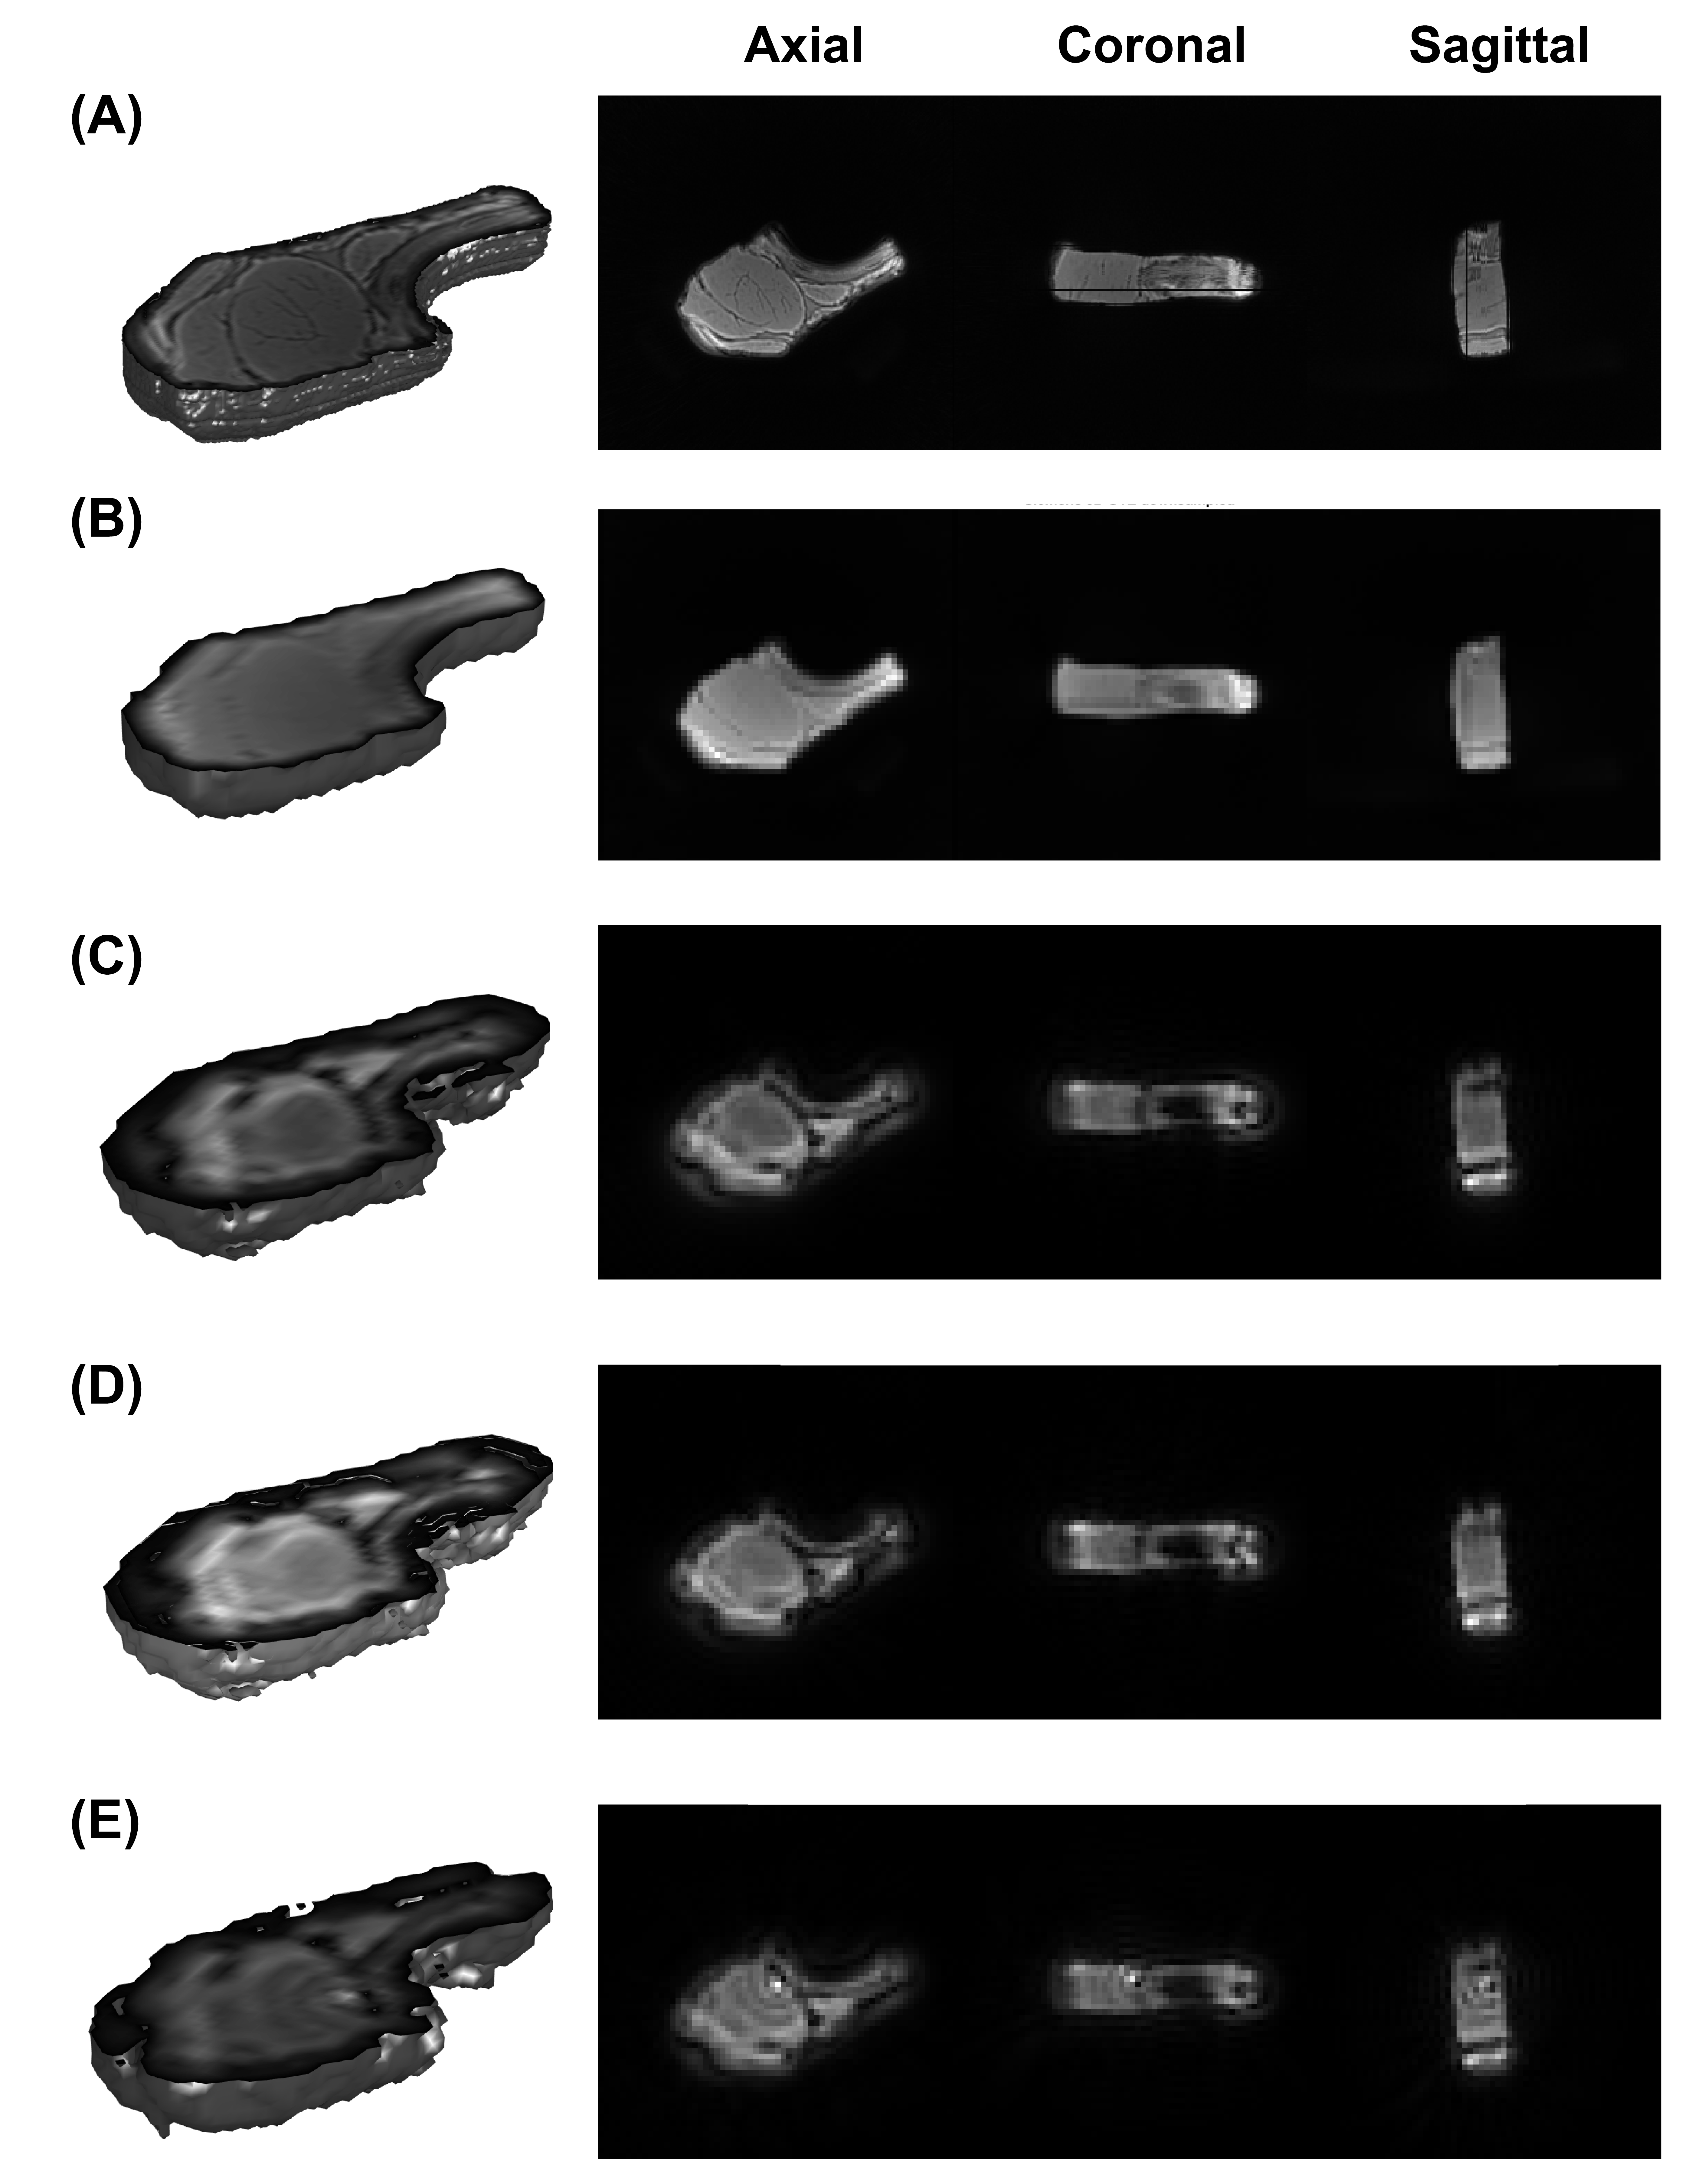
Figure 2 shows the 2D images from vendor GRE and the two PyPulseq 2D UTE implementations. The GRE at TE = 3.82 ms showed better tissue delineation. Both 2D UTE sequences captured 27.6% more signal in the bone and connective tissue with more blurred tissue boundaries. 2D SNR values was similar to that of the vendor GRE. Compared to the down-sampled vendor UTE images, the PyPulseq 3D images with N=64 showed significant point-spread effects (Figure 3) while keeping similar relative signal levels between bone and other tissues. The CODE images had radial artifacts that could be attenuated with longer TRs but were not in order to compare image quality at the same TR as other sequences. Using the down-sampled vendor UTE images as reference, the 3D PyPulseq images show a PSNR of around 32 dB. Image metrics are summarized in Table 2.Discussion and conclusion
We have implemented three basic short to ultra-short TE sequences1 that capture considerable signals from pork bone and connective tissue. Specific .seq files can be generated with custom imaging parameters, and non-cartesian reconstruction scripts complete the acquisition pipeline.The 2D images were similar in resolution and geometrical accuracy but had lower SNR in the muscle signal compared to the vendor 3D UTE. This is expected for vendor UTE because of the inherent SNR advantage in 3D acquisitions. The 3D UTE SNR values were up to 17 dB lower than the vendor images, which we attribute to PSF effects causing higher signal variation in the background. The CODE image had the lowest SNR due to radial artifacts.
The implemented sequences have several limitations. First, the minimum TE achieved (0.119 ms, 3D half pulse UTE) was about three times that of the vendor sequence because the slab-selective RF duration was limited by maximum gradient strength on our system configuration (32 mT/m). Second, the 3D sequence resolution is low. This was mainly caused by a concern in sequence file loading, as larger files tend to take longer to load and are likely to freeze the console software. Solving this problem requires changes in the Pulseq interpreter and is outside of the scope of this work. Alternatively, multiple sequence files could be used to make up one sequence; this strategy could incur additional sources of error in storage, transfer, and usage. Third, while the 2D images are similar to the 3D vendor images in the extent of point-spread blurring, artifacts in the 3D images caused more serious ringing that lowered the PSNR values. Better RF design and spatial sampling schemes would be required to achieve image qualities closer to the vendor’s.
Further work includes optimizing parameters for typical clinical applications, adding more sequences to the repository such as SWIFT and ZTE, and improving resolution through better RF pulse design and file loading procedures. Major improvements on the 3D sequences will focus on matching vendor image quality by assessing structural similarity and investigating PSF effects with a point-like sample. The sequences will be further evaluated and documented using an in-house open-source sequence validation framework10.
Acknowledgements
This work was supported by the Seed Grant Program for MR Studies and the Technical Development Grant Program for MR Studies of the Zuckerman Mind Brain Behavior Institute at Columbia University and Columbia MR Research Center site, and was also performed at Zuckerman Mind Brain Behavior Institute MRI Platform, a shared resource and Columbia MR Research Center site.References
1. Holmes JE, Bydder GM. MR imaging with ultrashort TE (UTE) pulse sequences: Basic principles. Radiography. 2005;11(3). doi:10.1016/j.radi.2004.07.007
2. Yang S, Zhang Y, Shen J, et al. Clinical potential of UTE-MRI for assessing COVID-19: Patient-and lesion-based comparative analysis. J Magn Reson Imaging. 2020;52(2):397-406.
3. Layton KJ, Kroboth S, Jia F, et al. Pulseq: A rapid and hardware-independent pulse sequence prototyping framework. Magn Reson Med. 2017;77(4):1544-1552. doi:10.1002/mrm.26235
4. Ravi KS, Potdar S, Poojar P, et al. Pulseq-Graphical Programming Interface: Open source visual environment for prototyping pulse sequences and integrated magnetic resonance imaging algorithm development. Magn Reson Imaging. 2018;52(February):9-15. doi:10.1016/j.mri.2018.03.008
5. Ravi K, Geethanath S, Vaughan J. PyPulseq: A Python Package for MRI Pulse Sequence Design. J Open Source Softw. 2019;4(42). doi:10.21105/joss.01725
6. imr-framework/minTE. Accessed November 7, 2021. https://github.com/imr-framework/minTE
7. Park JY, Moeller S, Goerke U, et al. Short echo-time 3D radial gradient-echo MRI using concurrent dephasing and excitation. Magn Reson Med. 2012;67(2). doi:10.1002/mrm.23026
8. Nielsen HTC, Gold GE, Olcott EW, Pauly JM, Nishimura DG. Ultra-short echo-time 2D time-of-flight MR angiography using a half- pulse excitation. Magn Reson Med. 1999;41(3). doi:10.1002/(SICI)1522-2594(199903)41:3<591::AID-MRM23>3.0.CO;2-R
9. Lin JM. Python non-uniform fast fourier transform (PyNUFFT): An accelerated non-cartesian MRI package on a heterogeneous platform (CPU/GPU). J Imaging. 2018;4(3). doi:10.3390/jimaging4030051
10. Tong G, Geethanath S, Qian E, Vaughan Jr JT. Validating Open-Source MR Sequences for Reproducible Research. In: Proc. Intl. Soc. Mag. Reson. Med. 29. ; 2021.
Figures