2776
ALFONSO: A versatiLe Formulation fOr N-dimensional Signal mOdel fitting of MR spectroscopy data and its application in MRS of body lipids1Department of Diagnostic and Interventional Radiology, Technical University of Munich, Munich, Germany, 2Munich Institute of Biomedical Engineering, Technical Universit of Munich, Munich, Germany
Synopsis
Multi-dimensional MR spectroscopy is frequently used for the probing of MR properties including the characterization of the water–fat environment in body applications. Previously, many studies used an ad-hoc multi-step approach where the fitting of the spectral content and the signal modelling was performed in separate steps albeit the theoretically compromised precision when compared to a joint fitting and modelling approach. ALFONSO allows the convenient and yet flexible definition of joint fitting and modelling strategies. Its utility and supremacy are demonstrated for the quantification of fat fraction in the liver, ADC in bone marrow and lipid droplet size in a phantom
Introduction/Purpose
An optimal signal fitting and data modelling strategy is integral in the analysis of magnetic resonance spectroscopy (MRS) data. In many scenarios, usage of prior knowledge is crucial to allow the extract of information due to challenges arising from various sources including model uncertainties, overlapping signals and simplified modelling assumptions. Moreover, most of the existing tools target specifically brain applications and do not allow for a combined signal fitting and modelling approach of multi-dimensional MRS data.1–10 MRS in body lipids requires a rigorous handling of prior knowledge to achieve robust data analysis due to e.g. broad linewidths and overlapping signals.11,12 Additionally, the quantification of proton densities requires the modelling of relaxation effects due to relatively short T2 times. Furthermore, the extraction of complementary MR properties such as relaxation properties13,14 or diffusion properties15 has been gaining momentum recently in the search for tissue characteristics beyond its composition. Despite the need for integrated fitting and modelling methods existing solutions remain limited, especially for the study of body lipids. Therefore, the purpose of the present work is the introduction of A versatiLe Formulation fOr N-dimensional Signal mOdel fitting (ALFONSO) which enables the quick and convenient definition of joint fitting and modelling strategies in multi-dimensional MRS.Theory & Methods
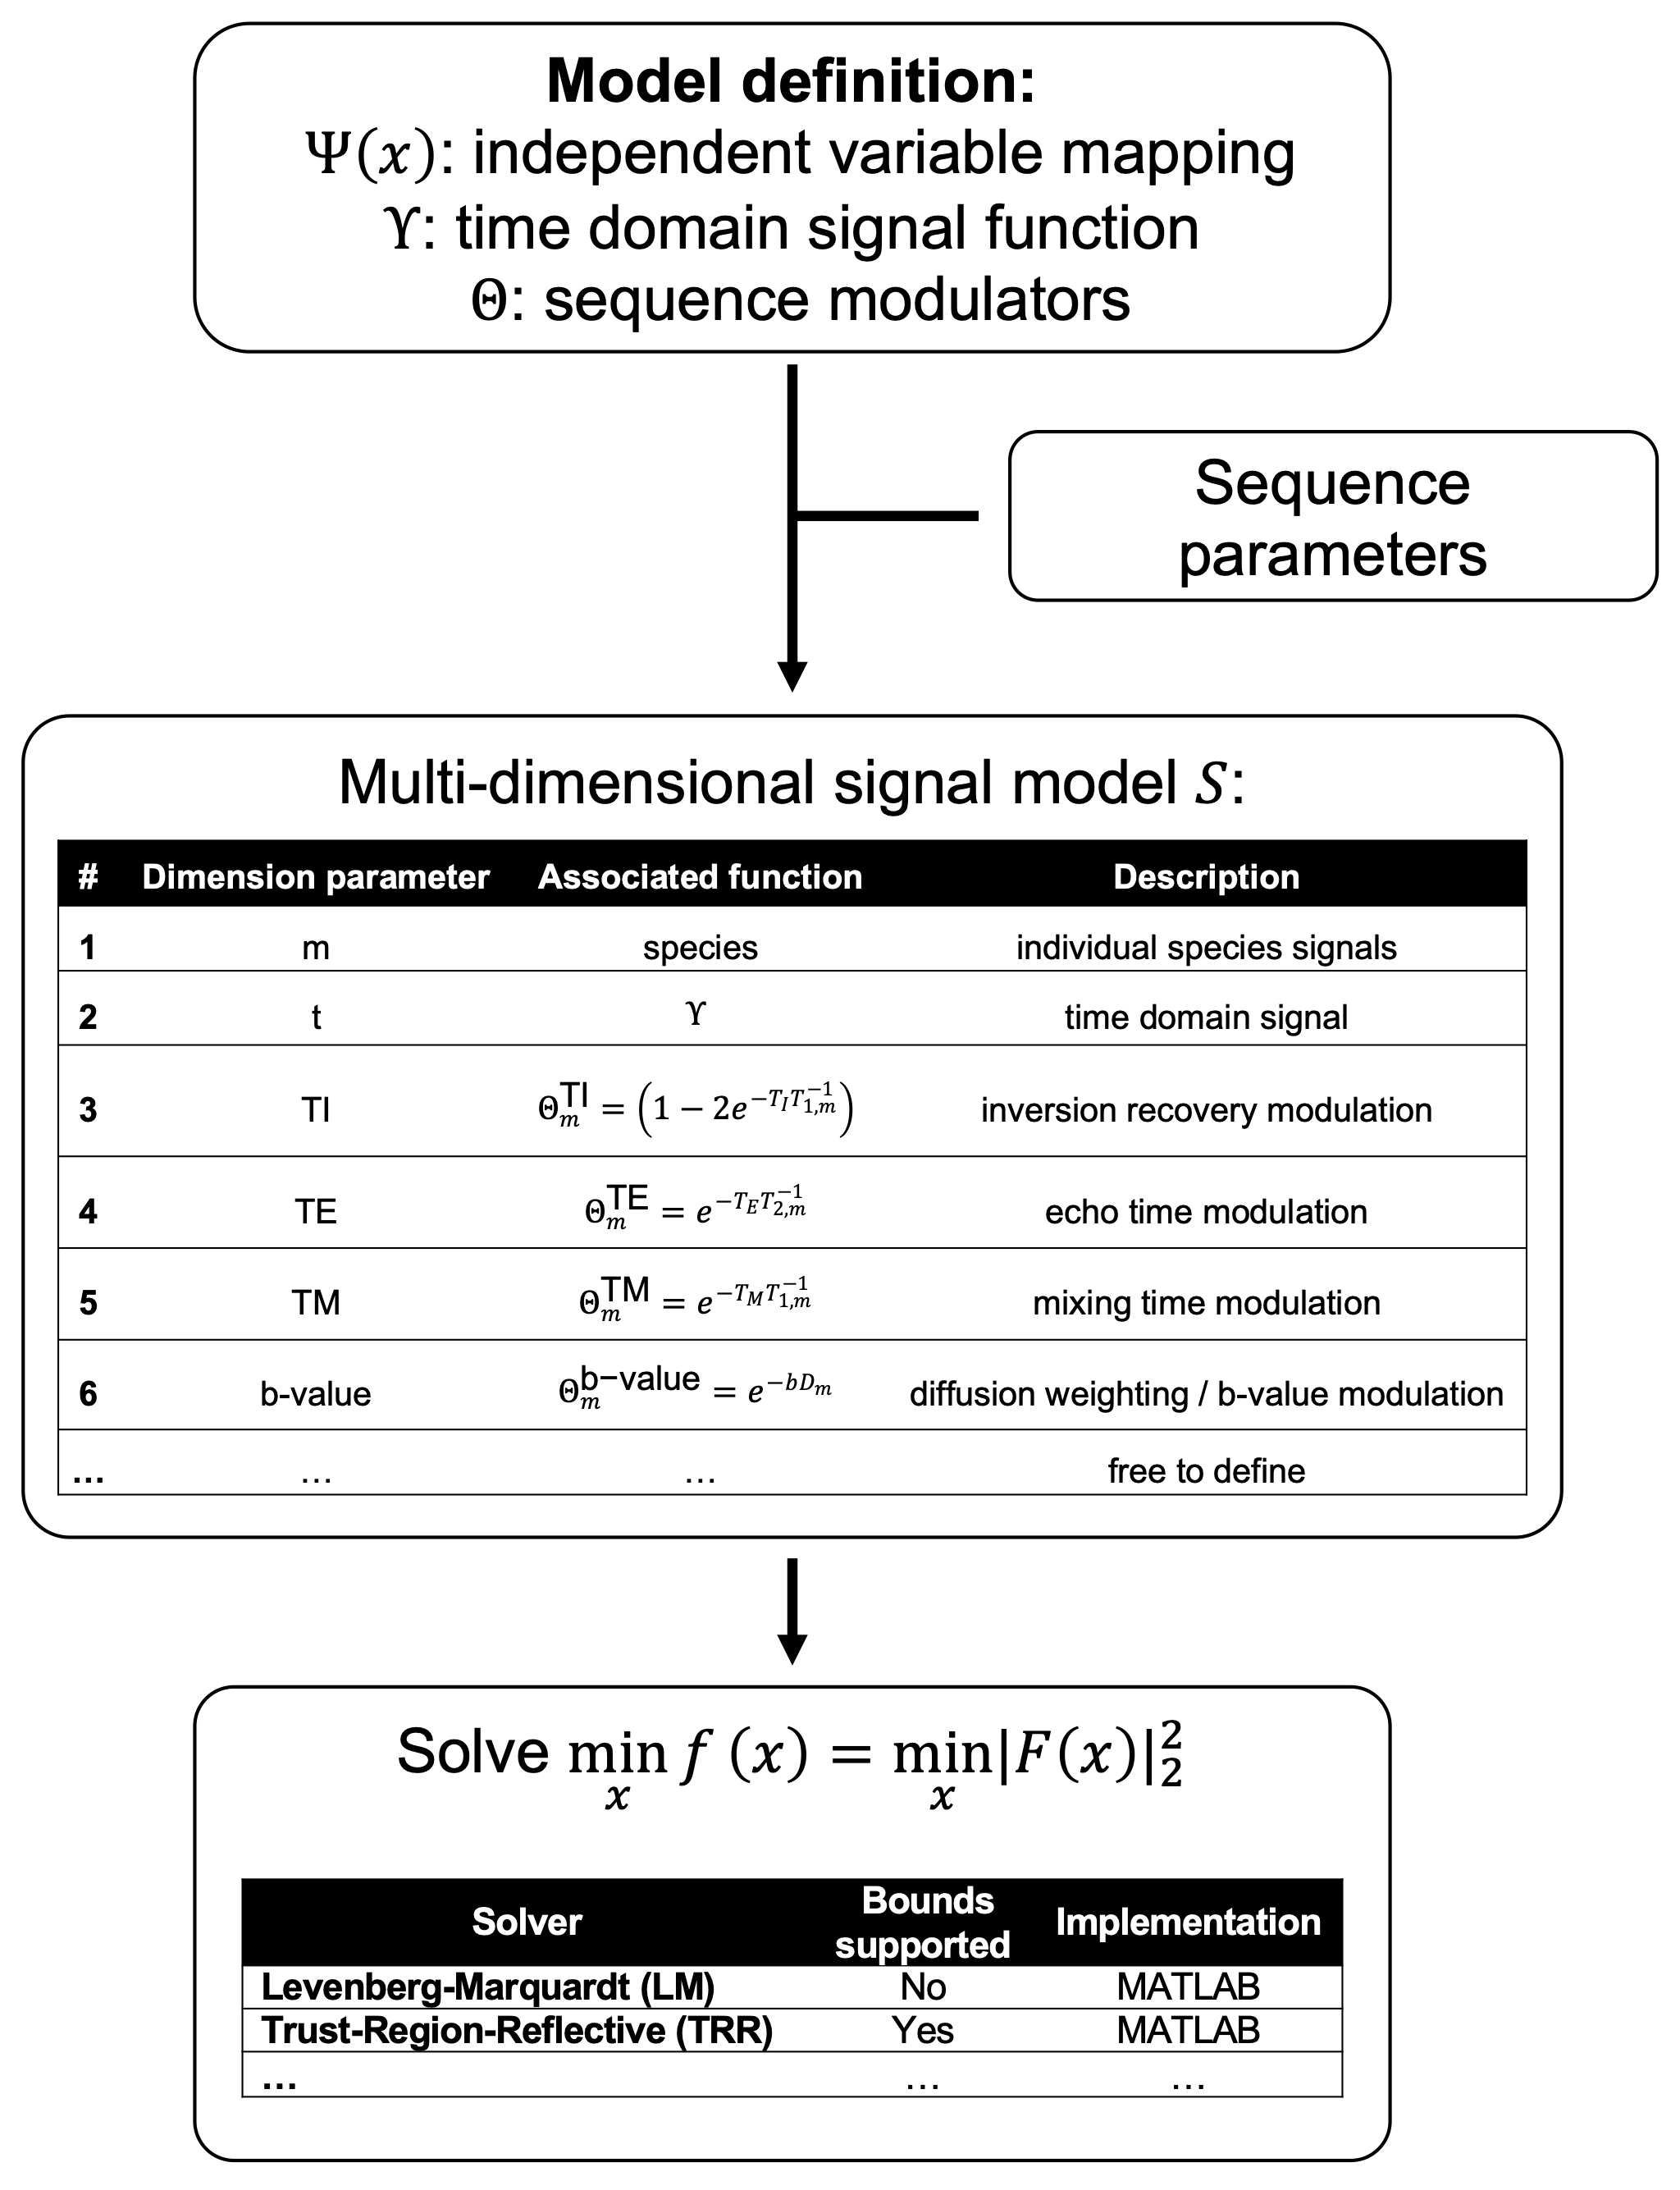
An observed set of measurements $$$\hat{S}$$$ of $$$M$$$ chemical species with $$$N$$$ species features can be expressed as their time domain signals $$$\Upsilon$$$ times the product of sequence specific modulation functions $$$\Theta$$$:$$\hat{S}=\sum_{m=1}^{M}S_m=\sum_{m=1}^{M}{\Upsilon_m\Theta_m}$$
with
$$\Upsilon_m\left(t\right)=\varrho_me^{i2\pi\omega_mt}e^{i\phi_m}e^{-\left(d_m+\frac{1}{2}g_m^2t\right)t}+\epsilon,$$
where $$$\varrho_m$$$ is the proton density, $$$\omega_m$$$ is the resonance frequency, $$$\phi_m$$$ is the initial phase, $$$d_m$$$ and $$$g_m$$$ are the Lorentzian and Gaussian damping factors of the $$$m$$$-th chemical species, respectively. $$$\epsilon$$$ represents the complex Gaussian noise term with zero mean and variance $$$\sigma^2$$$;
and $$$\Theta$$$ is the product of sequence specific modulation functions (Fig. 1), including optional factors for inversion recovery, echo time, mixing time and diffusion weighting.
A set of measurements $$$\hat{S}$$$ can then be fit with a species parameter set $$$P_{species}$$$ which holds all depended variables:
$$\underset{N{\times}M}{P_{species}}=\left[\begin{array}{cccc}\rho_1&\rho_2&\dots&\rho_M\\\omega_1&\omega_2&\dots&\omega_M\\\phi_1&\phi_2&\dots&\phi_M\\d_1&d_2&\dots&d_M\\g_1&g_2&\dots&g_M\\T_{1,1}&T_{1,2}&\dots&T_{1,M}\\T_{1,2}&T_{2,2}&\dots&T_{2,M}\\D_1&D_2&\dots&D_M\\\vdots&\vdots&\ddots&\vdots\end{array}\right]$$
The introduction of prior knowledge and constraints can then be realized using a mapping function $$$\Psi(x)$$$which maps the independent variable vector $$$x$$$ on $$$P_{species}$$$ :
$$\Psi\left(x\right)\mapsto\underset{N{\times}M}{P_{species}}$$
Parameter constraints can now be imposed using transformation functions. For example, the exponential function ($$$\exp{\left(x\right)}:R\rightarrow{}R^+$$$) can be used to impose positive values and a modified tanh function permits only a value range between a lower (lb) and upper (ub) bound:
$$\operatorname{tanhb}_{\text{lb}}^{\text{ub}}\left(x\right)=\left(\tanh(x)+1\right)\frac{\text{ub}-\text{lb}}{2}+\text{lb}$$
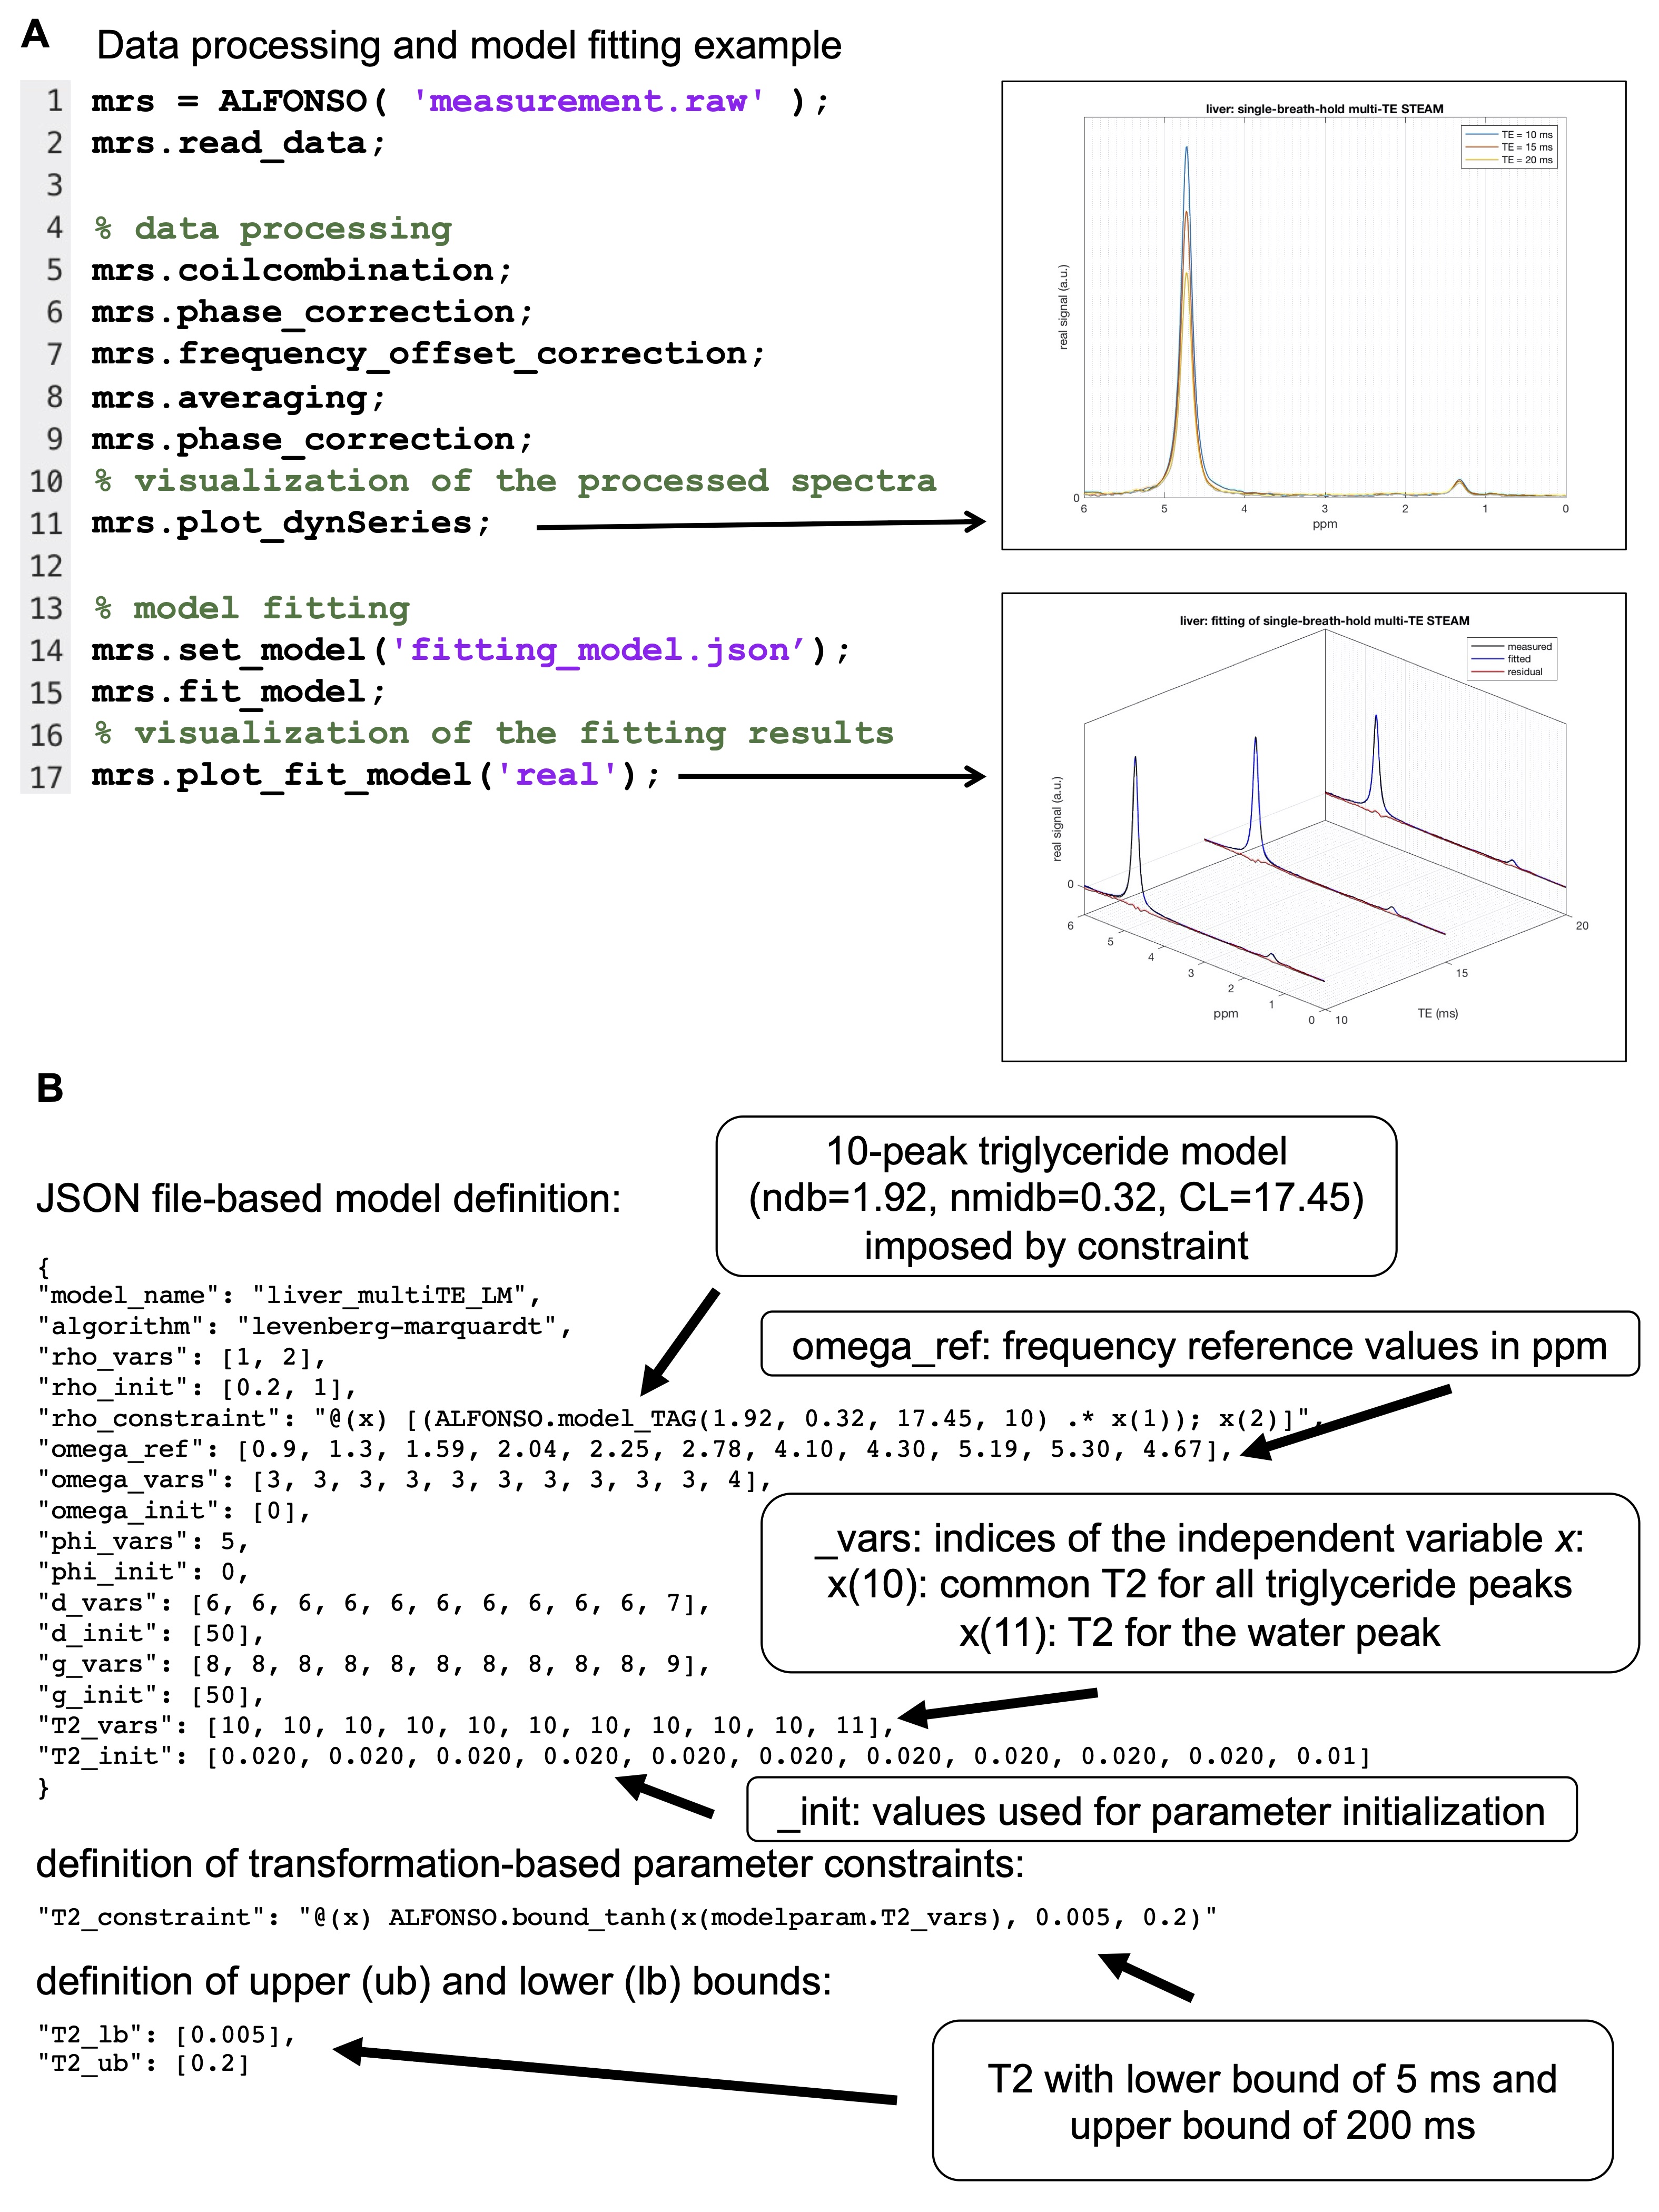
In the present context also a 10-peak triglyceride16 constraint function was defined as:
$$\operatorname{TAG}\left(ndb,nmidb,CL\right)=\left(\begin{array}{cccc}1&ndb&nmidb&CL\end{array}\right)\left(\begin{array}{cccccccccc}9&-24&6&0&6&0&2&2&1&0\\0&-8&0&4&0&0&0&0&0&2\\0&2&0&-4&0&2&0&0&0&0\\0&6&0&0&0&0&0&0&0&0\end{array}\right)$$
Finally, the optimization problem can be formulated as
$$\min_x{f}\left(x\right)=\min_x|F\left(x\right)|_2^2$$
where $$$F(x)$$$ is obtained by splitting $$$\hat{S}$$$ into its real and imaginary parts to allow the fitting of real-valued parameters:
$$\mathrm{F}(\mathrm{x})=\left[\begin{array}{l}\operatorname{Re}(\widehat{\mathrm{S}}(\Psi(x))-y)\\\operatorname{Im}(\widehat{\mathrm{S}}(\Psi(x))-y)\end{array}\right]$$
The present formulation can be used in combination with many existing non-linear least squares solvers including Levenberg–Marquardt algorithm (LM)17,18 or trust region methods19–21.
The developed object-oriented reference implementation in MATLAB (R2019b) allows to carry out JSON-based model definitions. (see Fig.2&4). $$$\Upsilon$$$ and $$$\Theta$$$ were predefined as given above. Additional functions, function overloading and sequence parameters have to be specified in the model definition file. Code is available under https://github.com/BMRRgroup/alfonso.
Case studies
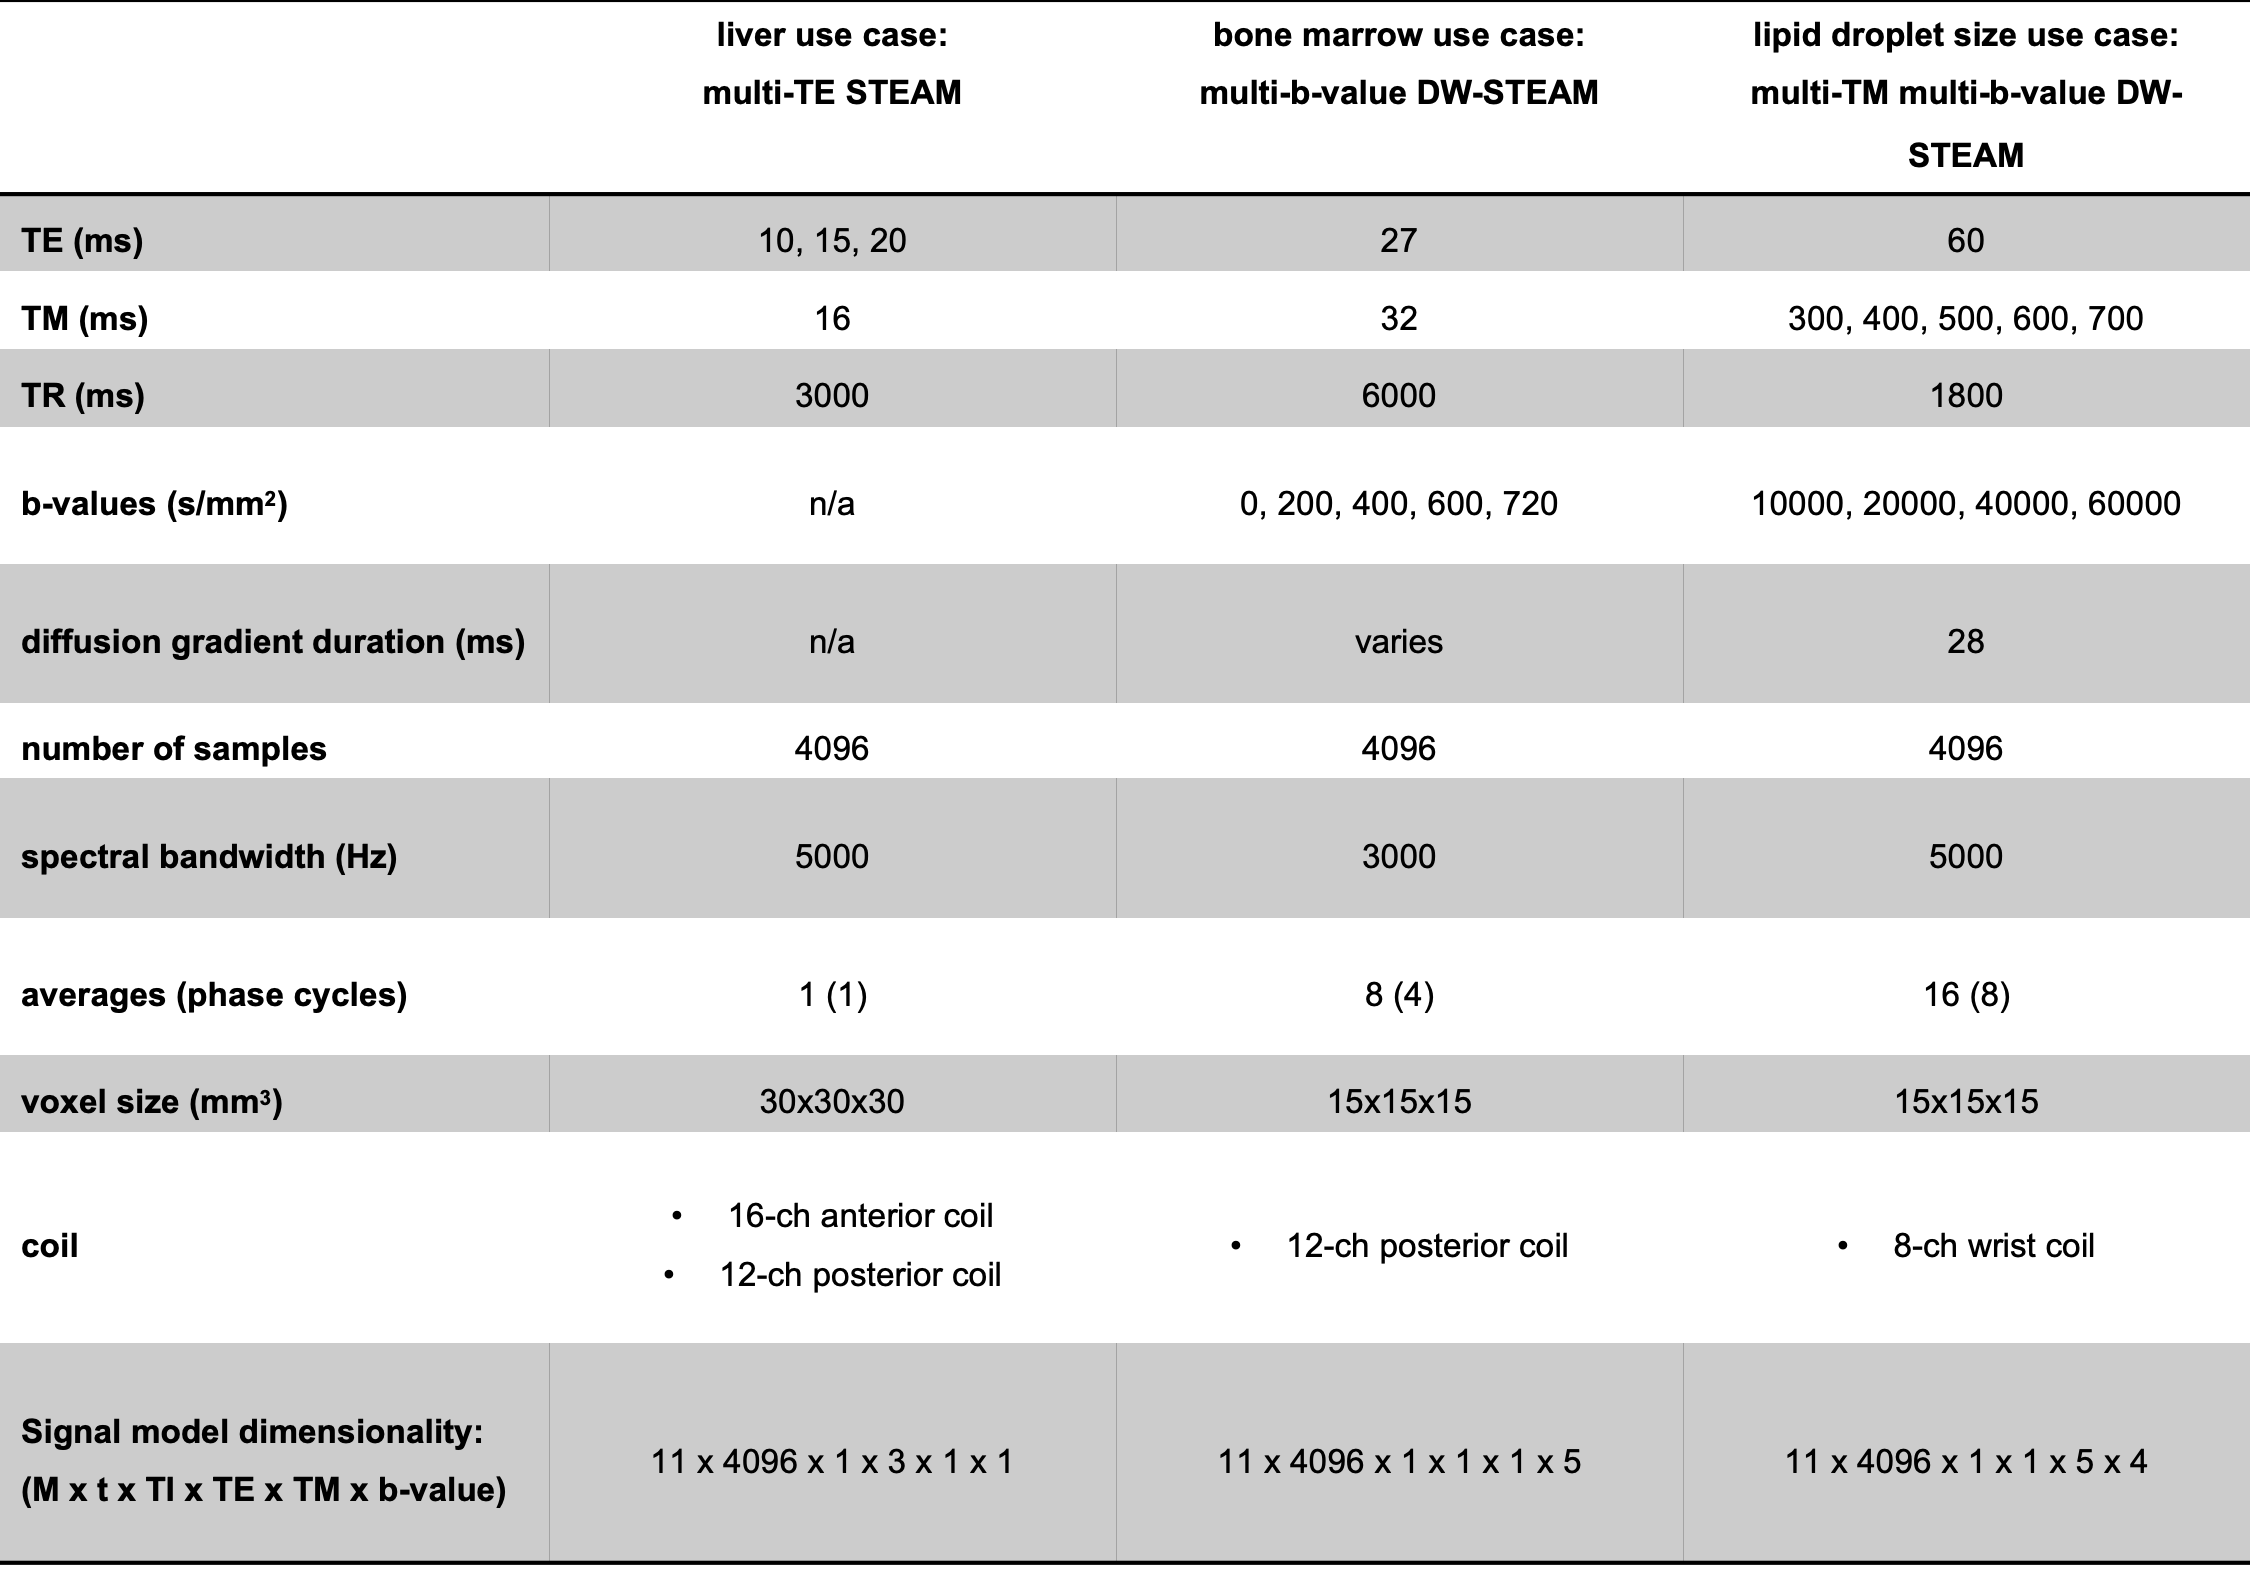
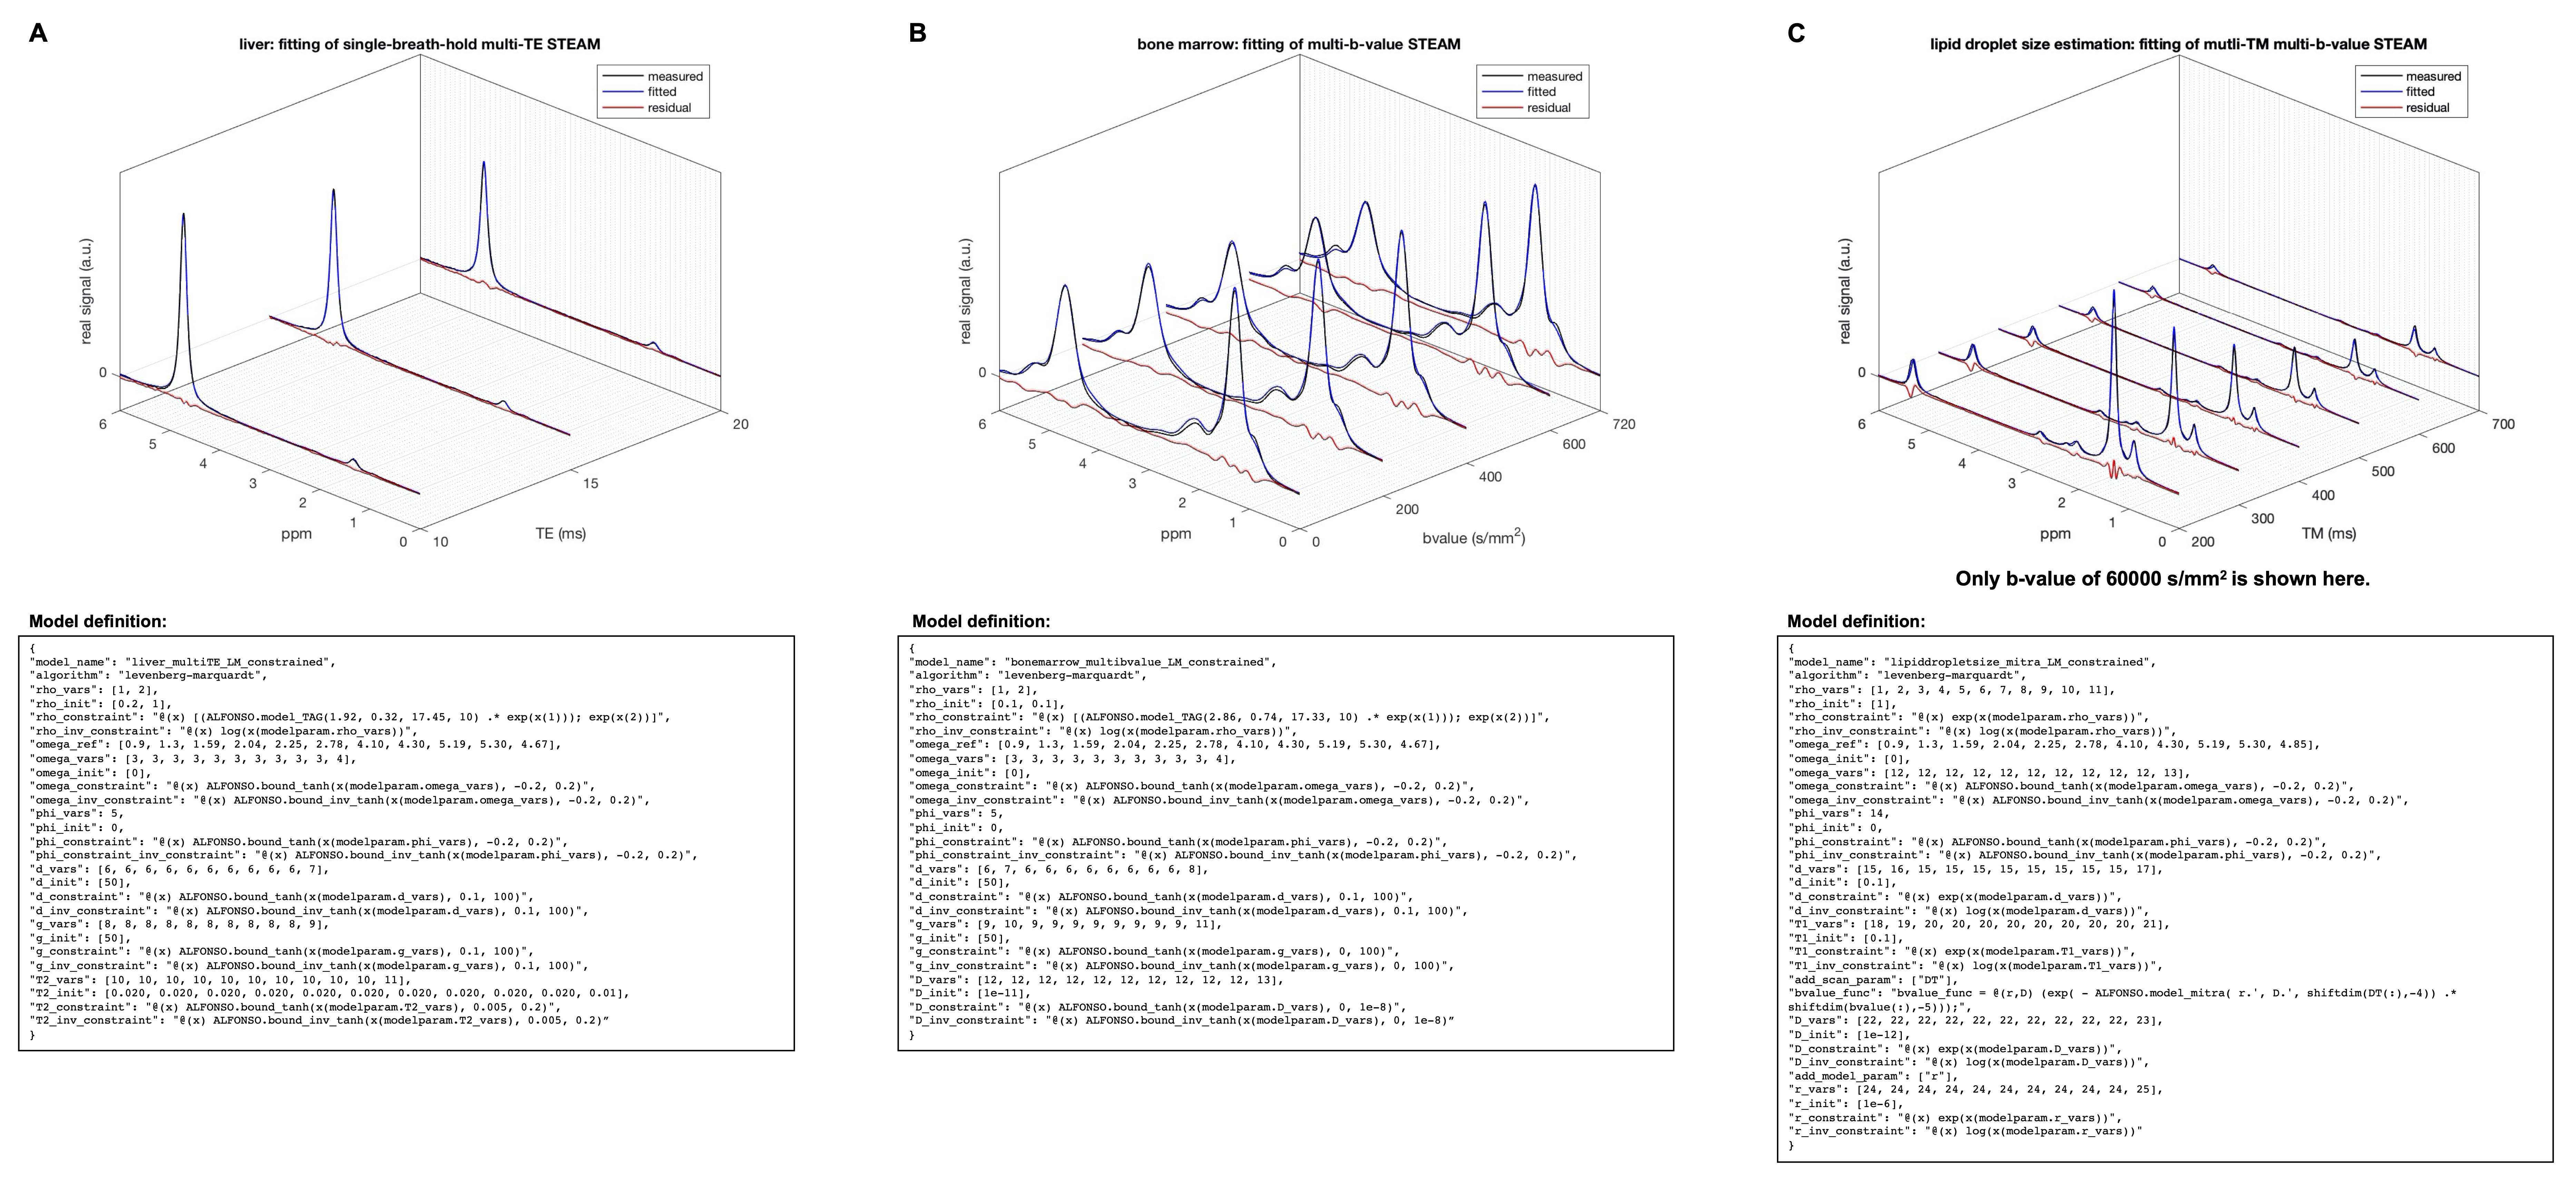
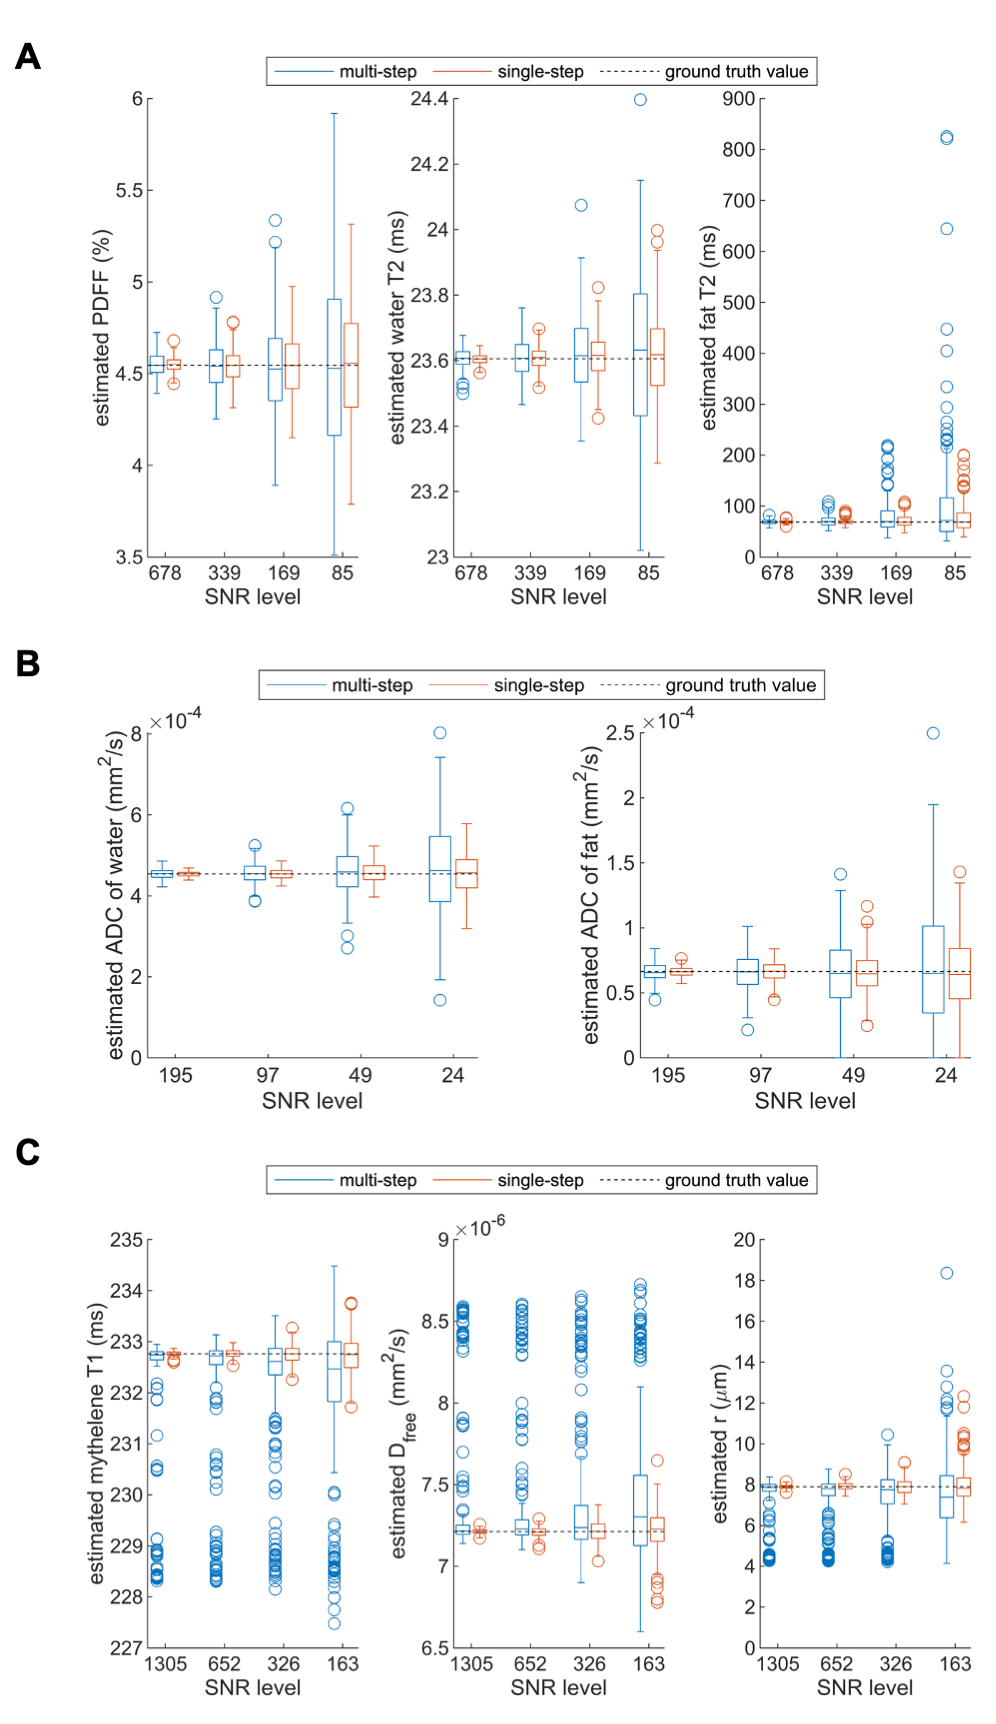
The formulation was tested using MATLAB’s LM solver (see Fig.4 for models) in three case studies: a) T2-corrected fat fraction quantification in the liver, b) characterization of the ADC of water and fat in bone marrow and c) lipid droplet size estimation in a phantom. The droplet size estimation was based on restricted short-time diffusion effects using the formulation by Mitra et al.22:
$$\begin{aligned}\Theta_{m}^{\text{mitra}}&=e^{-bD_{mitra,m}}\\\text{with}\,D_{\text{mitra,m}}&=D_{\text{free,}m}\left[1-\frac{4}{3\sqrt{\pi}}\frac{\sqrt{D_{\text{free,}m}T_{D}}}{r_{m}}\right]\end{aligned}$$
Sequence parameters and corresponding signal dimensionalities are listed in Fig.3. To compare the precision of the proposed joint fitting and modelling approach with a multi-step approach, Monte Carlo (MC) simulations were carried out for four SNR levels with 250 quantification runs each (relative SNR levels of $$$1,\,1/2,\,1/4$$$ and $$$1/8$$$ as measured in the corresponding dataset). Fitting results from the corresponding datasets served as ground truth. For the multi-step approach, all dynamics were fitted independently followed by a fitting of sequence specific modulations $$$\Theta$$$.
Results
An example workflow is depicted in Fig.2 including the following processing steps: SVD-based coil combination23, zero-order phase correction, cross correlation-based frequency offset correction and simple averaging. Visualized and numeric results are given in Fig.4 together with their corresponding model definitions. MC simulations confirmed the theoretical superior precision of the proposed joint fitting and modelling approach when compared to the multi-step approach.Discussion
ALFONSO has some similarities to previously described methods.2,24,25 For examples, handling of prior knowledge is similar to AMARES2 and the dimensionality handling is similar to multi-dimensional decomposition models used in high resolution NMR25 but with extended flexibility. In this regard, the present formalism tried to optimally combine both the handling of multi-dimensional signals and prior knowledge. Limitations of the present study include that only the LM solver was tested, Jacobian/Hessian needed to be calculated using finite differences, potentially oversimplified models and neglected J-modulations.Conclusion
ALFONSO allows the convenient definition of joint multi-dimensional signal fitting and modelling with flexible handling of constraints and the integration of custom model behaviours. Furthermore, MC simulations for the three case studies demonstrated superior precision of the joint fitting and modelling approach when compared to multi-step approaches.Acknowledgements
The present work was supported by the European Research Council (grant agreement No 677661, ProFatMRI and grant agreement No 875488, FatVirtualBiopsy). The authors also acknowledge research support from Philips Healthcare.References
1. Provencher SW. Estimation of metabolite concentrations from localized in-Vivo proton nmr-spectra. Magnetic Resonance in Medicine. 1993;30(6):672-679. doi:10.1002/mrm.1910300604
2. Vanhamme L, van den Boogaart A, Van Huffel S. Improved Method for Accurate and Efficient Quantification of MRS Data with Use of Prior Knowledge. Journal of Magnetic Resonance. 1997;129(1):35-43. doi:10.1006/jmre.1997.1244
3. Naressi A, Couturier C, Devos JM, et al. Java-based graphical user interface for the MRUI quantitation package. MAGMA. 2001;12(2):141. doi:10.1007/BF02668096
4. Reynolds G, Wilson M, Peet A, Arvanitis TN. An algorithm for the automated quantitation of metabolites in in vitro NMR signals. Magnetic Resonance in Medicine. 2006;56(6):1211-1219. doi:10.1002/mrm.21081
5. Wilson M, Reynolds G, Kauppinen RA, Arvanitis TN, Peet AC. A constrained least-squares approach to the automated quantitation of in vivo 1H magnetic resonance spectroscopy data. Magnetic Resonance in Medicine. 2011;65(1):1-12. doi:10.1002/mrm.22579
6. Chong DGQ, Kreis R, Bolliger CS, Boesch C, Slotboom J. Two-dimensional linear-combination model fitting of magnetic resonance spectra to define the macromolecule baseline using FiTAID, a Fitting Tool for Arrays of Interrelated Datasets. Magn Reson Mater Phy. 2011;24(3):147-164. doi:10.1007/s10334-011-0246-y
7. Oeltzschner G, Zöllner HJ, Hui SCN, et al. Osprey: Open-source processing, reconstruction & estimation of magnetic resonance spectroscopy data. Journal of Neuroscience Methods. 2020;343:108827. doi:10.1016/j.jneumeth.2020.108827
8. Near J, Harris AD, Juchem C, et al. Preprocessing, analysis and quantification in single-voxel magnetic resonance spectroscopy: experts’ consensus recommendations. NMR in Biomedicine. 2021;34(5):e4257. doi:10.1002/nbm.4257
9. Clarke WT, Stagg CJ, Jbabdi S. FSL-MRS: An end-to-end spectroscopy analysis package. Magnetic Resonance in Medicine. 2021;85(6):2950-2964. doi:10.1002/mrm.28630
10. Wilson M. spant: An R package for magnetic resonance spectroscopy analysis. Journal of Open Source Software. 2021;6(67):3646. doi:10.21105/joss.03646
11. Hernando D, Artz NS, Hamilton G, Roldan A, Reeder SB. Fully automated processing of multi-echo spectroscopy data for liver fat quantification. In: Proceedings 22. Annual Meeting International Society for Magnetic Resonance in Medicine. Vol 22. http://archive.ismrm.org/2014/2884.html; 2014:2884. http://ismrm.gitlab.io/2014/2884.html
12. Karampinos DC, Ruschke S, Dieckmeyer M, et al. Quantitative MRI and spectroscopy of bone marrow. Journal of Magnetic Resonance Imaging. 2018;47(2):332-353. doi:10.1002/jmri.25769
13. Ruschke S, Weidlich D, Wu M, Hoch A, Karampinos DC. Single-voxel short-TR multi-TI multi-TE (SHORTIE) STEAM for water–fat magnetic resonance spectroscopy. In: Proceedings International Society for Magnetic Resonance in Medicine. Vol 27. ; 2019:4230. http://archive.ismrm.org/2019/4230.html
14. Ruschke S, Syväri J, Dieckmeyer M, et al. Physiological variation of the vertebral bone marrow water T2 relaxation time. NMR in Biomedicine. 2021;34(2):e4439. doi:https://doi.org/10.1002/nbm.4439
15. Weidlich D, Honecker J, Gmach O, et al. Measuring large lipid droplet sizes by probing restricted lipid diffusion effects with diffusion-weighted MRS at 3T. Magnetic Resonance in Medicine. 2019;81(6):3427-3439. doi:10.1002/mrm.27651
16. Hamilton G, Yokoo T, Bydder M, et al. In vivo characterization of the liver fat 1H MR spectrum. NMR in Biomedicine. 2011;24(7):784-790. doi:10.1002/nbm.1622
17. Levenberg K. A Method for the Solution of Certain Non-linear Problems in Least Squares. Quarterly of Applied Mathematics. 1944;2(2):164-168.
18. Marquardt DW. An Algorithm for Least-Squares Estimation of Nonlinear Parameters. Journal of the Society for Industrial and Applied Mathematics. 1963;11(2):431-441. doi:10.1137/0111030
19. Byrd RH, Schnabel RB, Shultz GA. Approximate solution of the trust region problem by minimization over two-dimensional subspaces. Mathematical Programming. 1988;40(1):247-263. doi:10.1007/BF01580735
20. Coleman TF, Li Y. A Reflective Newton Method for Minimizing a Quadratic Function Subject to Bounds on Some of the Variables. SIAM J Optim. 1996;6(4):1040-1058. doi:10.1137/S1052623494240456
21. Branch MA, Coleman TF, Li Y. A Subspace, Interior, and Conjugate Gradient Method for Large-Scale Bound-Constrained Minimization Problems. SIAM J Sci Comput. 1999;21(1):1-23. doi:10.1137/S1064827595289108
22. Mitra PP, Sen PN, Schwartz LM. Short-time behavior of the diffusion coefficient as a geometrical probe of porous media. Physical Review B. 1993;47(14):8565-8574. doi:10.1103/PhysRevB.47.8565
23. Bydder M, Hamilton G, Yokoo T, Sirlin CB. Optimal phased-array combination for spectroscopy. Magnetic Resonance Imaging. 2008;26(6):847-850. doi:10.1016/j.mri.2008.01.050
24. Slotboom J, Boesch C, Kreis R. Versatile frequency domain fitting using time domain models and prior knowledge. Magnetic Resonance in Medicine. 1998;39(6):899-911. doi:10.1002/mrm.1910390607
25. Billeter M, Staykova DK. Rapid Multidimensional NMR: Decomposition Methods and their Applications. In: EMagRes. American Cancer Society; 2009. doi:10.1002/9780470034590.emrstm1037
Figures