2768
Mouse models of diet-induced obesity allow for optimal magnetic resonance measurements of brown adipose tissue activation and heterogeneity1Translational Imaging, Merck & Co, West Point, PA, United States
Synopsis
Robust measurement of brown and white adipose tissue physiology in response to treatment is essential in pharmaceutical research. In this work we propose for the first time that the diet-induced obesity (DIO) mouse model can be successfully used in conjunction with both Multi Gradient Echo and Fast Spin Echo based methods for sensitive characterization of changes in brown (BAT) and white adipose tissue following pharmaceutical intervention, showing more consistent responses than lean mice. Spatial heterogeneity within BAT and response dynamics are reported, relevant for future use of the model and the proposed framework in weight loss and drug characterization studies.
Introduction
The physiology and metabolism of adipose tissue has been increasingly studied in the context of multiple disease models, to improve the understanding of the underlying condition and to evaluate the effect of drug treatment. Widely used neurological compounds including several atypical antipsychotics are known to affect patients’ weight and fat metabolism. The mechanism of these interactions is not fully understood and requires further research. Additionally, the accelerating worldwide obesity epidemic increases the pressure for development of safe and effective weight-loss treatments. MRI has been previously applied to observe changes in fat fraction, perfusion and T2* relaxation (1, 2) following intervention in the adipose tissue, yet questions remain before MRI can be optimally implemented in pharmaceutical research to reveal the mechanism of drug interactions with brown adipose tissue (BAT) activation (3) and beiging of white adipose tissue (WAT) (4). In this study we show for the first time using a Multi Gradient Echo (MGE) approach that a diet induced obesity mouse model may be successfully used for this research, outperforming lean mice and allowing for quantification of spatial heterogeneity in BAT not shown in previous work. An important relationship between fat fraction, T2* and weight, highly relevant for quantification and interpretation of BAT and WAT changes, as well as their temporal dynamics, are also discussed.Methods
BF6129F1 mice subject to 16 weeks of high fat diet feeding (60% calories from fat,DIO model, n=10) or standard chow diet (lean mice, n=6) underwent 7T MRI using MGE:( TR=800ms, FA=10deg, 14xTE: 3.5-10.76ms, spacing:0.56ms, 6 averages, 192x192points, 0.7mm slice thickness,25 slices,50mm FOV) and FSE:(Fast Spin Echo, with and without fat suppression, TR/TEeff=2900/19.5ms, 3 averages, 8 echoes, same geometry as MGE) followed by IV injection of CL-316,243, a well-established fat physiology modulator (5) (1mg/kg, n=6 DIO and n=6 lean mice) or saline (n=4 DIO). Another MGE scan was performed 10 minutes post-treatment, followed by FSE and final MGE 30 minutes post-treatment. MGE FF and T2* were calculated using a multi-peak model, and FSE FF calculated as (No Suppression - Fat Suppressed)/No Suppression signal intensity ratio. Segmentation of intrascapular BAT, subcutaneous WAT and muscle separately in MGE and FSE images, and analysis was performed using custom code, with mean parameter values in regions reported. Significance was assessed with paired two-sided t-test.Results
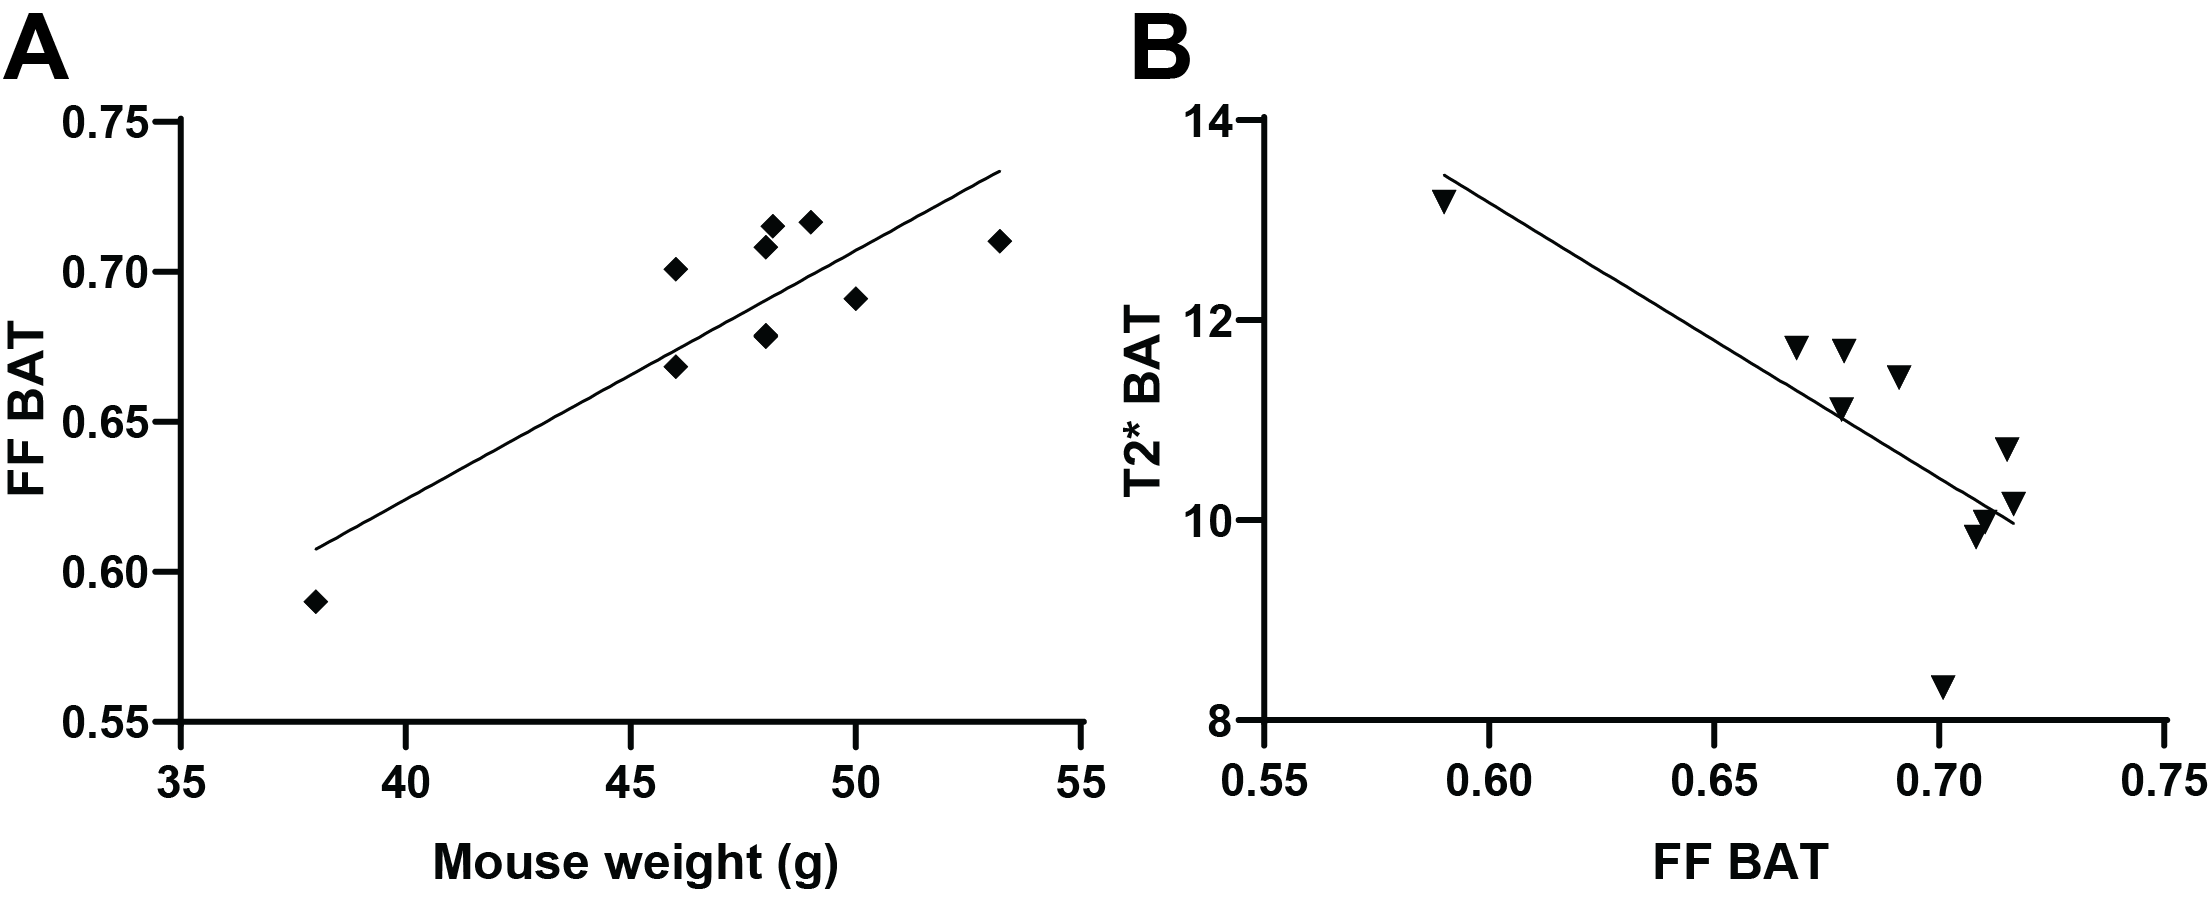
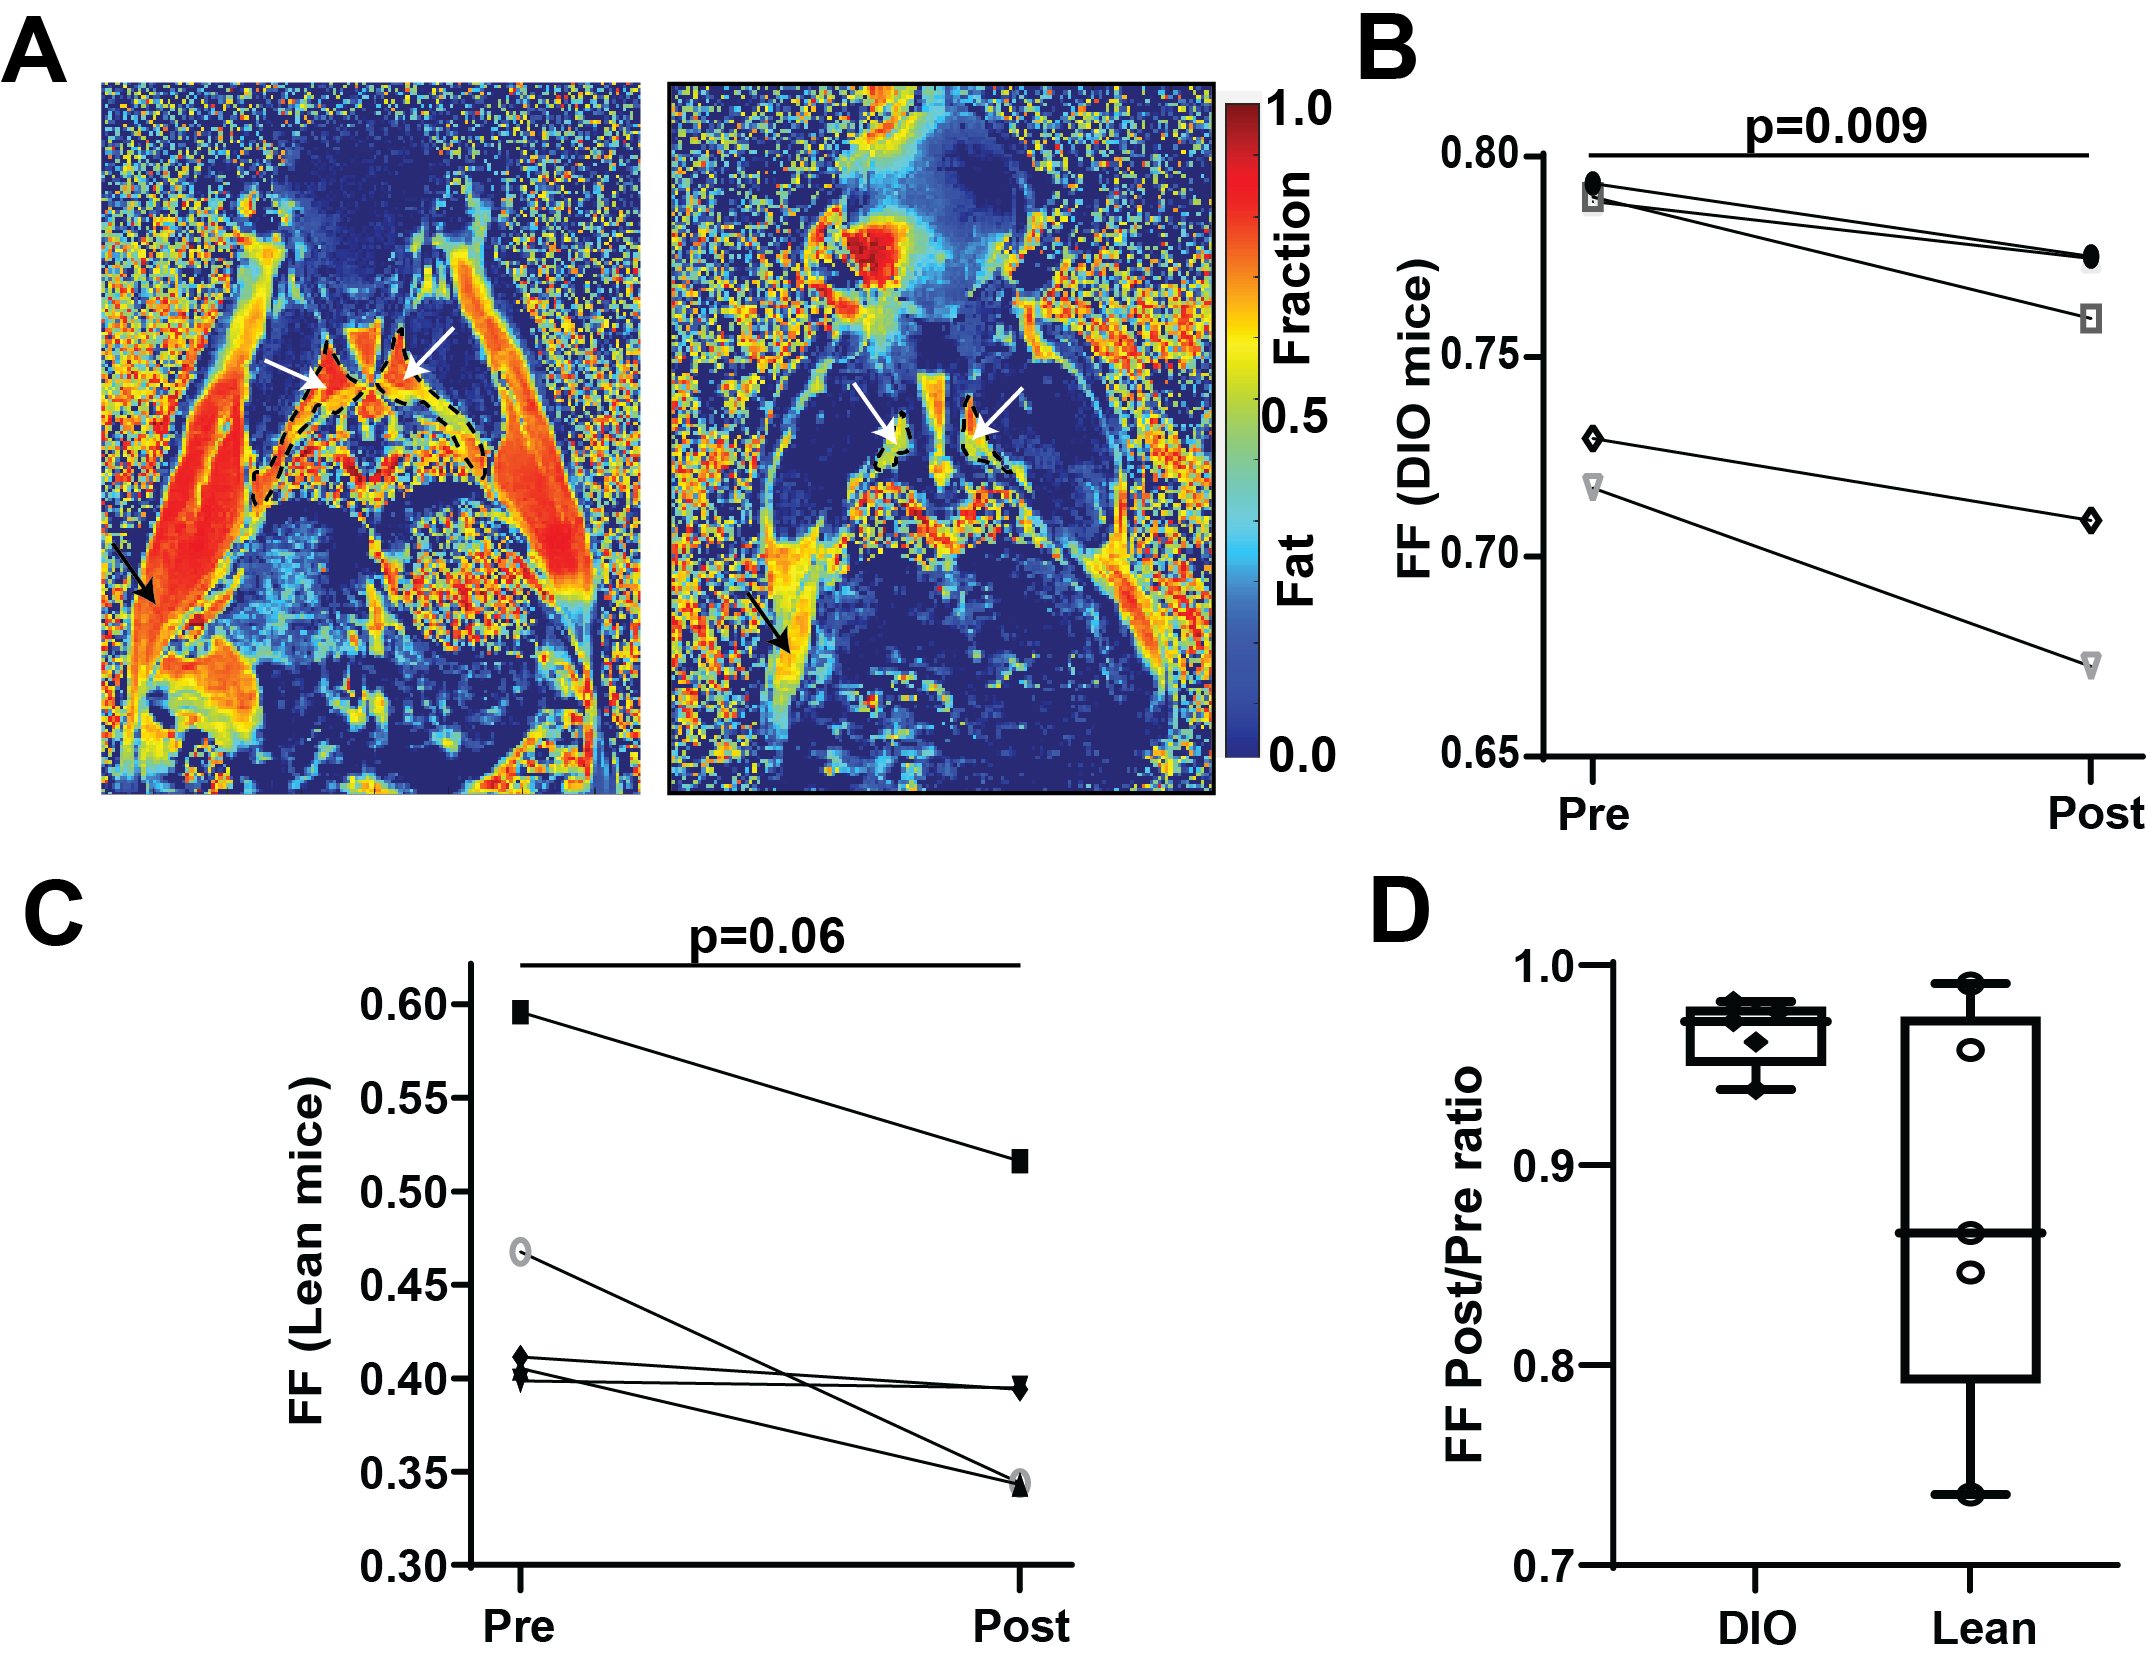
10 minutes after CL-316,243 injection, significant decrease in Fat Fraction (MGE FF=0.672±0.009vs.0.702±0.008, p=0.0011) and increase in T2* (13.0±0.4vs.10.6±0.3ms, p=0.003) was observed in the BAT of the DIO model mice (Figure 1). These changes were maintained 20 minutes later (FF 0.683±0.011, p=0.010, T2* 13.0±0.4). Interestingly, a small but consistent and significant decrease in FF was observed also in the subcutaneous WAT at 30 minutes post treatment (0.867±0.002, p=0.003), but not immediately (0.872±0.003vs.0.878±0.002, p=0.18), suggesting a different timescale of response in WAT compared to BAT. No T2* changes were observed in WAT, and no FF or T2* changes were seen in skeletal muscle (p>0.23). Saline injection in a control group showed no significant changes in any of the considered parameters and regions (p>0.37). Notably, there was a significant correlation between the baseline BAT FF values and both T2* (Pearson r=-0.78,p=0.008) and mouse weight (r=0.86,p=0.0014, Figure 2).Spatial comparison between values in outer rim and inside core of the BAT revealed that most of the observed response to treatment was confined to the outer 0.5mm thick edge of the BAT (p=0.009 FF and p=0.005 T2*), with values in the middle of BAT depot remaining relatively stable (p=0.18 and 0.03 respectively). Independent FF measurements using CHESS-based fat suppression validated the FF decrease observed with MGE (FF 0.738±0.018vs.0.75±0.02, p=0.009, Figure 3). Interestingly, the same treatment in a cohort of lean mice did not produce a significant T2* response in the BAT (p>0.34), suggesting the DIO mice may be more susceptible to pharmacological BAT activation. CHESS-based fat fraction measurement showed a near-significant decrease in BAT fat content, weaker than in the DIO mice (FF 0.45±0.02vs. 0.41±0.02, p=0.06, Figure 3). Intrascapular BAT depot volumes were drastically higher in DIO mice (85±13vs.36±2mm3, p=0.004) even given the difference in weight (48.6±0.9vs.24.7±0.8g) to lean animals.
Discussion
MRI provides powerful insight into adipose tissue physiology, potentially relevant to other applications in drug development. This study presented above may help optimize this research and address important confounders. We show that the diet induced obesity mouse model, widely used in preclinical research but not previously described in the above context, can be successfully used for measurement of BAT activation and white fat beiging, outperforming standard lean mice and offering significantly higher BAT volumes, providing a potential alternative to using rats. Conversely, we highlight that mouse weight is an important factor to be controlled, as it appears to correlate with BAT fat fraction. This is relevant in studies involving weight loss, where additional investigation is required to separate the different causes of FF changes. Spatial rim vs.core heterogeneity in BAT, reported here for the first time, may also be relevant to understand the effect of treatment on the region. Future work will elucidate the biological meaning of this spatial heterogeneity as well as observed temporal differences in response between tissues and apply this framework to drug characterization.Acknowledgements
No acknowledgement found.References
1. Yaligar J, Verma SK, Gopalan V, Anantharaj R, Thu Le GT, Kaur K, et al. Dynamic contrast-enhanced MRI of brown and beige adipose tissues. Magnetic resonance in medicine. 2020;84(1).
2. Panagia M, Chen YC, Chen HH, Ernande L, Chen C, Chao W, et al. Functional and anatomical characterization of brown adipose tissue in heart failure with blood oxygen level dependent magnetic resonance. NMR in biomedicine. 2016;29(7).
3. Cypess AM, Lehman S, Williams G, Tal I, Rodman D, Goldfine AB, et al. Identification and importance of brown adipose tissue in adult humans. The New England journal of medicine. 2009;360(15).
4. Wu J, Boström P, Sparks LM, Ye L, Choi JH, Giang AH, et al. Beige adipocytes are a distinct type of thermogenic fat cell in mouse and human. Cell. 2012;150(2).
5. Himms-Hagen J, Cui J, Danforth E, Taatjes DJ, Lang SS, Waters BL, et al. Effect of CL-316,243, a thermogenic beta 3-agonist, on energy balance and brown and white adipose tissues in rats. The American journal of physiology. 1994;266(4 Pt 2).
Figures