2767
The over-expression of human hydrolase hMTH1 modulates metabolism and fat composition in mice exposed to high fat diet: a MRI and MRS study1Core Facilities, Istituto Superiore di Sanita', Rome, Italy, 2Oncology and Molecular Medicine Dept, Istituto Superiore di Sanita', Rome, Italy, 3Environmental and Health Dept, Istituto Superiore di Sanita', Rome, Italy
Synopsis
Oxidative stress is implicated in cancer, neurodegeneration and aging. hMTH1 is a hydrolase able to remove oxidized precursors from nucleotide’s pool, thus avoiding oxidative nucleic acids damage. Overexpression of hMTH1 in mice is protective against oxidative damage, neurodegeneration and prolongs life span. Our study showed that the overexpression of hMTH1 in mice fed with high fat diet (HFD), a dietary regimen linked to inflammation, is associated with increased brown interscapular fat (linked to protection from obesity) and with reduced perivesical fat volume (indicator of poor cardiovascular outcomes) up to four weeks. These effects seem to be reversed by prolonging HFD.
Introduction
The role of the oxidative stress in the pathogenesis of cancer, neurodegeneration and aging is well established. The human MutT homologue (hMTH1) is a hydrolase able to protect nucleic acids from oxidative damage, by avoiding the incorporation of oxidized precursors in both DNA and RNA. Transgenic mice, which overexpress the human MTH1 gene (hMTH1‐Tg) are protected from neurodegeneration and motor impairment1 and are characterized by a decreased oxidative DNA damage, a prolonged life-span and an enhanced exploratory behavior.2 It has been shown that high fat diet is one of the most frequent environmental trigger, able to cause chronic inflammation which characterizes obesity and metabolic syndrome.Aims
Aims of this study were to understand if the the oxidative DNA damage protection mediated by the over-expression of hMTH1 is able to counteract the metabolic alterations and the inflammation induced by the exposure to a high-fat diet (HFD, 45% of fat) for 33 weeks.Methods
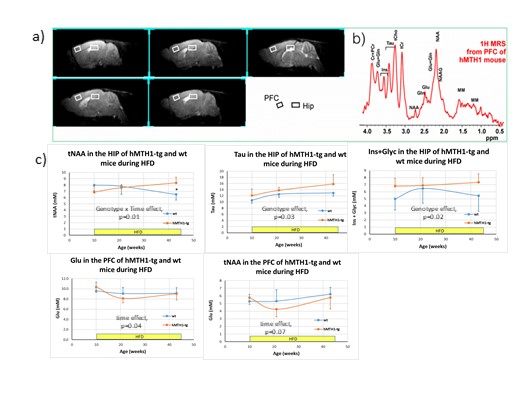
Male C57bl6 mice 10 wk old, wild-type (wt) and hMTH1-Tg, were fed with HFD for 33 weeks (two groups of 5 mice each). Body weight, oxidative DNA damage/repair (by Single Cell Gel Electrophoresis assay) and other clinic parameters were measured. At 4, 11 (or 16), 22 and 33 weeks of HFD feeding and two months after the end the HFD exposure (recovery time), animals underwent to MRI and MRS. Brain metabolism, interscapular brown fat and liver fat were assessed by MRS. The volume of perivesical fat was assessed by MRI. Experiments were performed on a VARIAN Inova system operating at 4.7T with a transmitter volume RF coil actively decoupled from the receiver surface coil (RAPID Biomedical, Rimpar, Germany). 1H localised MR spectra were collected from the hippocampus (HIP) and prefrontal cortex (PFC) using a PRESS sequence, according to a quantitative protocol.3 A STEAM sequence was used in the interscapular brown fat and liver for water to lipid ratio determination. T1-weighted MRI was performed to quantify the volume of visceral fat depot (a risk factor for metabolic dysfunction) in the four different mice groups. Repeated measurements ANOVA was used for statistical comparisons (significance at p<0.05). Serum Metabolomics was carried out on Bruker Avance operating at 9.4 T spectrometer, by using standard presaturation pulse sequence and spin echo Carr-Purcell-Meiboom-Gill 1D sequence (CPMG) according to Beckonert4 protocol on intact serum.Results
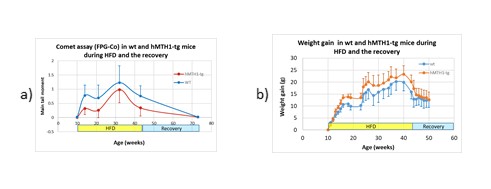
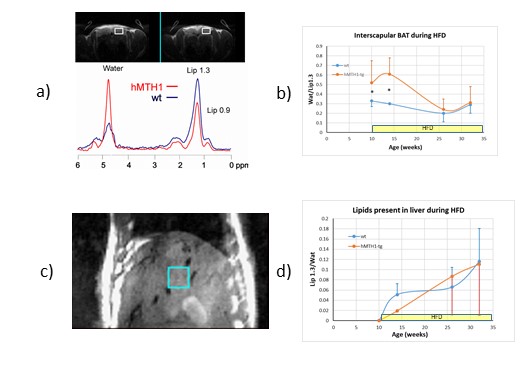
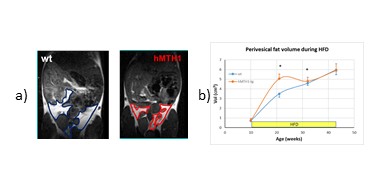
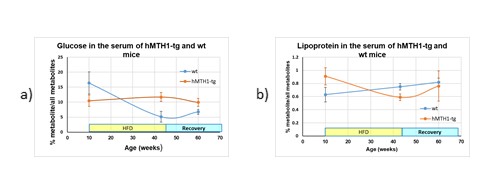
During HFD regimen, a significant increase in the accumulation of oxidative DNA damage has been observed in wt mice (repeated measurements ANOVA: genotype effect, p=0.02), as shown in Figure 1a). Notably, hMTH1-Tg mice resulted to be protected both in basal and HFD conditions, albeit a comparable weight gain has been observed (Figure 1b). Alterations in brain metabolite concentrations have been detected in both PFC and HIP at basal level and during the HFD regimen. Quantitative results are shown in Figure 2. In the interscapular fat we observed an increase in the water/lipid signals ratio (which corresponds to increased brown adipose tissue, BAT) in the hMTH1-tg mice group which is maintained up to 4 weeks of HFD regimen (figure 3a and b). 1H MRS of the liver revealed a reduced amount of fat for the hMTH1-tg mice after 4 weeks of HFD stimulus (p<0.05) which is no longer observed at late times, as shown in Figure 3c and d. T1-weighted MRI of the abdomen revealed a slightly reduced amount of visceral fat for the hMTH1-tg mice at basal level but an increase in the hMTH1-tg animals at late stages after the beginning of the HFD stimulus, as shown in Figure 4a and b. Analyses at the end of HFD (33 weeks) and during the recovery time are in progress. Metabolomics analyses on serum samples showed that the overexpression of hMHT1 induced a tight control of glucose and lipid homeostasis metabolism as compared to wt-mice in HFD (figure 5a and b). In particular, we found significant changes in glucose, and low-density lipoprotein/very low density lipoprotein (LDL/VLDL) signals following HFD in wt mice. Despite the stimulation of a high-fat diet, MTH1 mice are not able to alter blood glucose levels, nor to increase the levels of VLDL / LDL in circulation.Discussion and conclusions
Differences have been detected between wt and hMTH1-Tg mice before the beginning of HFD, suggesting a crosstalk between genomic instability and metabolic dysfunction. Brain metabolism alteration highlights a direct effect on brain functionality. In spite of similar body weight increase, nuclear oxidative DNA damage is lower in hMTH1-Tg than in wt at all time points, while adipose organ extension and composition maintain the basal differences between wt and hMTH1-Tg mice only up to 4 weeks of oxidative stimulus. The protective role of hMTH1 against oxidative damage is associated with an increase in BAT (which may provide protection from obesity5) and with a reduced abdominal perivesical fat volume (which is considered an independent indicator of poor cardiovascular outcomes6). The protective effect observed in the hMTH1 mice up to 4 weeks seems to be reversed by a prolonged HFD exposition, suggesting a not-obvious link between HFD and oxidative damage modulation by hMTH1.Acknowledgements
We thank the Italian National Institute of Health for financial supportReferences
1. De Luca G et al PLoS Genet 2008;4:e1000266.
2. De Luca G et al Aging Cell 2013;12:695-705.
3. Canese R et al NMR Biomed 2012;25:632-642.
4. Beckonert O et al. Nat Protoc 2007; 2:2692–2703
5. Matsuita M et al, International Journal of Obesity 2014; 38,812–817.
6. Powell-Wiley et al, Circulation 2021;43:e984.
Figures