2765
Comparison of Centralized R2* Mapping Algorithms to Vendor R2* Mapping in a Multi-Center, Multi-Vendor Liver Iron Overload Study1Radiology, University of Wisconsin-Madison, Madison, WI, United States, 2Medical Physics, University of Wisconsin-Madison, Madison, WI, United States, 3Radiology, University of Texas Southwestern Medical Center, Dallas, TX, United States, 4Radiology, The John Hopkins University, Baltimore, MD, United States, 5Diagnostic and Interventional Radiology, Technical University of Munich, Munich, Germany, 6Medicine, University of Wisconsin-Madison, Madison, WI, United States, 7Pediatrics - Hematology & Oncology, Stanford University, Palo Alto, CA, United States, 8Advanced Imaging Research Center, University of Texas Southwestern Medical Center, Dallas, TX, United States, 9Radiology, Stanford University, Palo Alto, CA, United States, 10Biomedical Engineering, University of Wisconsin-Madison, Madison, WI, United States, 11Emergency Medicine, University of Wisconsin-Madison, Madison, WI, United States
Synopsis
Recently, a multi-center, multi-vendor study evaluating the reproducibility of R2* vs liver iron concentration (LIC) calibrations was completed, based on a centralized offline R2* reconstruction. However, the relationship between the offline reconstructed R2* maps and the online vendor-provided R2* maps remains unknown. In this work, subjects were recruited at four centers and imaged using 1.5T and 3T MRI scanners from three vendors. R2* maps were obtained using various offline reconstructions and compared to the online vendor reconstructions to determine R2* ranges of agreement. This may enable improved clinical interpretation of vendor R2* measurements using emerging offline R2*-LIC calibrations.
Introduction
R2*-based quantification of liver iron concentration (LIC) has demonstrated promise for the assessment of iron overload.1-3 Recently, a multi-center, multi-vendor study for the evaluation of the reproducibility of R2*-based LIC quantification at 1.5T and 3T was completed.4 This study, which relied on a centralized offline complex hybrid R2* mapping algorithm,5 reported R2*-LIC calibrations and demonstrated outstanding reproducibility across centers and vendors at both field strengths. However, the relationship between the offline reconstructed R2* maps and online vendor-provided R2* maps remains unknown. Therefore, the purpose of this work was to compare R2* measurements from vendor and offline reconstructions and to determine ranges of agreement.Methods
Subjects: At four centers, subjects with known or suspected liver iron overload were recruited for this prospective IRB-approved study, with written informed consent.MR acquisition: Subjects underwent liver MRI exams at 1.5T and 3T (2.89T for Site 4) in a single visit using scanners from three vendors (GE (Sites 1 & 2), Philips (Site 3), and Siemens (Site 4); see Ref 4 for details about specific platforms).4 Multiecho gradient-echo data was acquired for R2* mapping using monopolar readout gradients and the following parameters: slice thickness=8mm, flip angle=12°(1.5T)/9°(3T), echoes=6, TE1=1.2ms, ΔTE=2ms(1.5T)/1ms(3T). Additionally, LIC was measured using the FDA-approved R2-based FerriScan technique (Resonance Health) obtained at 1.5T.6
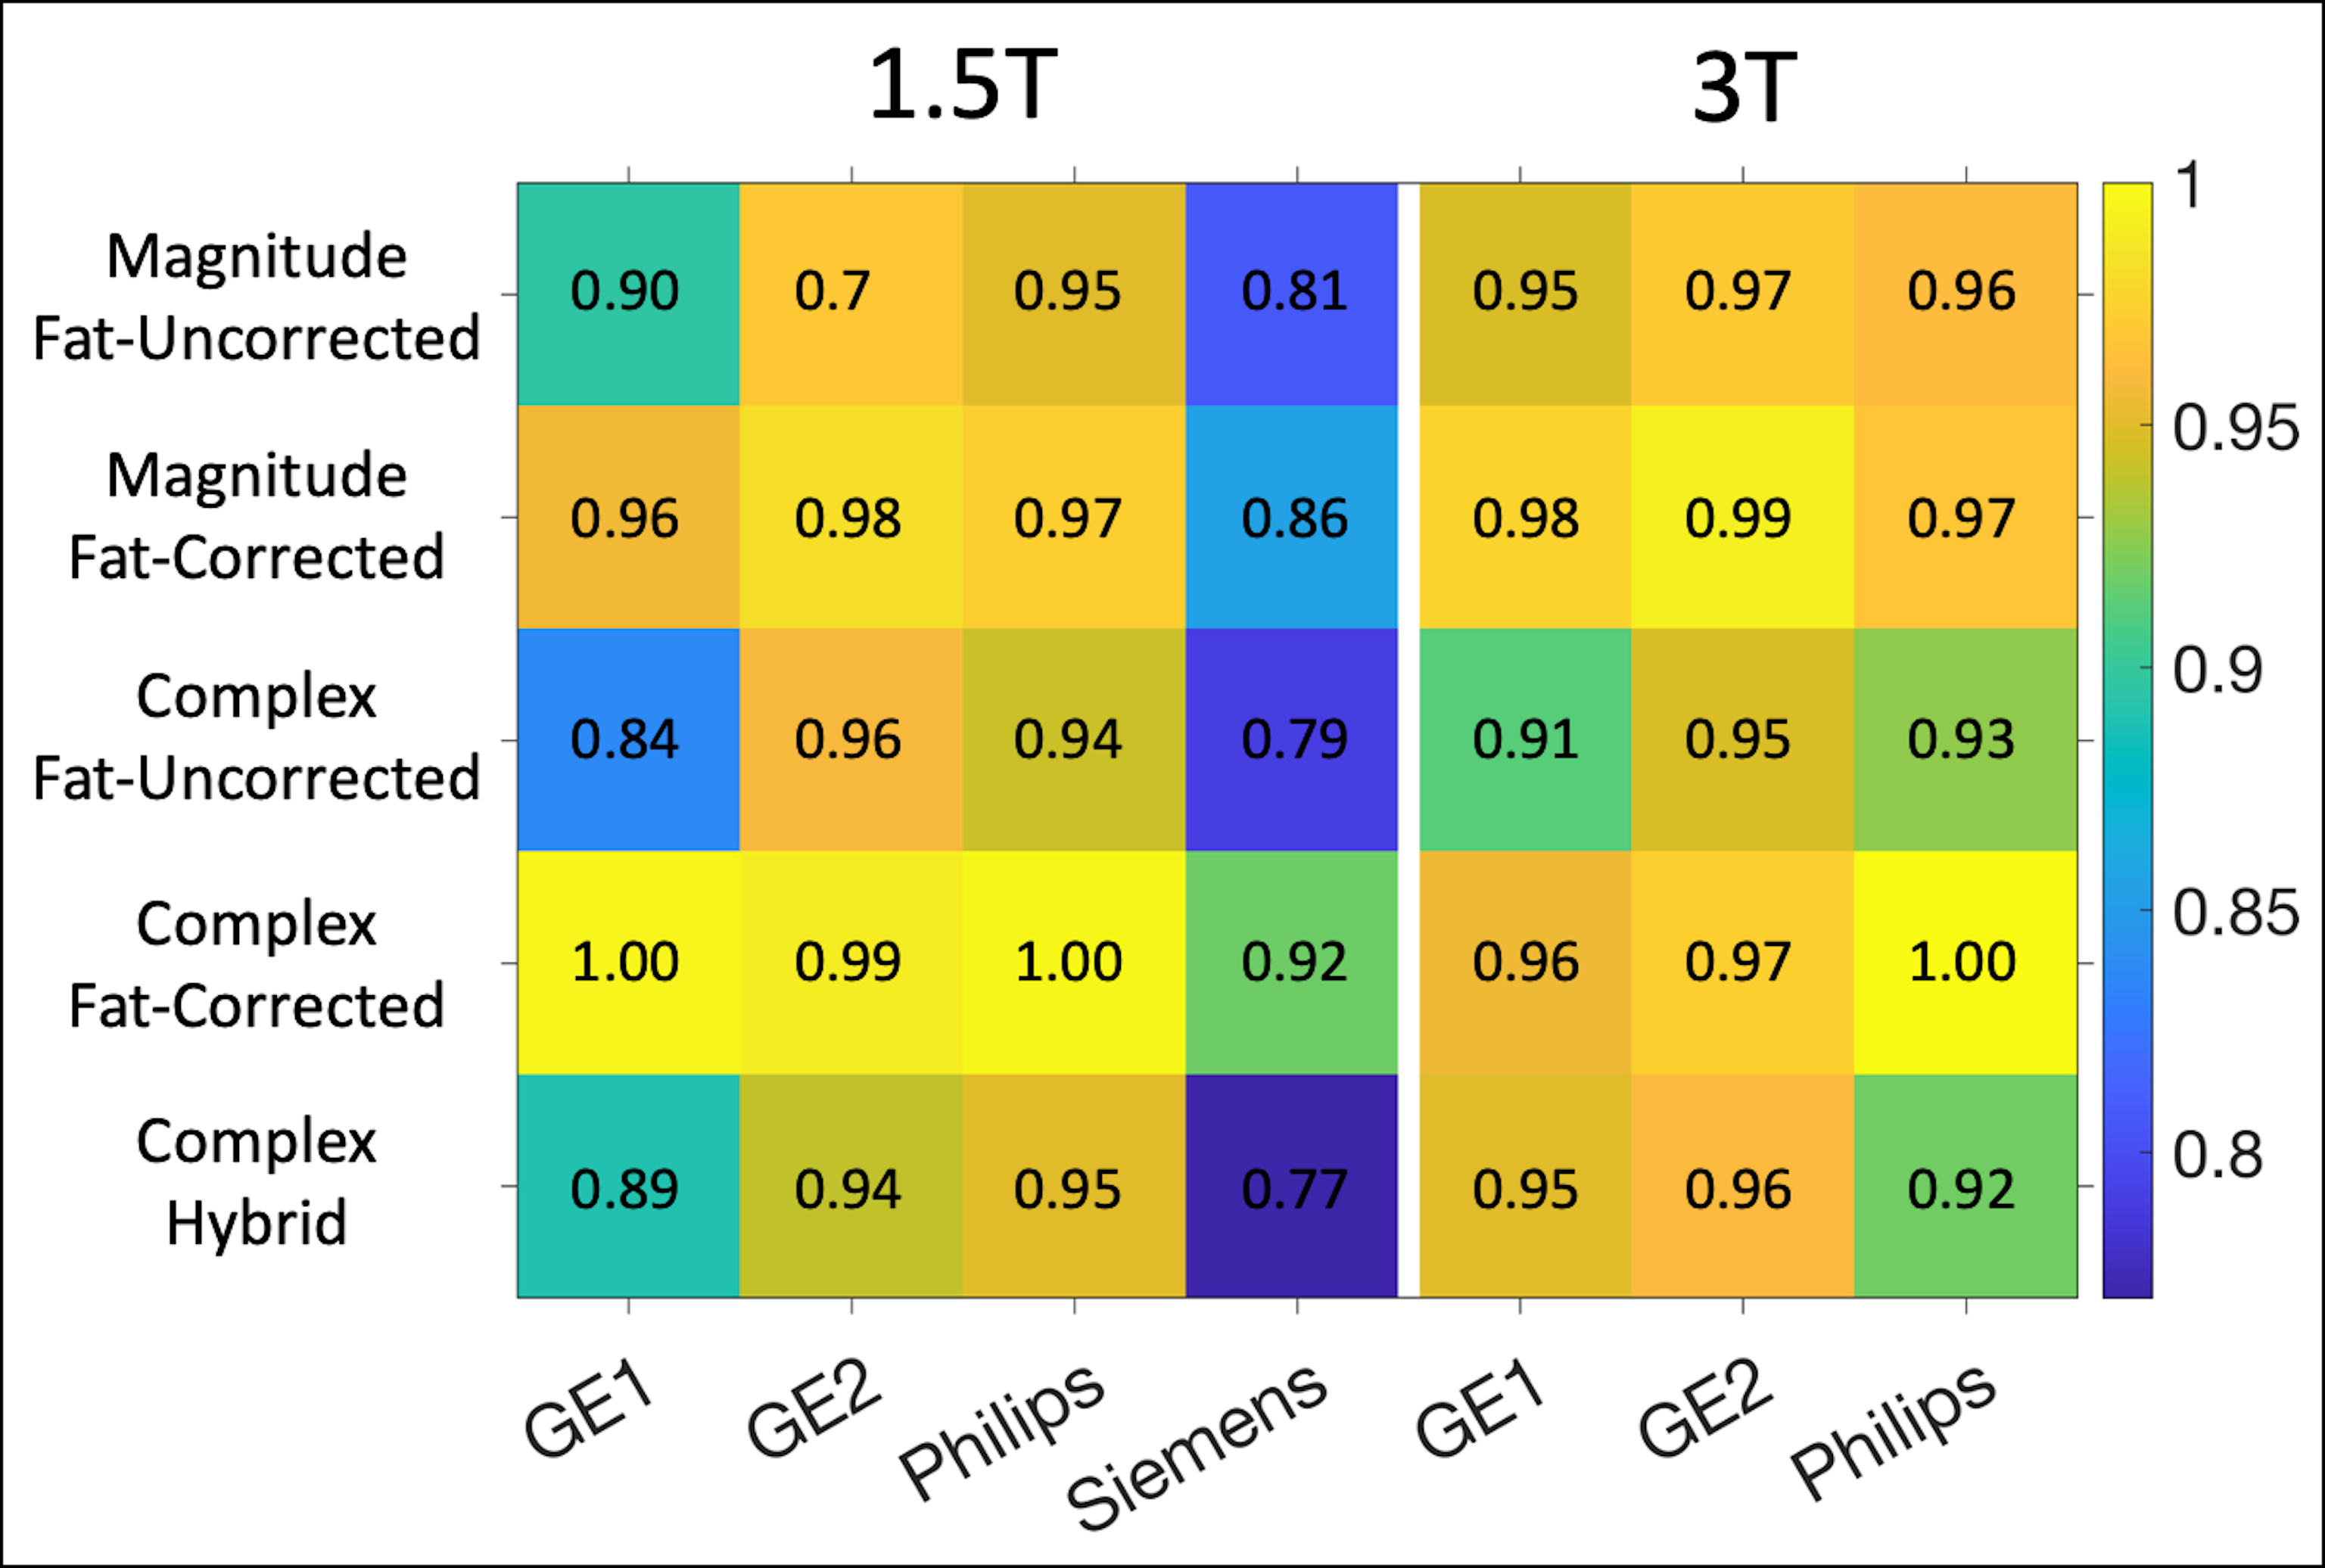
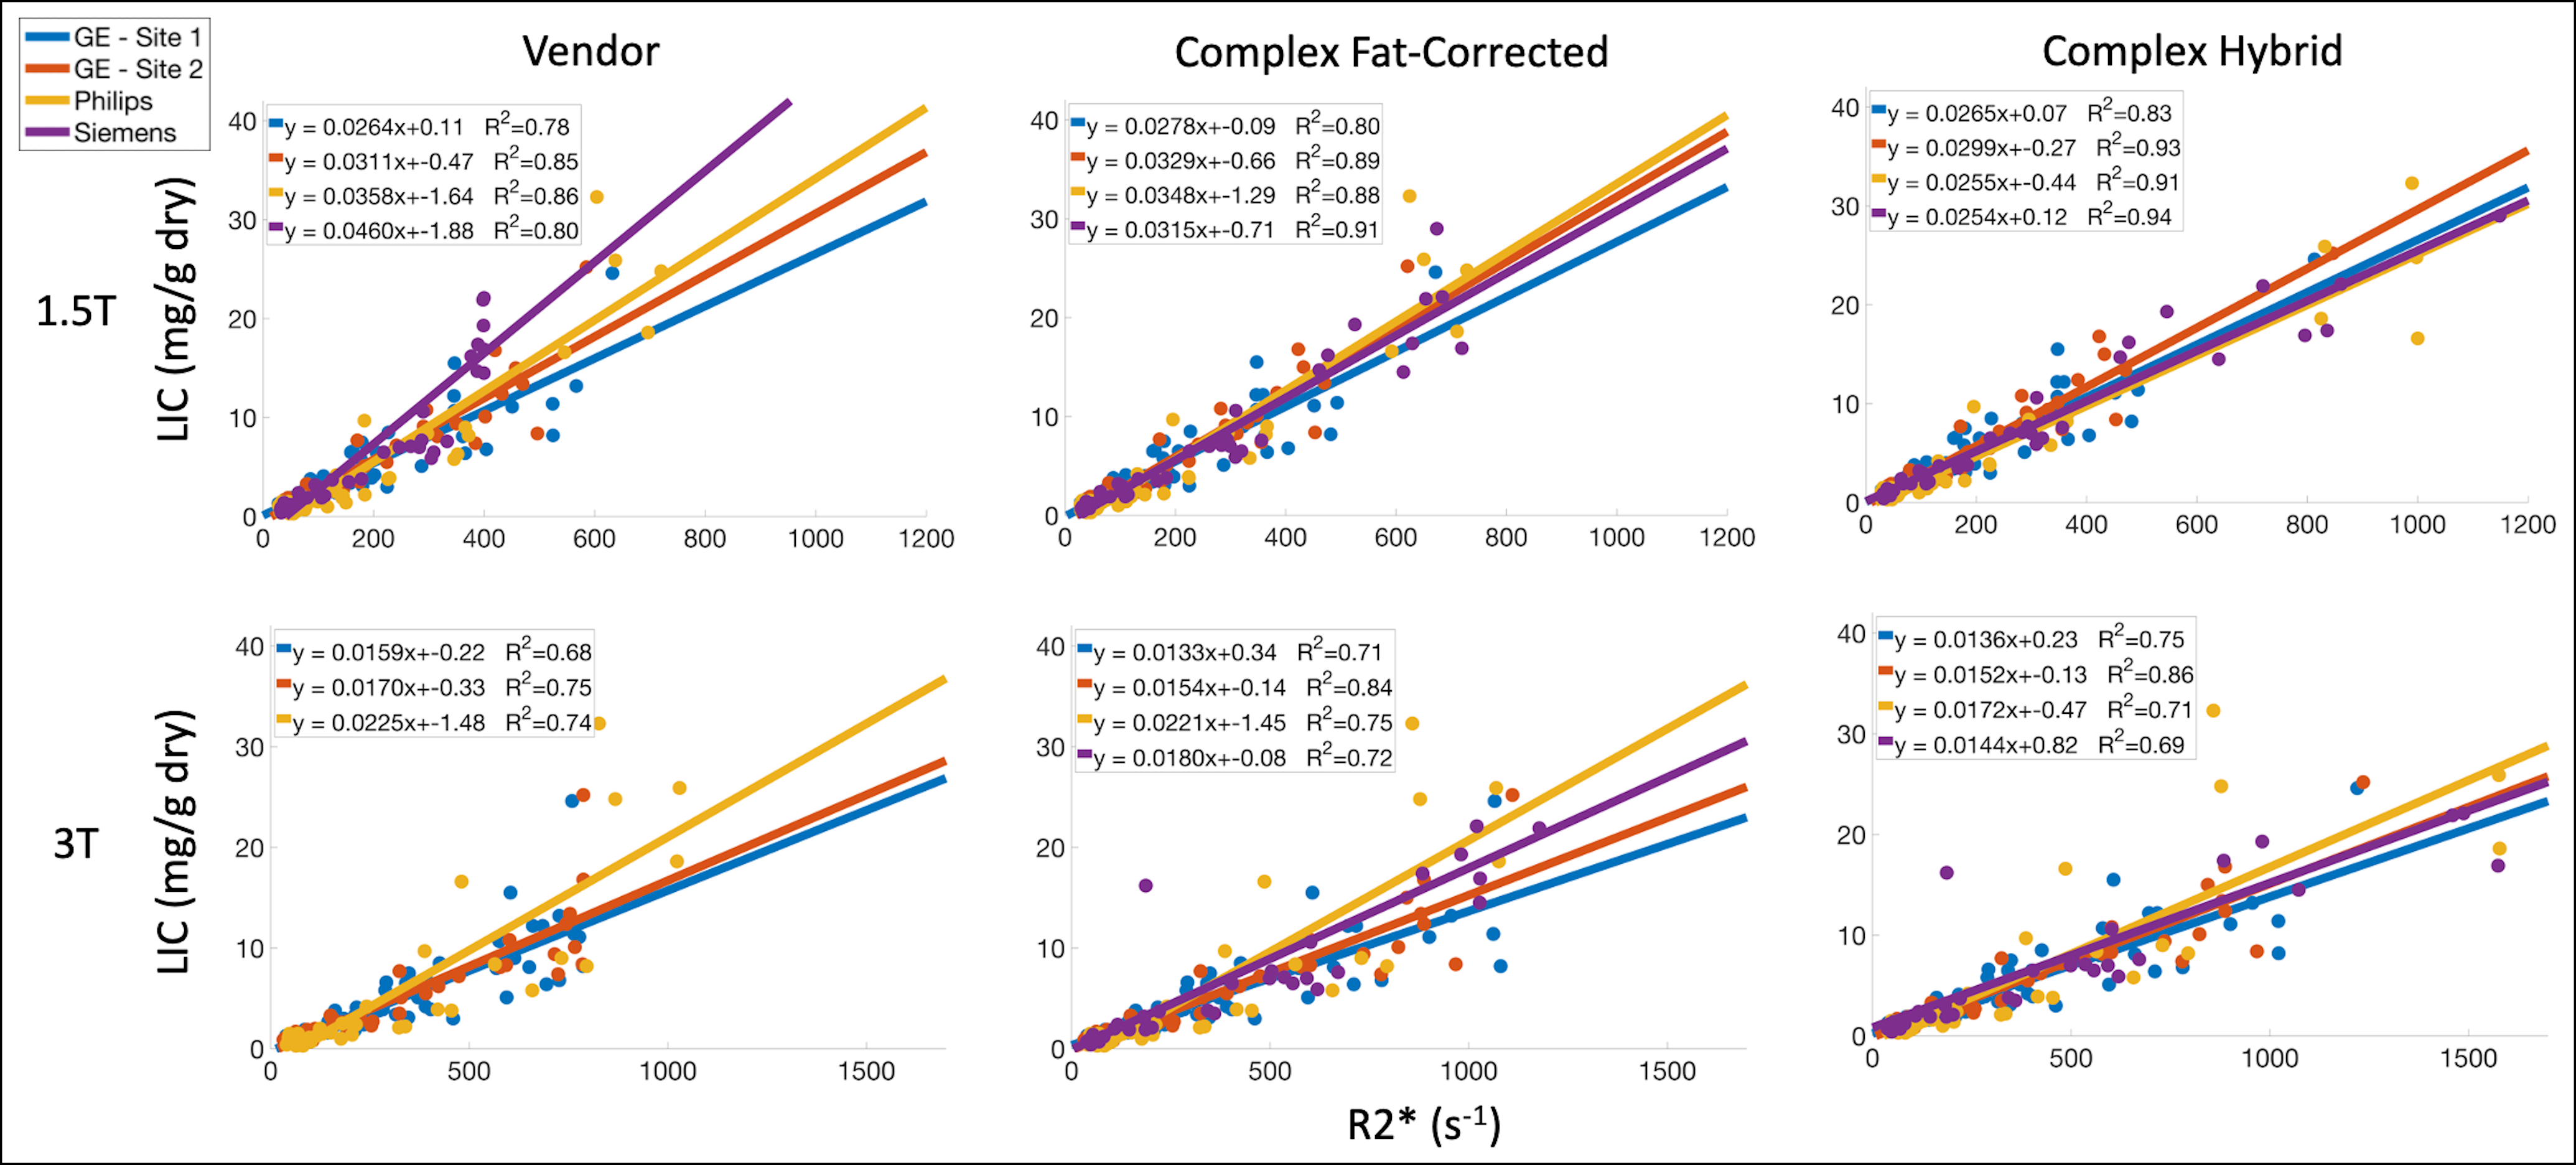
Data analysis: Voxelwise R2* mapping was performed using five centralized (analyzed at a single center) offline reconstructions: magnitude fat-uncorrected, magnitude fat-corrected, complex fat-uncorrected (CN), complex fat-corrected (CF), and complex hybrid (CH; i.e., CF below 500 and 1000 s-1 at 1.5T and 3T, respectively, and CN above).5 R2* measurements were obtained for each offline reconstruction by calculating average values measured in four ROIs (one in each right liver lobe Couinaud segment). R2* measurements were also obtained for online vendor reconstructions for the same ROIs. Linear regression was performed to compare offline and vendor R2* measurements, as well as to determine R2*-LIC calibrations.
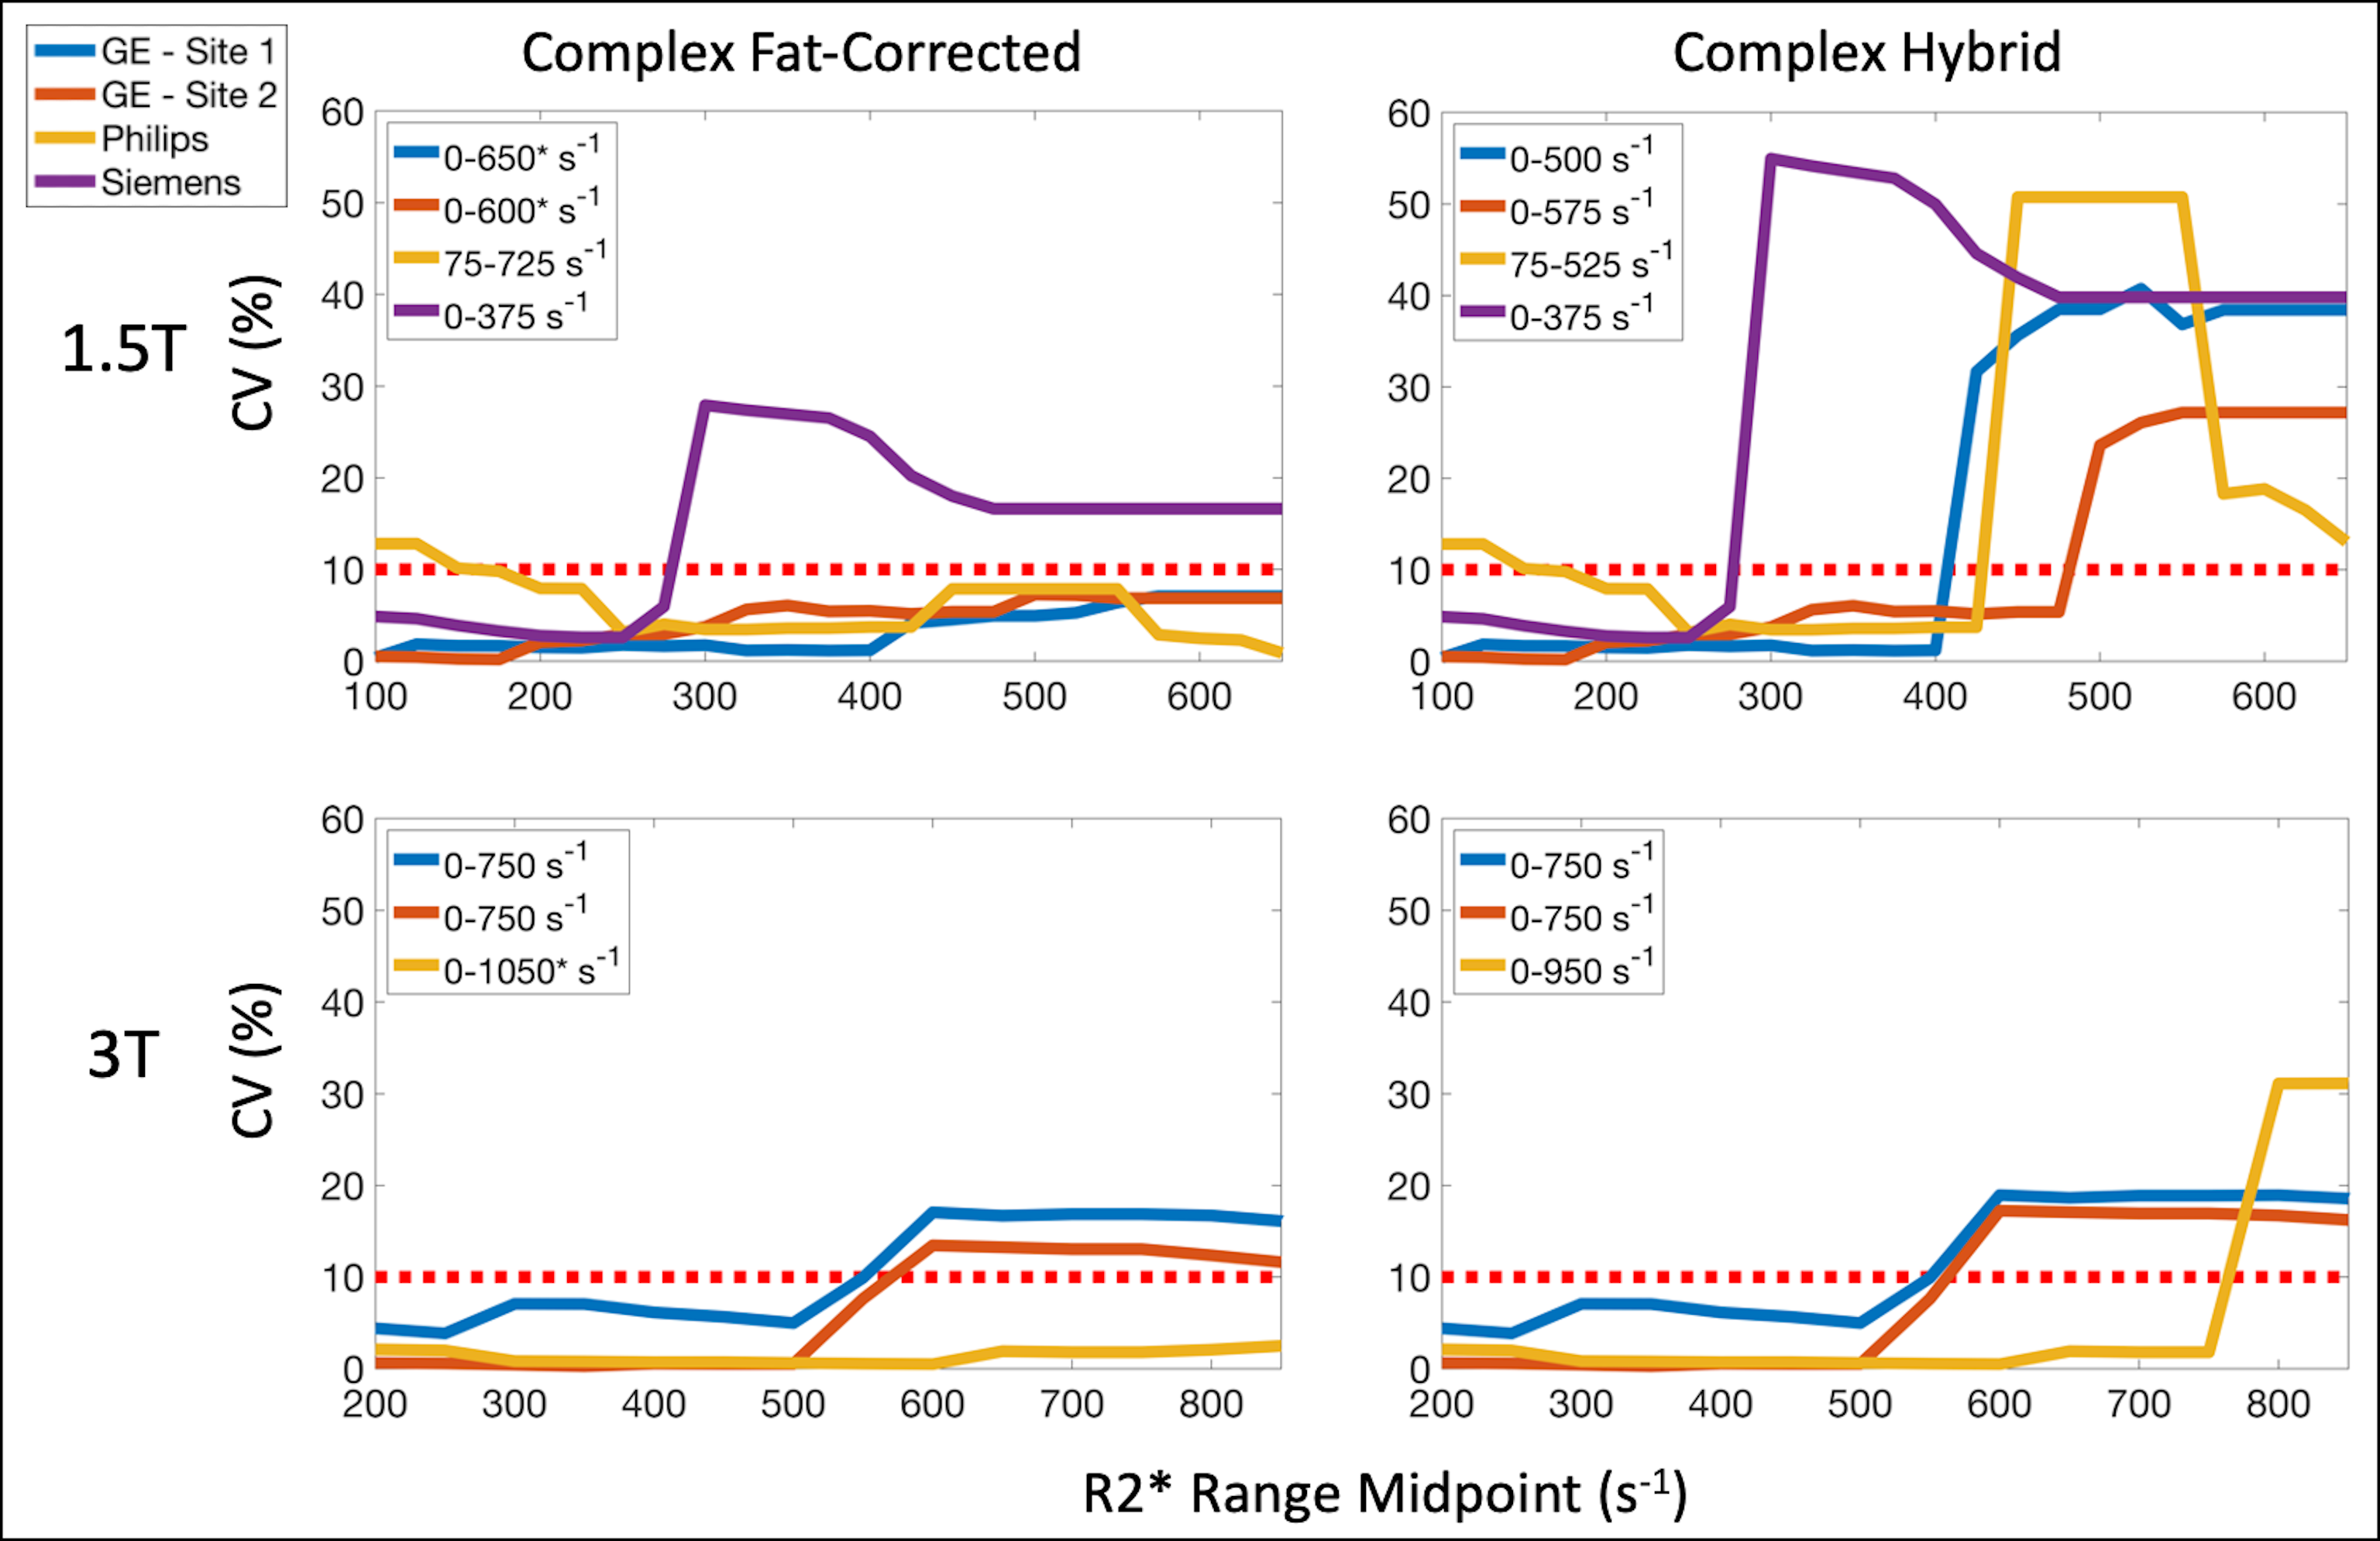
To determine R2* ranges of agreement between vendor and offline reconstructions, coefficient of variation (CV) was evaluated as a function of vendor R2* range. Initially, CV was calculated for subjects with vendor R2* in the range of 0-200 and 0-400 s-1 at 1.5T and 3T, respectively. This range was then progressively shifted by 25 and 50 s-1 at 1.5T and 3T, respectively, and CV was re-calculated for each new range. R2* ranges of agreement were defined as the outer limits of the R2* ranges where CV < 10%. Bland-Altman analysis to compare vendor and offline R2* measurements within the R2* ranges of agreement was also performed.
Results
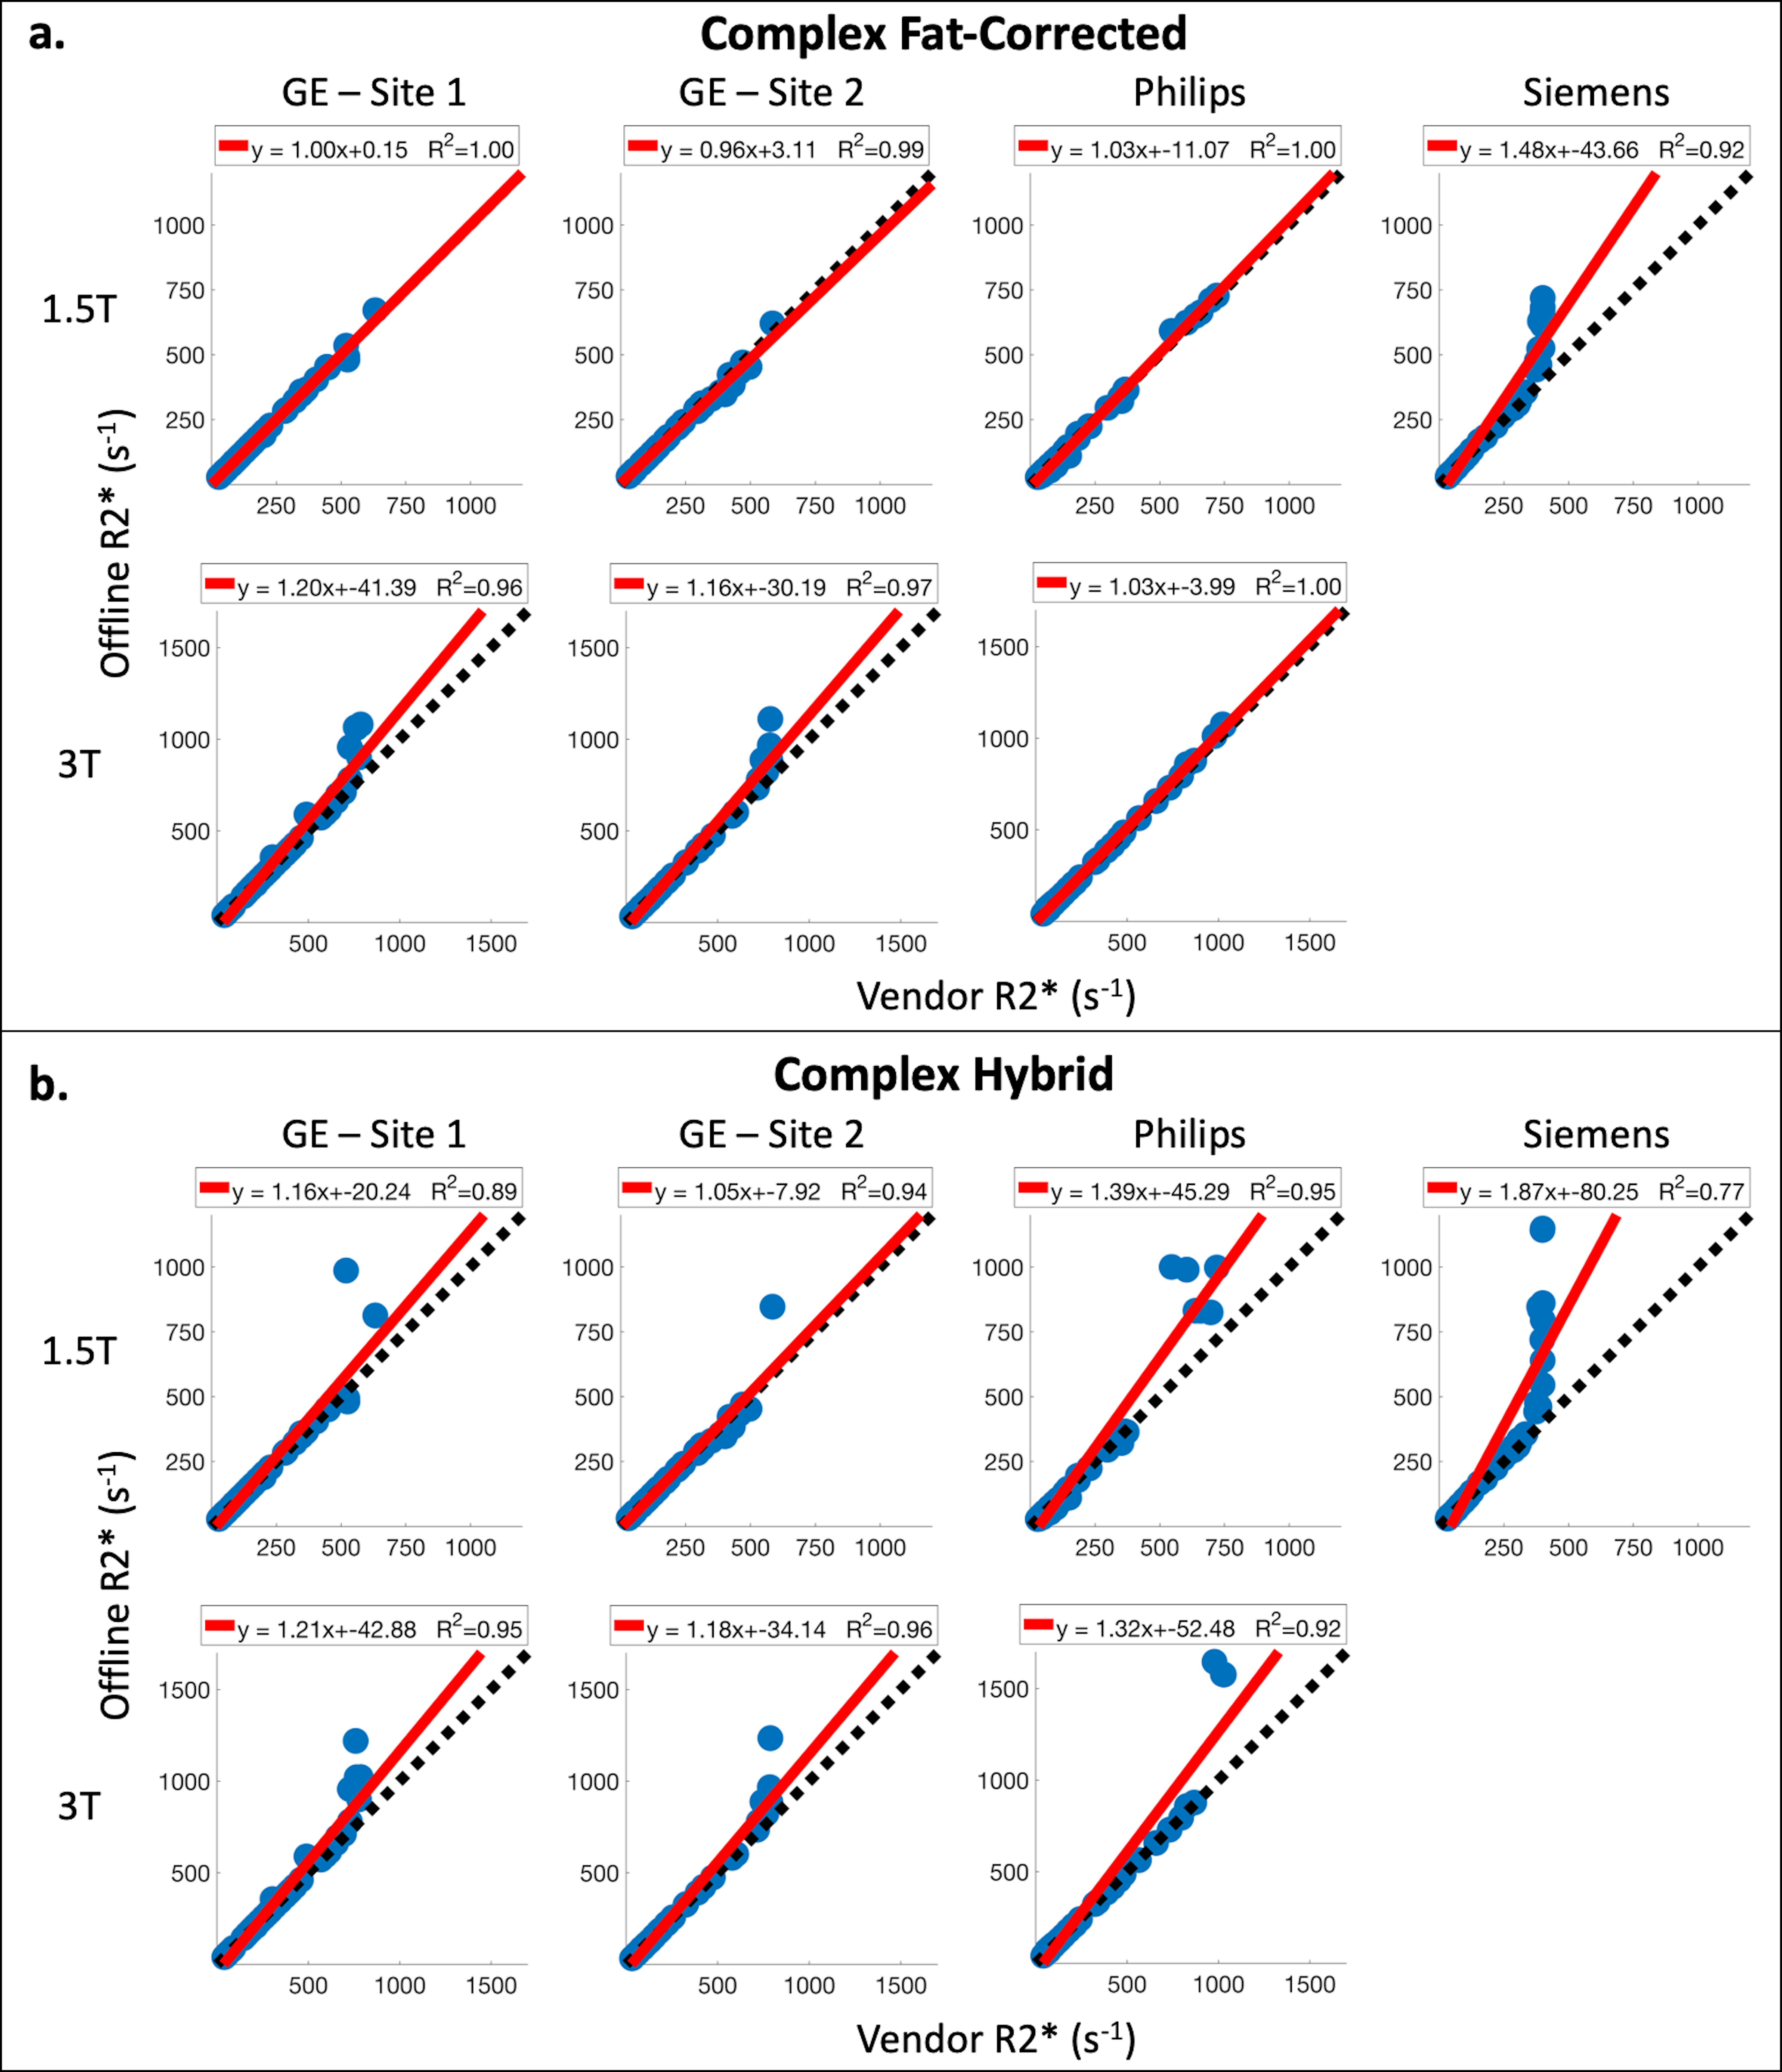
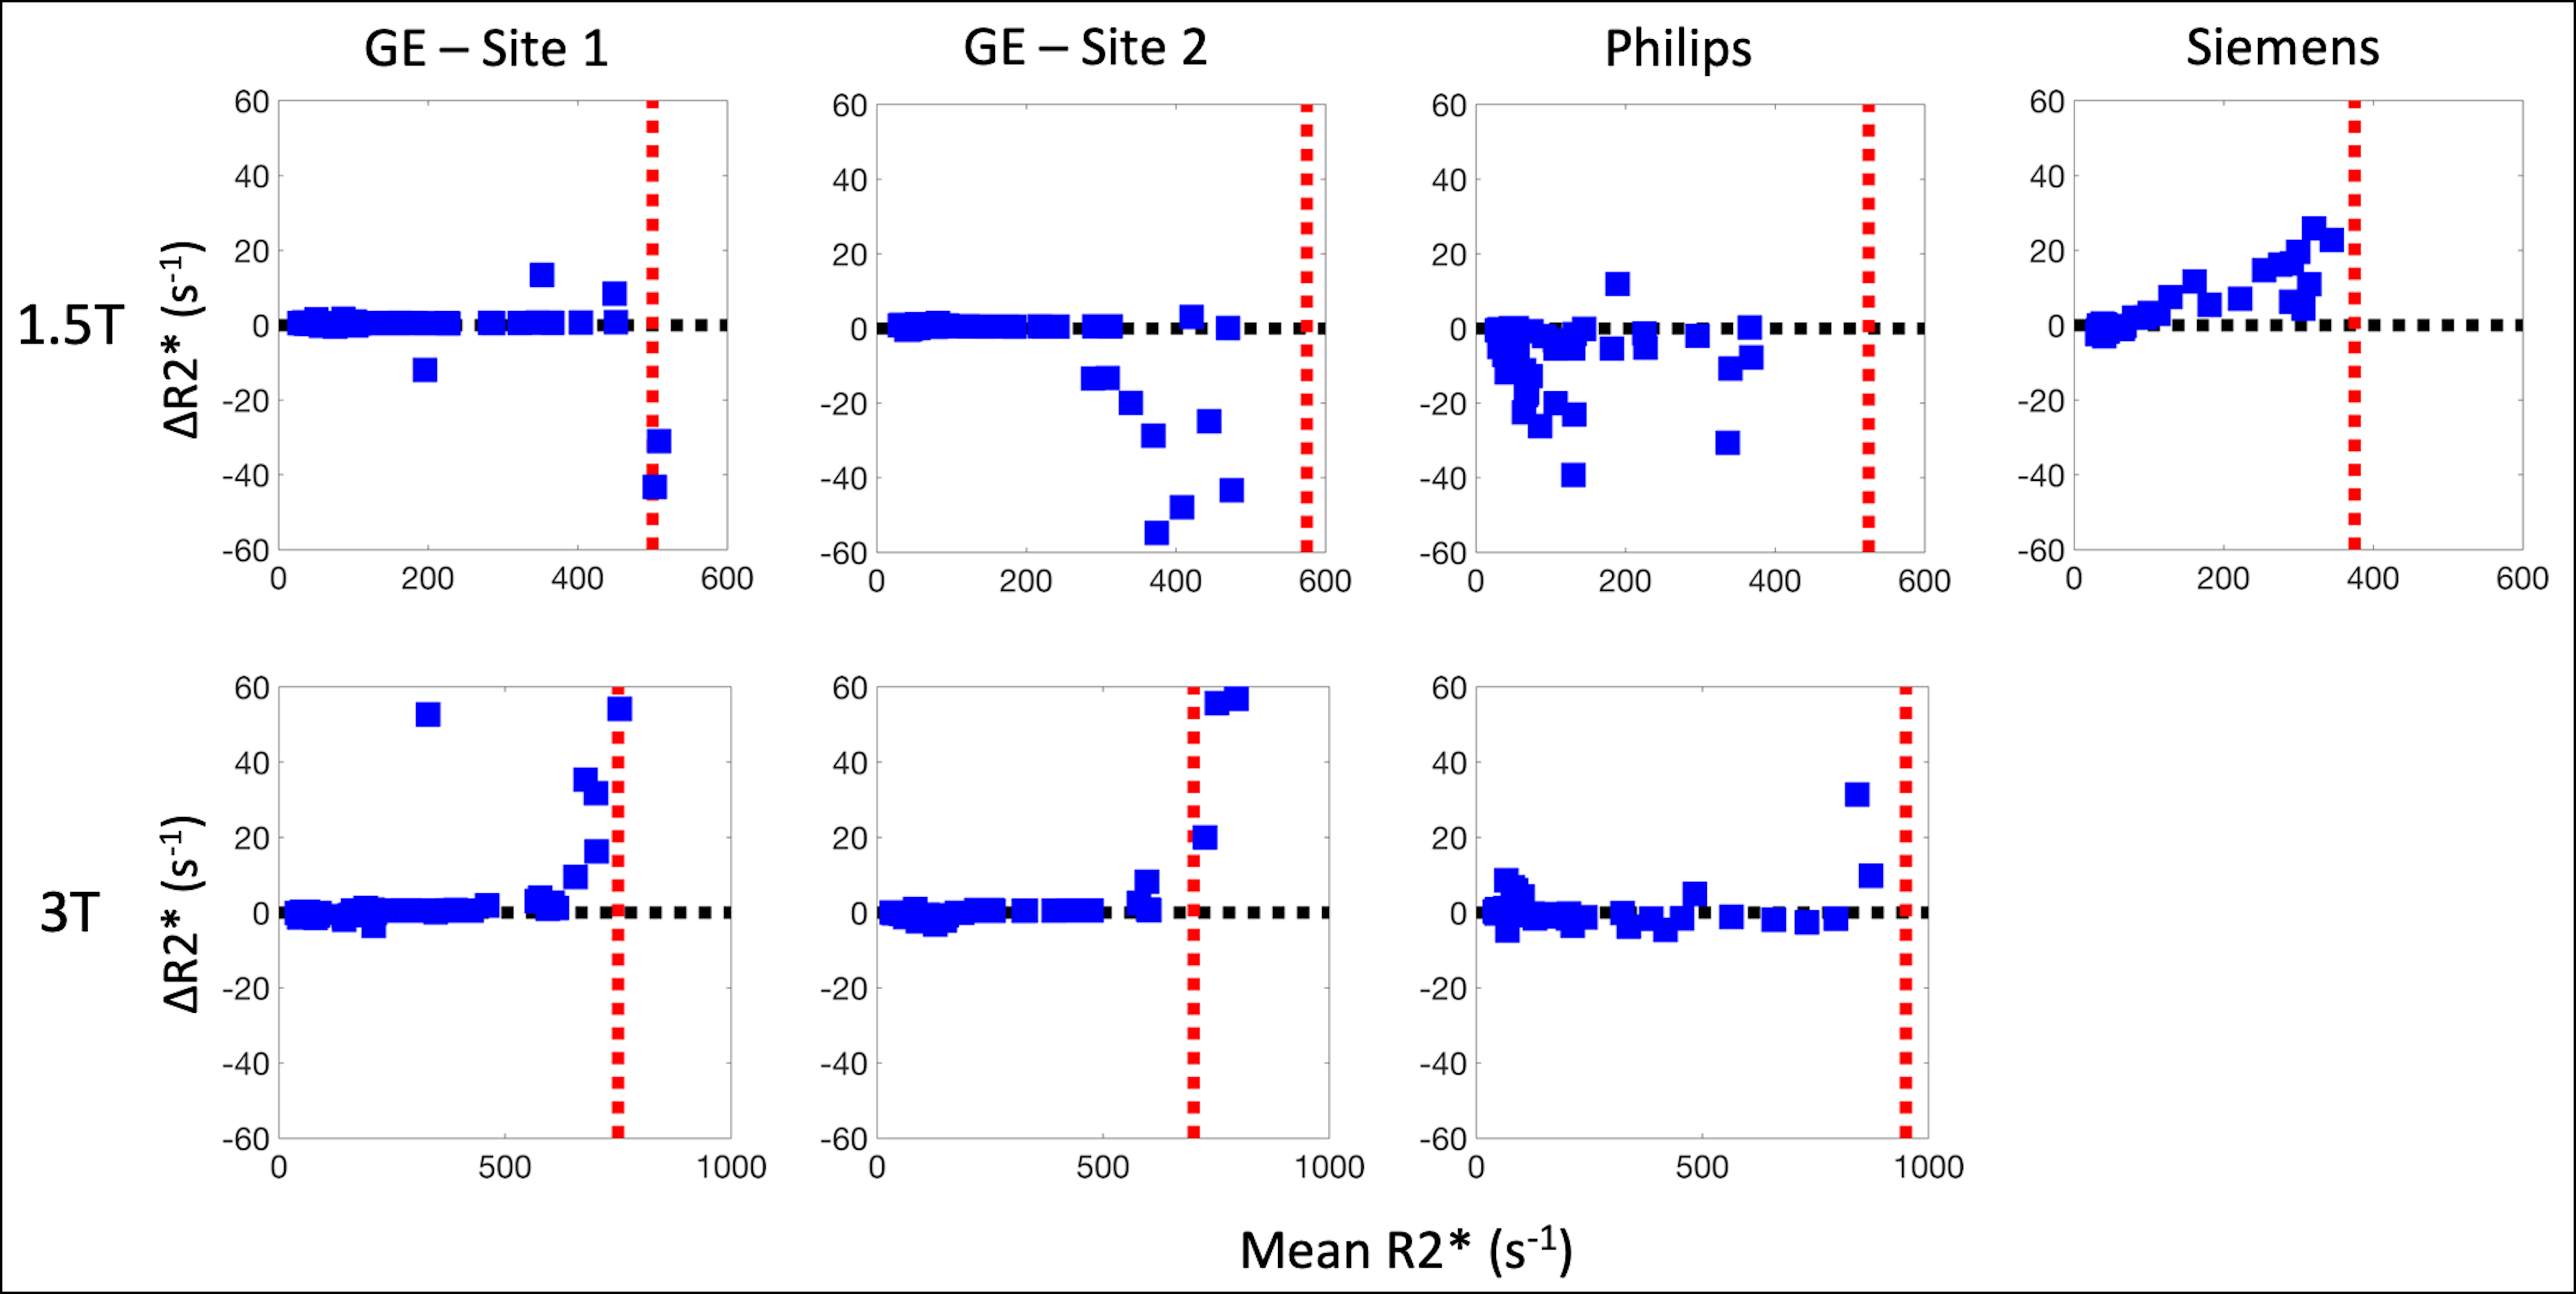
Subjects: A total of 207 subjects were recruited for this study. At Sites 1-4, respectively, subjects=[60(40M/20F), 45(27M/18F), 49(26M/23F), 53(24M/29F)], age=[44±19, 23±17, 44±15, 37±20] years, BMI=[26.7±6.4, 22.0±5.4, 27.6±5.1, 24.3±4.9] kg/m2, LIC=[5.7±6.2, 5.4±5.3, 5.2±8.6, 8.9±9.6] mg/g.Data analysis: Comparing offline and vendor R2* measurements, the largest coefficients of determination (R2) were observed between CF and vendor reconstructions (Figure 1), while the smallest R2 values were observed between Siemens and offline reconstructions. Offline reconstructions produced larger R2* estimates in comparison to vendor reconstructions for subjects with high measured R2* (Figure 2).
R2*-LIC calibrations were more reproducible across sites and vendors using the CH reconstruction in comparison to CF and vendor reconstructions (Figure 3).
Similar upper bounds of the R2* ranges of agreement were observed for GE and Philips reconstructions with the CH reconstruction at 1.5T (Figure 4), while the Philips reconstruction demonstrated the highest upper bound at 3T. However, for low R2* values, the Philips and CH reconstructions exhibited larger variability in their differences across subjects at 1.5T (Figure 5).
Discussion and Conclusion
In this work, CH R2* reconstruction demonstrated high reproducibility of R2*-LIC calibrations across sites and vendors, and these calibrations agree with previously published results.5 At high R2*, CF reconstructions can lead to bias in R2* estimates due to noise-related instability and peak broadening and overlap.7 The stability of estimation can be improved by forgoing fat-correction at high R2*, as performed by CH reconstructions.Further, R2* ranges of agreement were determined between vendor and CH reconstructions, permitting the use of previously published CH R2*-LIC calibrations4,5 within these ranges. In previous work, four clinically relevant LIC thresholds have been defined (1.8, 3.2, 7.0, and 15.0 mg/g).6 Based on the determined R2* ranges of agreement, the first three LIC thresholds could be evaluated using all three vendor reconstructions, except the lowest threshold for Philips at 1.5T (1.8 mg/g; corresponding to R2* ~ 74 s-1 at 1.5T4). However, none of the vendor reconstructions would be able to accurately evaluate the highest LIC threshold (15 mg/g; R2* ~ 565 s-1 and 1037 s-1 at 1.5T and 3T, respectively4).
Limitations of this work include the inability to make direct comparisons across sites and vendors due to differences in patient populations at each site. Additionally, the ranges of agreement may be acquisition parameter specific, as well as specific to the vendor reconstruction versions. To achieve shorter ΔTE, two echo trains were used for data acquisition at 3T. Siemens R2* reconstructions were unavailable for the specific two-train acquisition used in this work.
In conclusion, understanding the agreement between vendor and offline reconstructions may enable clinical interpretation of measured R2* values using emerging multi-center R2*-LIC calibrations.
Acknowledgements
We wish to acknowledge support from the NIH (R01 DK100651, R01 DK117354, R01 DK083380, and K24 DK102595). We also acknowledge GE Healthcare who provides research support to the University of Wisconsin-Madison and Stanford University, Philips Healthcare who provides research support to the University of Texas-Southwestern, and Siemens Healthineers who provides research support to Johns Hopkins University. Finally, Dr. Reeder is a Romnes Faculty Fellow, and has received an award provided by the University of Wisconsin-Madison Office of the Vice Chancellor for Research and Graduate Education with funding from the Wisconsin Alumni Research Foundation.References
1. Wood JC, Enriquez C, Ghugre N, et al. MRI R2 and R2* mapping accurately estimates hepatic iron concentration in transfusion-dependent thalassemia and sickle cell disease patients. Blood. 2005;106(4):1460-1465.
2. Hankins JS, McCarville MB, Loeffler RB, et al. R2* magnetic resonance imaging of the liver in patients with iron overload. Blood. 2009;113(20):4853-4855.
3. Hernando D, Levin YS, Sirlin CB, Reeder SB. Quantification of liver iron with MRI: state of the art and remaining challenges. Journal of Magnetic Resonance Imaging. 2014;40(5):1003-1021.
4. Hernando D, Zhao R, Taviani V, et al. Repeatability and Reproducibility of Confounder-Corrected R2* as a Biomarker of Liver Iron Concentration: Interim Results from a Multi-Center, Multi-Vendor Study at 1.5T and 3T. In Proceedings of the 27th Annual Meeting of ISMRM, Montreal, Canada. 2019;Abstract 1020.
5. Hernando D, Cook RJ, Qazi N, Longhurst CA, Diamond CA, Reeder SB. Complex confounder-corrected R2* mapping for liver iron quantification with MRI. European Radiology. 2021;31(1):264-275.
6. Pierre TGS, Clark PR, Chua-anusorn W, et al. Noninvasive measurement and imaging of liver iron concentrations using proton magnetic resonance. Blood. 2005;105(2):855-861.
7. Hernando D, Kramer JH, Reeder SB. Multipeak fat-corrected complex R2* relaxometry: theory, optimization, and clinical validation. Magn Reson Med. 2013;70(5):1319-1331.
Figures