2764

Low Resolution Diffusion Weighted Imaging for the Assessment of Diffuse Liver Disease
Srijyotsna Volety1,2, Diego Hernando1,2, and Ali Pirasteh1,2
1Radiology, University of Wisconsin - Madison, Madison, WI, United States, 2Medical Physics, University of Wisconsin - Madison, Madison, WI, United States

Synopsis

We evaluated the reproducibility of liver ADC measurements across acquisition parameters using low spatial resolution DWI with M1 optimized diffusion imaging waveforms (MODI) and the routinely clinically utilized monopolar (MONO) waveforms. We also evaluated the effects of various M1 values as well as those of breath-hold and respiratory-triggering on MODI-DWI liver ADC measurements at lower resolutions than utilized in clinical practice. MONO-DWI liver ADC suffered from bias and resolution-dependence in the left lobe while MODI-DWI liver ADC did not demonstrate this effect. MODI-DWI liver ADC did not demonstrate bias with respect to resolution, M1, or breathing technique.

Introduction

Liver fibrosis is the consequence of chronic liver injury of any etiology, and end-stage liver fibrosis (i.e., cirrhosis) is the leading cause of liver-disease-related deaths and the most important factor for liver cancer.1-3 The current gold standard for detection and evaluation of liver fibrosis is biopsy, which suffers from sampling/interpretation variability and potential complications.4-14 MR elastography (MRE) is validated to noninvasively estimate liver stiffness as an indirect surrogate for fibrosis.9,15-23 However, MRE limitations include lower sensitivity for detection of early stages of fibrosis and inability to differentiate fibrosis from concurrent liver inflammation as both processes increase liver stiffness.24-26

Apparent diffusion coefficient (ADC) obtained through diffusion weighted imaging (DWI) has been proposed as a promising marker for assessment of liver fibrosis. However, variabilities in ADC measurements, which are in part due to low signal-to-noise ratio (SNR), motion, and nonuniform acquisition parameters have precluded its widespread clinical utilization.27-30 M1-optimized diffusion imaging (MODI) waveforms have been reported to improve the accuracy and reproducibility of ADC measurements.31 Furthermore, lower-resolution images with subsequently higher SNR may improve ADC reproducibility. Hence, a combination of lower resolution and MODI waveforms may yield more reproducible liver ADC in shorter acquisition times than previously achievable; this approach is tailored for evaluation of diffuse liver disease and not lesion detection. However, the potential impacts of lower resolution and different M1 values on liver ADC obtained through MODI- and MONO-DWI are unknown. Hence, the goal of this study is to evaluate the impact of different spatial resolutions, M1 values, and breath-hold versus respiratory triggering acquisitions on MODI- and MONO-DWI liver ADC in healthy volunteers.

Methods

Images were acquired on a 3.0T MRI scanner(Signa Premier, GE Healthcare) using an anterior array coil (Air Coil, GE Healthcare) and a posterior embedded table coil. Seven healthy volunteers were recruited. Table 1 summarizes the image acquisition parameters. DWI sequences were acquired at b=50 and 500s/mm2. MODI-DWI was acquired using three M1-values: 0.0, 0.06, and 0.1s/mm. M1 was fixed across b-values for MODI-DWI. Breath-held and respiratory-triggered images were acquired for all waveforms. For MODI-DWI, images at 2.8x2.8x6mm3 were not acquired due to scan time limitations. Furthermore, the MODI waveform of breath-hold acquisitions was limited to one diffusion direction to accommodate realistic breath-hold times.

ADC maps were generated in MATLAB (R2020a) using the b=50 and 500s/mm2 images and were reviewed/analyzed in Horos (v3.3.6). For each subject, three circular regions of interest (ROIs) measuring 2cm in diameter were placed on the b=50 s/mm2 image to avoid bias: one in each liver lobe and one in the spleen, avoiding major vessels and artifacts. ROIs were copied onto the corresponding ADC maps. Paired t-tests were used for comparison of ADC measurements across resolutions, M1, and breath-held versus respiratory-triggered exams.

Results

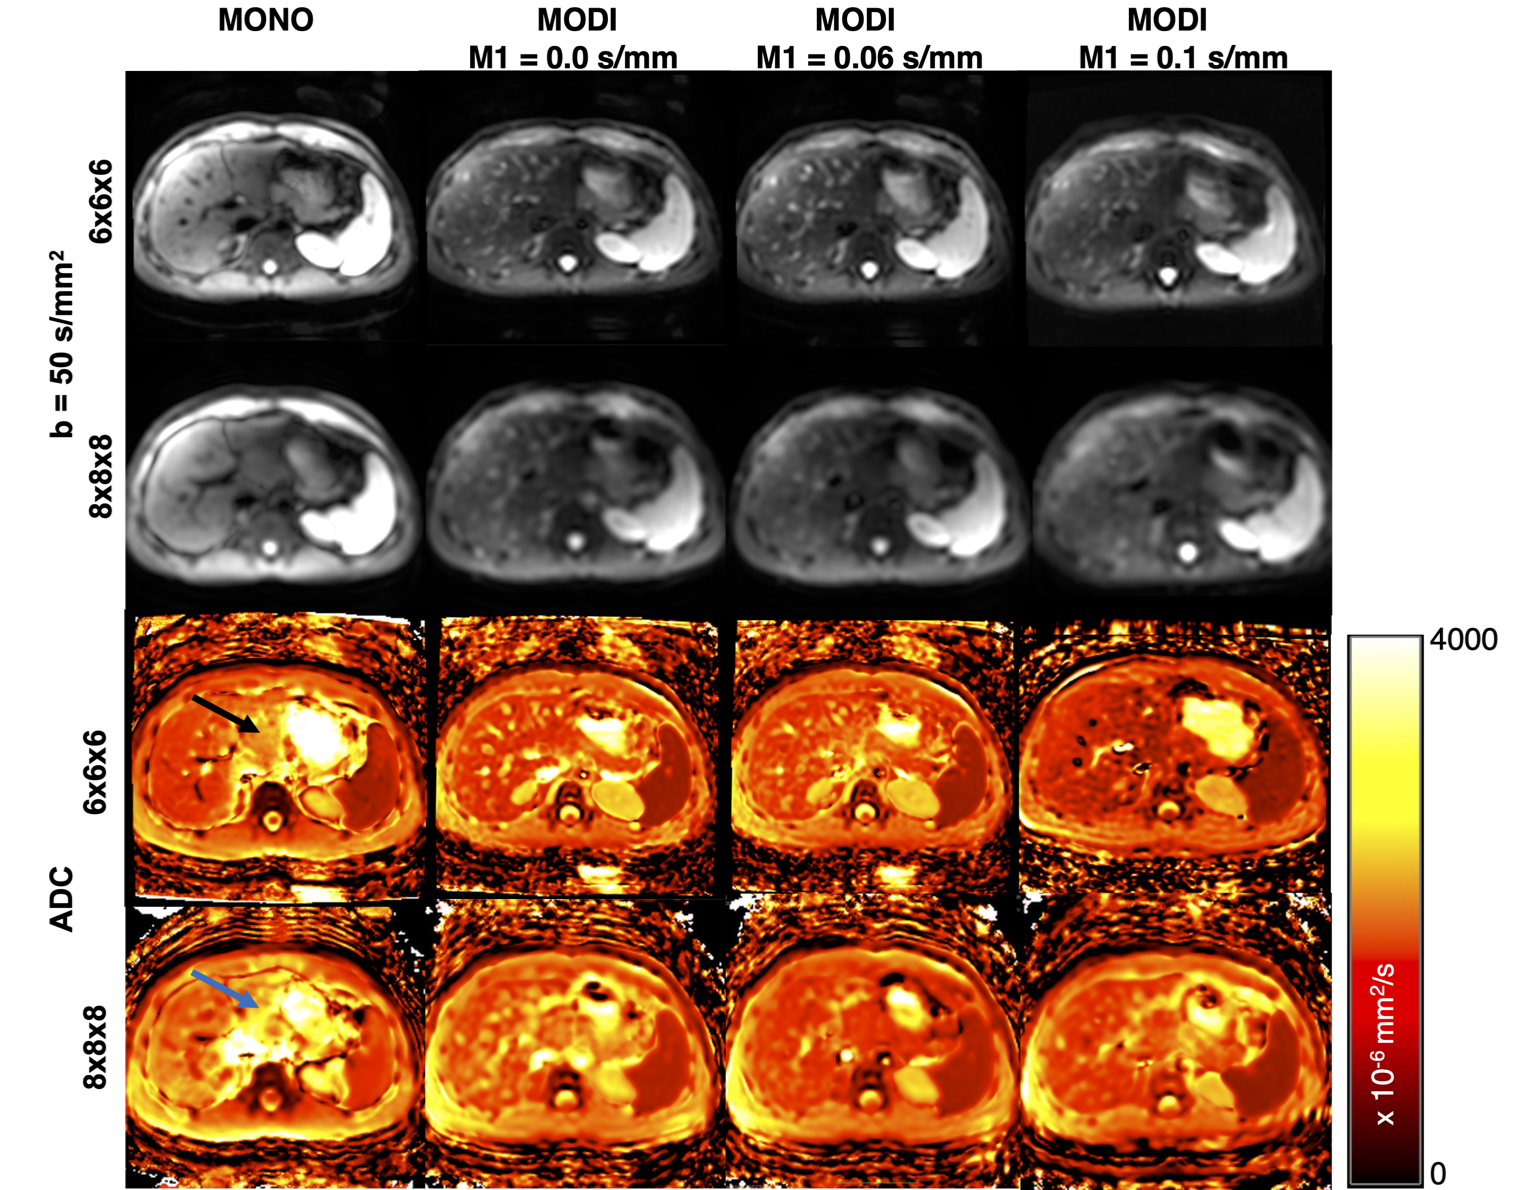
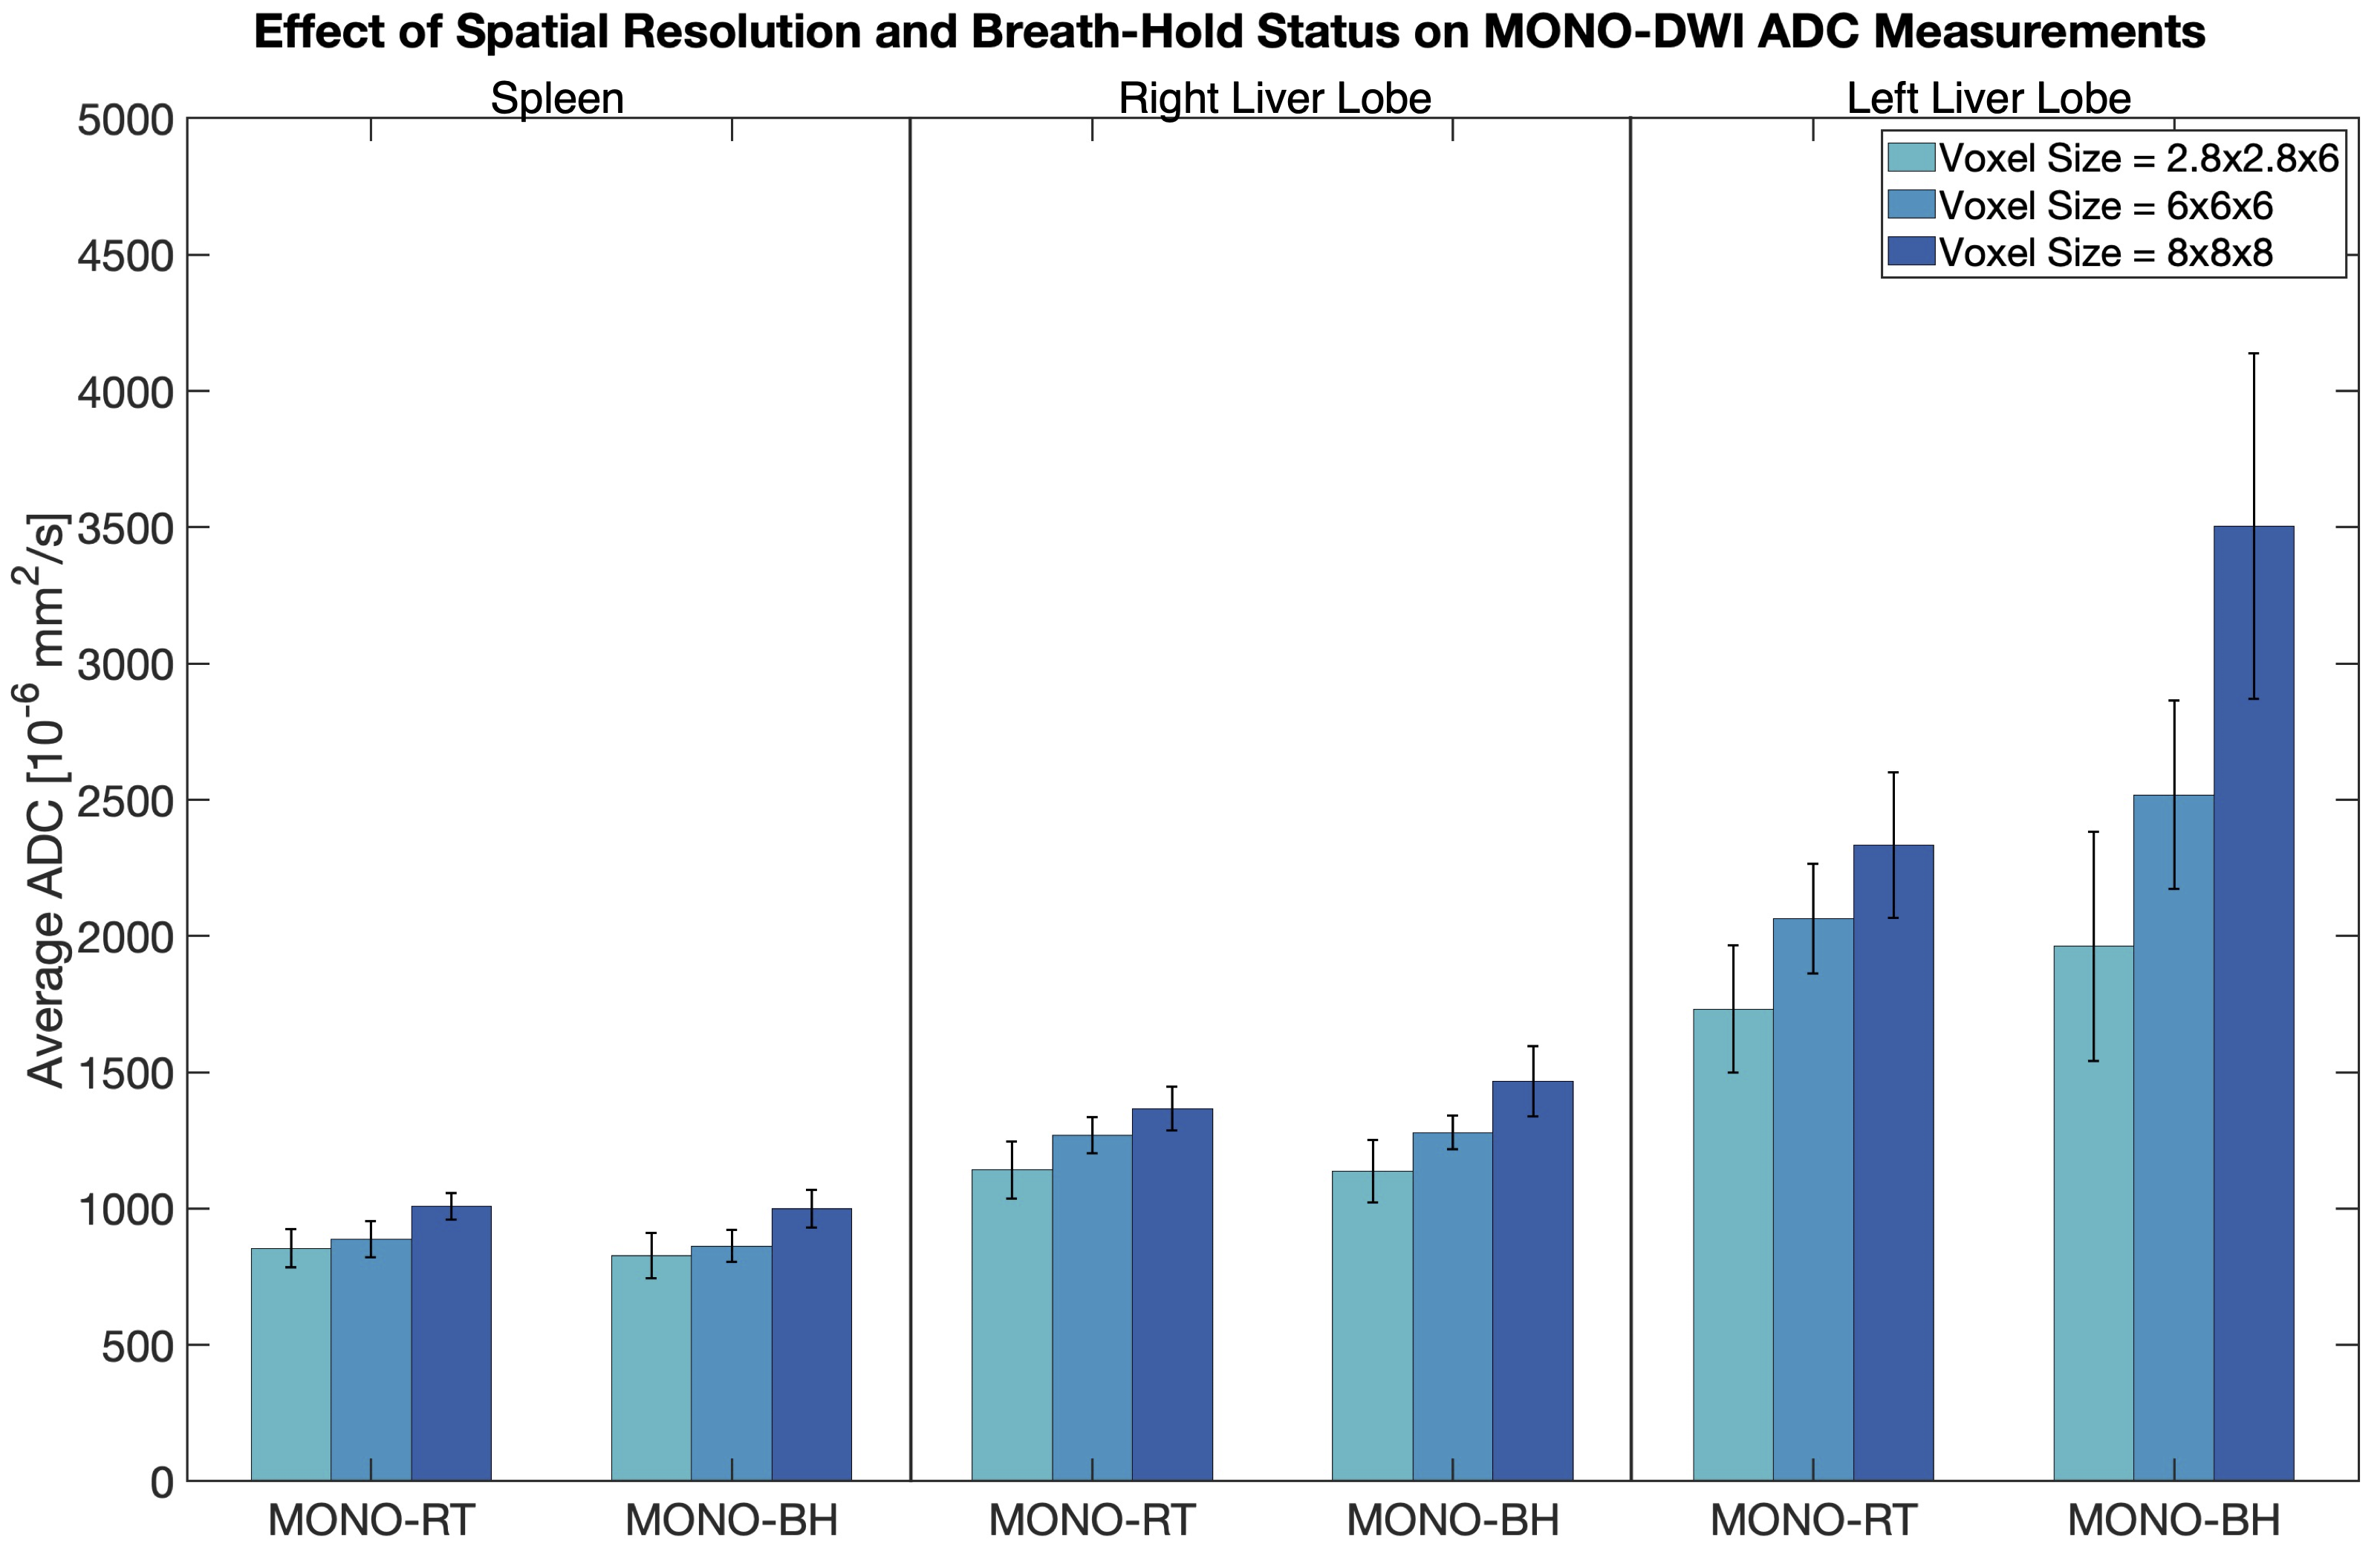
Figure 1 demonstrates sample DWI and ADC maps from a single subject, providing an example of the image resolution/subjective quality across different techniques.

Figure 2 suggests an appreciable progressive increase in MONO-DWI liver ADC as a function of increasing voxel size (P=0.04). Bias is further amplified in the left lobe due to cardiac motion. While a similar pattern is noted in the spleen, it is less tangible and not statistically significant (P=0.054). While no difference was noted in the spleen and right liver lobe ADC between breath-held and respiratory-triggered acquisitions (P=0.61 and P=0.92, respectively), in the left liver lobe, breath-held MONO-DWI demonstrated even more bias and higher ADC values than the respiratory-triggered acquisition (P=0.01).

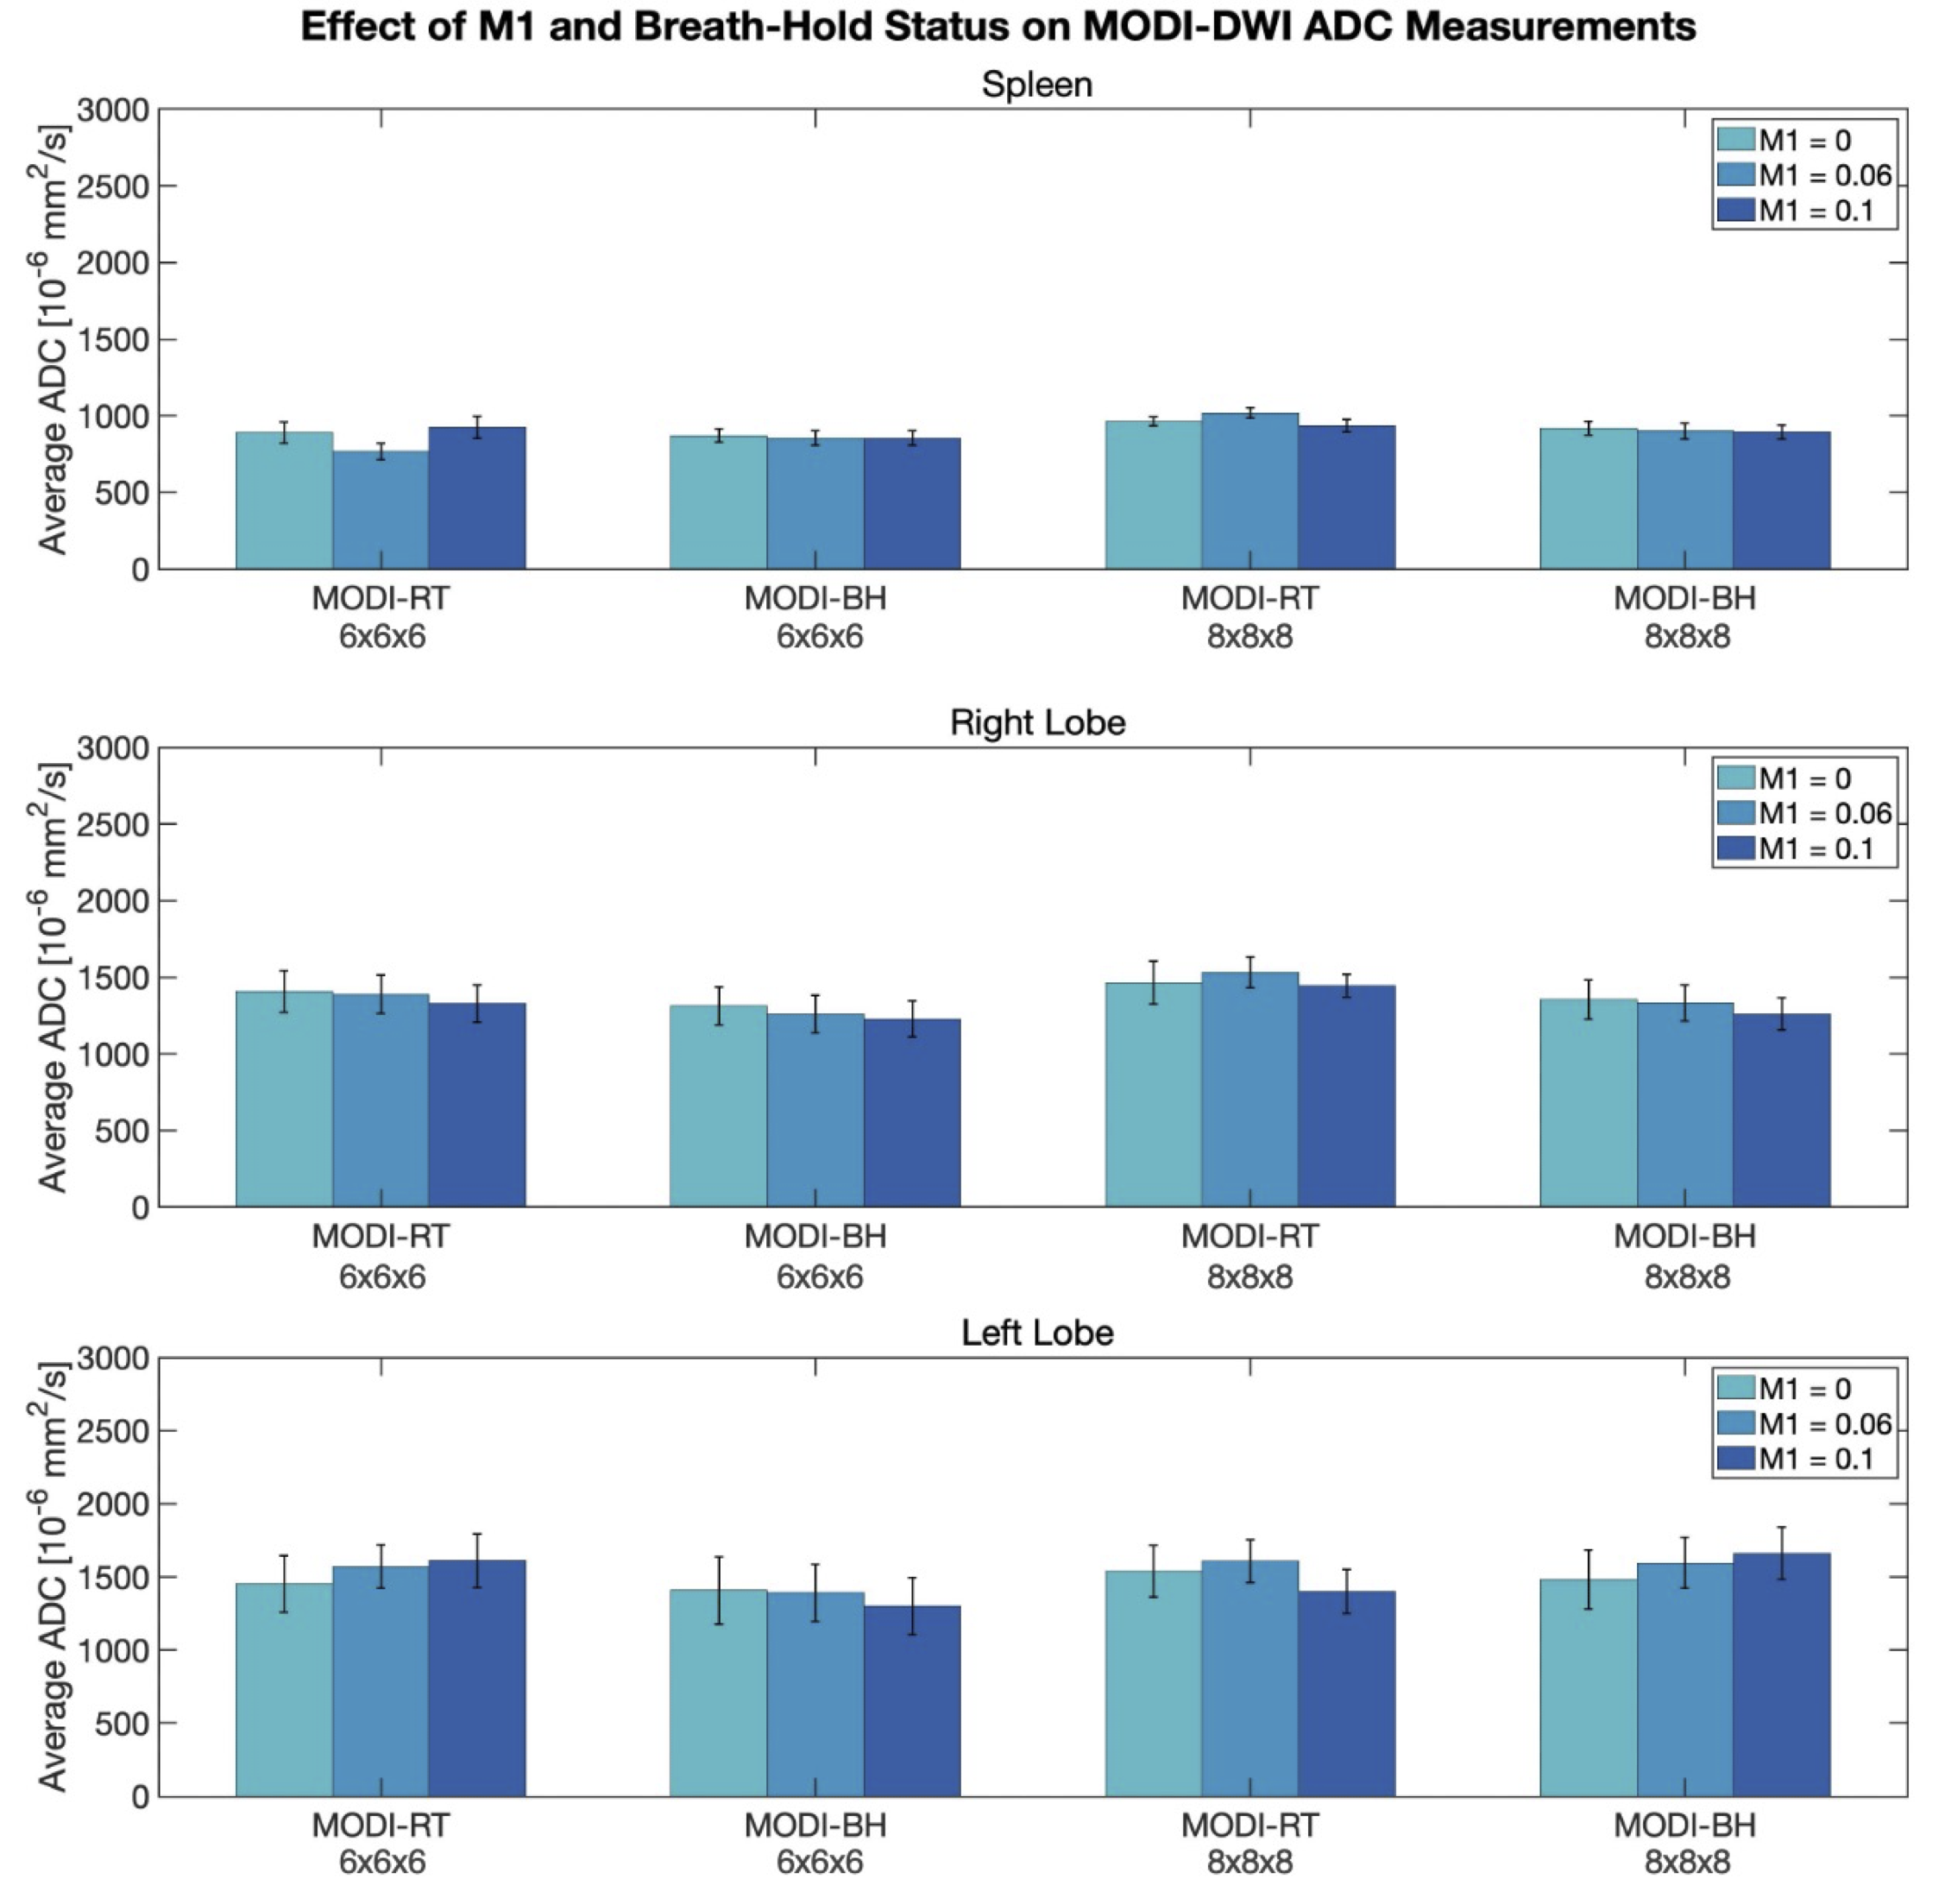
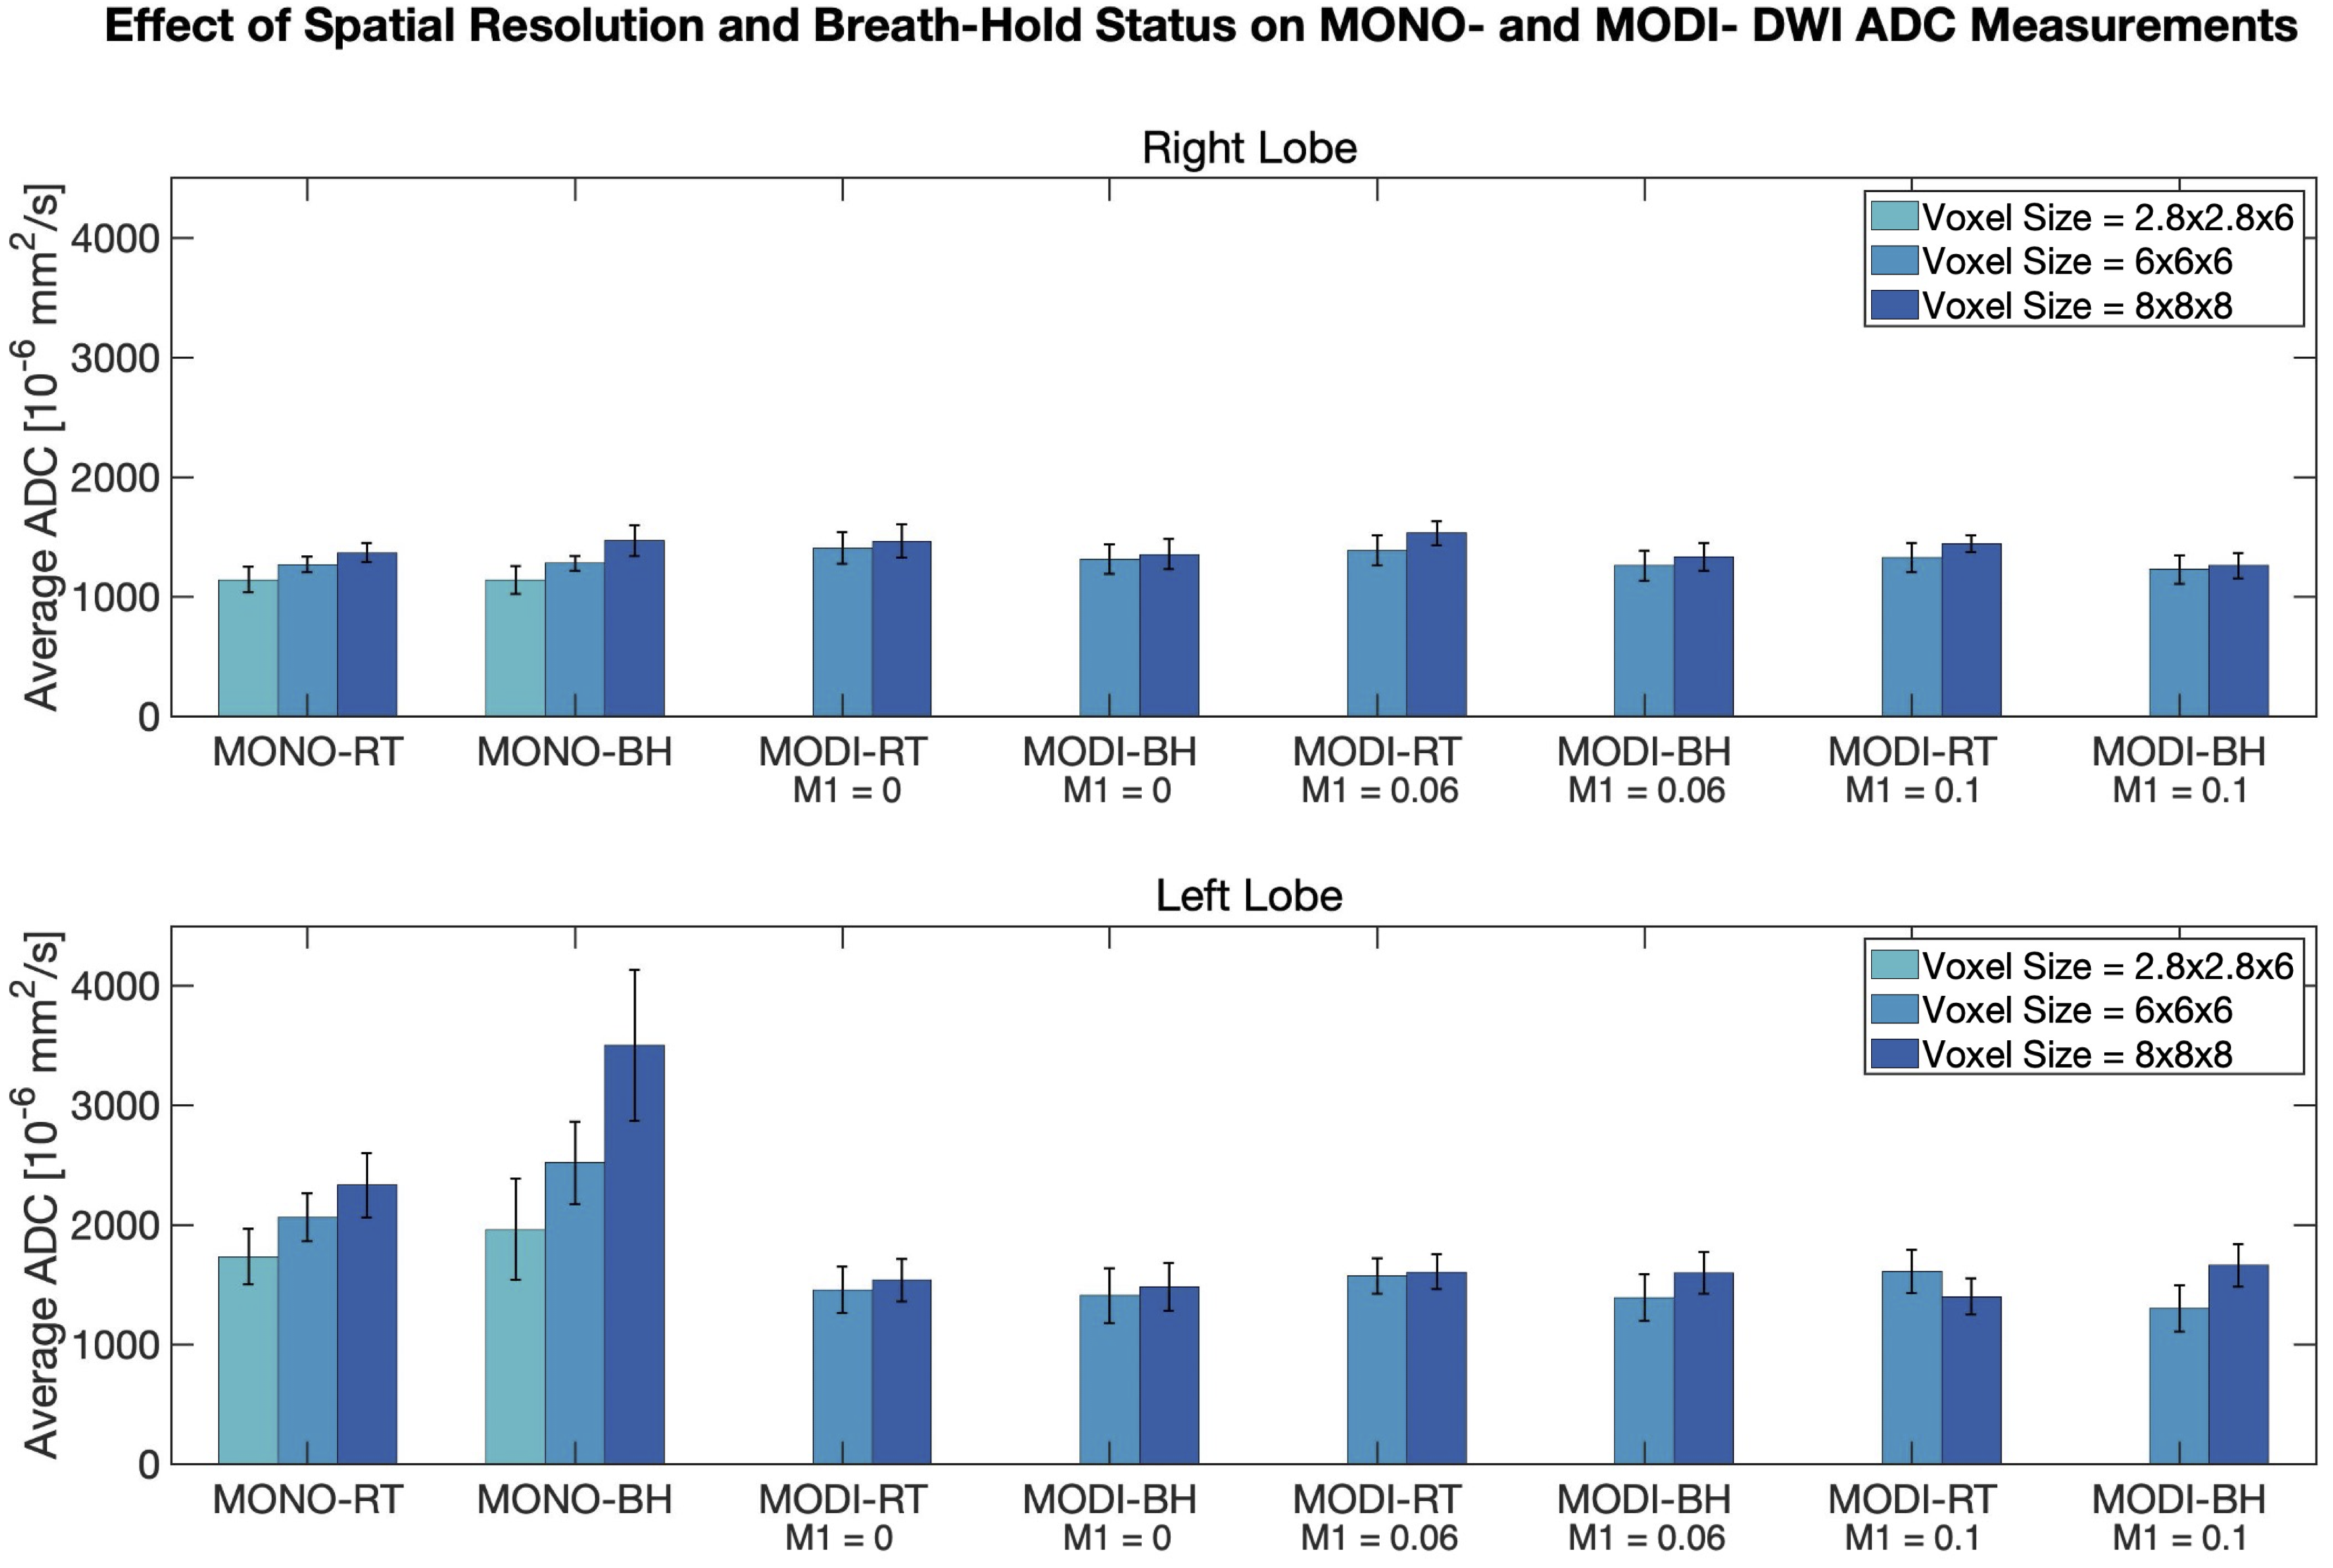
In contrast to MONO-DWI, MODI-DWI ADC was reproducible in both liver lobes and the spleen, across the tested M1 values (P=0.63), resolutions (P=0.32), and breath-hold versus respiratory-triggered acquisitions (P=0.92) (Figure 3). In the right liver lobe, where MONO-DWI ADC was most reproducible, MODI-DWI ADC demonstrates comparable values (Figure 4). Figure 4 also demonstrates the favorable reproducibility of MODI-DWI ADC in the left lobe compared to MONO-DWI ADC.

Discussion and Conclusions

We demonstrated that low-resolution MODI-DWI liver ADC is reproducible across the examined resolutions, different M1 values, and breath-held and respiratory-triggered acquisitions among healthy volunteers. Average liver ADC measurements are also similar to those reported in the literature.31-33 To our knowledge, the reproducibility of ADC at lower resolutions has not been demonstrated previously and is novel. Hence, this low-resolution approach is promising to achieve reproducible and rapid whole-liver evaluation in the setting of diffuse liver disease.

We demonstrated more reproducible assessment of the left lobe by MODI-DWI ADC compared to MONO-DWI, which is a known limitation of MONO-DWI due to cardiac motion. We noted that this bias of MONO-DWI ADC is amplified at lower-resolutions and in breath-hold acquisitions, a phenomenon not observed in MODI-DWI ADC. Hence, low-resolution MODI-DWI can better assess the extent of disease heterogeneity in very short scan times.

Limitations of this study include its small sample size and absence of pathology in healthy volunteers. Furthermore, this study lacked correlation of ADC measurements with other reference standards, such as MRE or liver biopsy. Repeatability was not studied due to scan time constraints dictated by the number of parameters examined. Motivated by these promising preliminary results, we aim to further investigate the performance of low-resolution MODI-DWI in assessment of liver fibrosis among patients and in comparison to the current reference standards.

Acknowledgements

The authors acknowledge support from the NIH (R01 EB030497), from the University of Wisconsin-Madison Office of the Vice Chancellor for Research and Graduate Education with funding from the Wisconsin Alumni Research Foundation, as well as from the UW Departments of Radiology and Medical Physics. Also, GE Healthcare provides research support to the University of Wisconsin-Madison.

References

1. Ge PS, Runyon BA. Treatment of Patients with Cirrhosis. N Engl J Med. 2016;375(8):767-777.
2. Sepanlou SG, Safiri S, Bisignano C, et al. The global, regional, and national burden of cirrhosis by cause in 195 countries and territories, 1990–2017: a systematic analysis for the Global Burden of Disease Study 2017. The Lancet Gastroenterology & Hepatology. 2020;5(3):245-266.
3. Ferlay J, Colombet M, Soerjomataram I, et al. Estimating the global cancer incidence and mortality in 2018: GLOBOCAN sources and methods. Int J Cancer. 2019;144(8):1941-1953.
4. Rousselet M-C, Michalak S, Dupré F, et al. Sources of variability in histological scoring of chronic viral hepatitis. Hepatology. 2005;41(2):257-264.
5. Soloway RD, Baggenstoss AH, Schoenfield LJ, Summerskill WHJ. Observer error and sampling variability tested in evaluation of hepatitis and cirrhosis by liver biopsy. The American Journal of Digestive Diseases. 1971;16(12):1082-1086.
6. Goldin RD, Goldin JG, Burt AD, et al. Intra-observer variation in the histopathological assessment of chronic viral hepatitis. J Hepatol. 1996;25(5):649-654.
7. Maharaj B, Maharaj RJ, Leary WP, et al. Sampling variability and its influence on the diagnostic yield of percutaneous needle biopsy of the liver. Lancet. 1986;1(8480):523-525.
8. Regev A, Berho M, Jeffers LJ, et al. Sampling error and intraobserver variation in liver biopsy in patients with chronic HCV infection. Am J Gastroenterol. 2002;97(10):2614-2618.
9. Bedossa P, Dargère D, Paradis V. Sampling variability of liver fibrosis in chronic hepatitis C. Hepatology. 2003;38(6):1449-1457.
10. Perrault J, McGill DB, Ott BJ, Taylor WF. Liver biopsy: complications in 1000 inpatients and outpatients. Gastroenterology. 1978;74(1):103-106.
11. Piccinino F, Sagnelli E, Pasquale G, Giusti G. Complications following percutaneous liver biopsy. A multicentre retrospective study on 68,276 biopsies. J Hepatol. 1986;2(2):165-173.
12. Froehlich F, Lamy O, Fried M, Gonvers JJ. Practice and complications of liver biopsy. Dig Dis Sci. 1993;38(8):1480-1484.
13. Cadranel J-F, Rufat P, Degos F. Practices of Liver Biopsy in France: Results of a Prospective Nationwide Survey. Hepatology. 2000;32(3):477-481.
14. Bravo AA, Sheth SG, Chopra S. Liver Biopsy. N Engl J Med. 2001;344(7):495-500.
15. Huwart L, Peeters F, Sinkus R, et al. Liver fibrosis: non-invasive assessment with MR elastography. NMR in Biomedicine. 2006;19(2):173-179.
16. Huwart L, Salameh N, ter Beek L, et al. MR elastography of liver fibrosis: preliminary results comparing spin-echo and echo-planar imaging. Eur Radiol. 2008;18(11):2535-2541.
17. Huwart L, Sempoux C, Salameh N, et al. Liver Fibrosis: Noninvasive Assessment with MR Elastography versus Aspartate Aminotransferase–to-Platelet Ratio Index. Radiology. 2007;245(2):458-466.
18. Huwart L, Sempoux C, Vicaut E, et al. Magnetic resonance elastography for the noninvasive staging of liver fibrosis. Gastroenterology. 2008;135(1):32-40.
19. Rouvière O, Yin M, Dresner MA, et al. MR elastography of the liver: preliminary results. Radiology. 2006;240(2):440-448.
20. Singh S, Venkatesh SK, Wang Z, et al. Diagnostic performance of magnetic resonance elastography in staging liver fibrosis: a systematic review and meta-analysis of individual participant data. Clin Gastroenterol Hepatol. 2015;13(3):440-451.e6.
21. Talwalkar JA, Yin M, Fidler JL, Sanderson SO, Kamath PS, Ehman RL. Magnetic resonance imaging of hepatic fibrosis: Emerging clinical applications. Hepatology. 2008;47(1):332-342.
22. Yin M, Glaser KJ, Talwalkar JA, Chen J, Manduca A, Ehman RL. Hepatic MR Elastography: Clinical Performance in a Series of 1377 Consecutive Examinations. Radiology. 2016;278(1):114-124.
23. Yin M, Talwalkar JA, Glaser KJ, et al. Assessment of Hepatic Fibrosis With Magnetic Resonance Elastography. Clinical Gastroenterology and Hepatology. 2007;5(10):1207-1213.e2.
24. Yin M, Woollard J, Wang X, et al. Quantitative assessment of hepatic fibrosis in an animal model with magnetic resonance elastography. Magn Reson Med. 2007;58(2):346-353.
25. Wegrzyniak O, Rosestedt M, Eriksson O. Recent Progress in the Molecular Imaging of Nonalcoholic Fatty Liver Disease. Int J Mol Sci. 2021;22(14):7348.
26. Sumida Y, Nakajima A, Itoh Y. Limitations of liver biopsy and non-invasive diagnostic tests for the diagnosis of nonalcoholic fatty liver disease/nonalcoholic steatohepatitis. World J Gastroenterol. 2014;20(2):475-485.
27. Dietrich O, Heiland S, Sartor K. Noise correction for the exact determination of apparent diffusion coefficients at low SNR. Magn Reson Med. 2001, 45(3), 448–453.
28. Kwee TC, Takahara T, Niwa T,et al. Influence of cardiac motion on diffusion-weighted magnetic resonance imaging of the liver. Magnetic Resonance Materials in Physics, Biology and Medicine, 2009, 22(5), 319-325.
29. Sasaki M, Yamada K, Watanabe Y, et al. Variability in absolute apparent diffusion coefficient values across different platforms may be substantial: a multivendor, multi-institutional comparison study. Radiology, 2009, 249(2), 624–630.
30. Faria SC, Ganesan K, Mwangi I, et al. MR Imaging of Liver Fibrosis: Current State of the Art. RadioGraphics, 2009, 29(6), 1615–1635.
31. Zhang Y, Peña-Nogales Ó, Holmes JH, Hernando D. Motion-robust and blood-suppressed M1-optimized diffusion MR imaging of the liver. Magnetic resonance in medicine, 2019, 82(1), 302–311.
32. Peña-Nogales Ó, Zhang Y, Wang X, et al. Optimized Diffusion-Weighting Gradient Waveform Design (ODGD) formulation for motion compensation and concomitant gradient nulling. Magnetic resonance in medicine, 2019, 81(2), 989–1003.
33. Aliotta E, Wu HH, Ennis DB. Convex optimized diffusion encoding (CODE) gradient waveforms for minimum echo time and bulk motion-compensated diffusion-weighted MRI. Magnetic resonance in medicine, 2017, 77(2), 717–729.

Figures

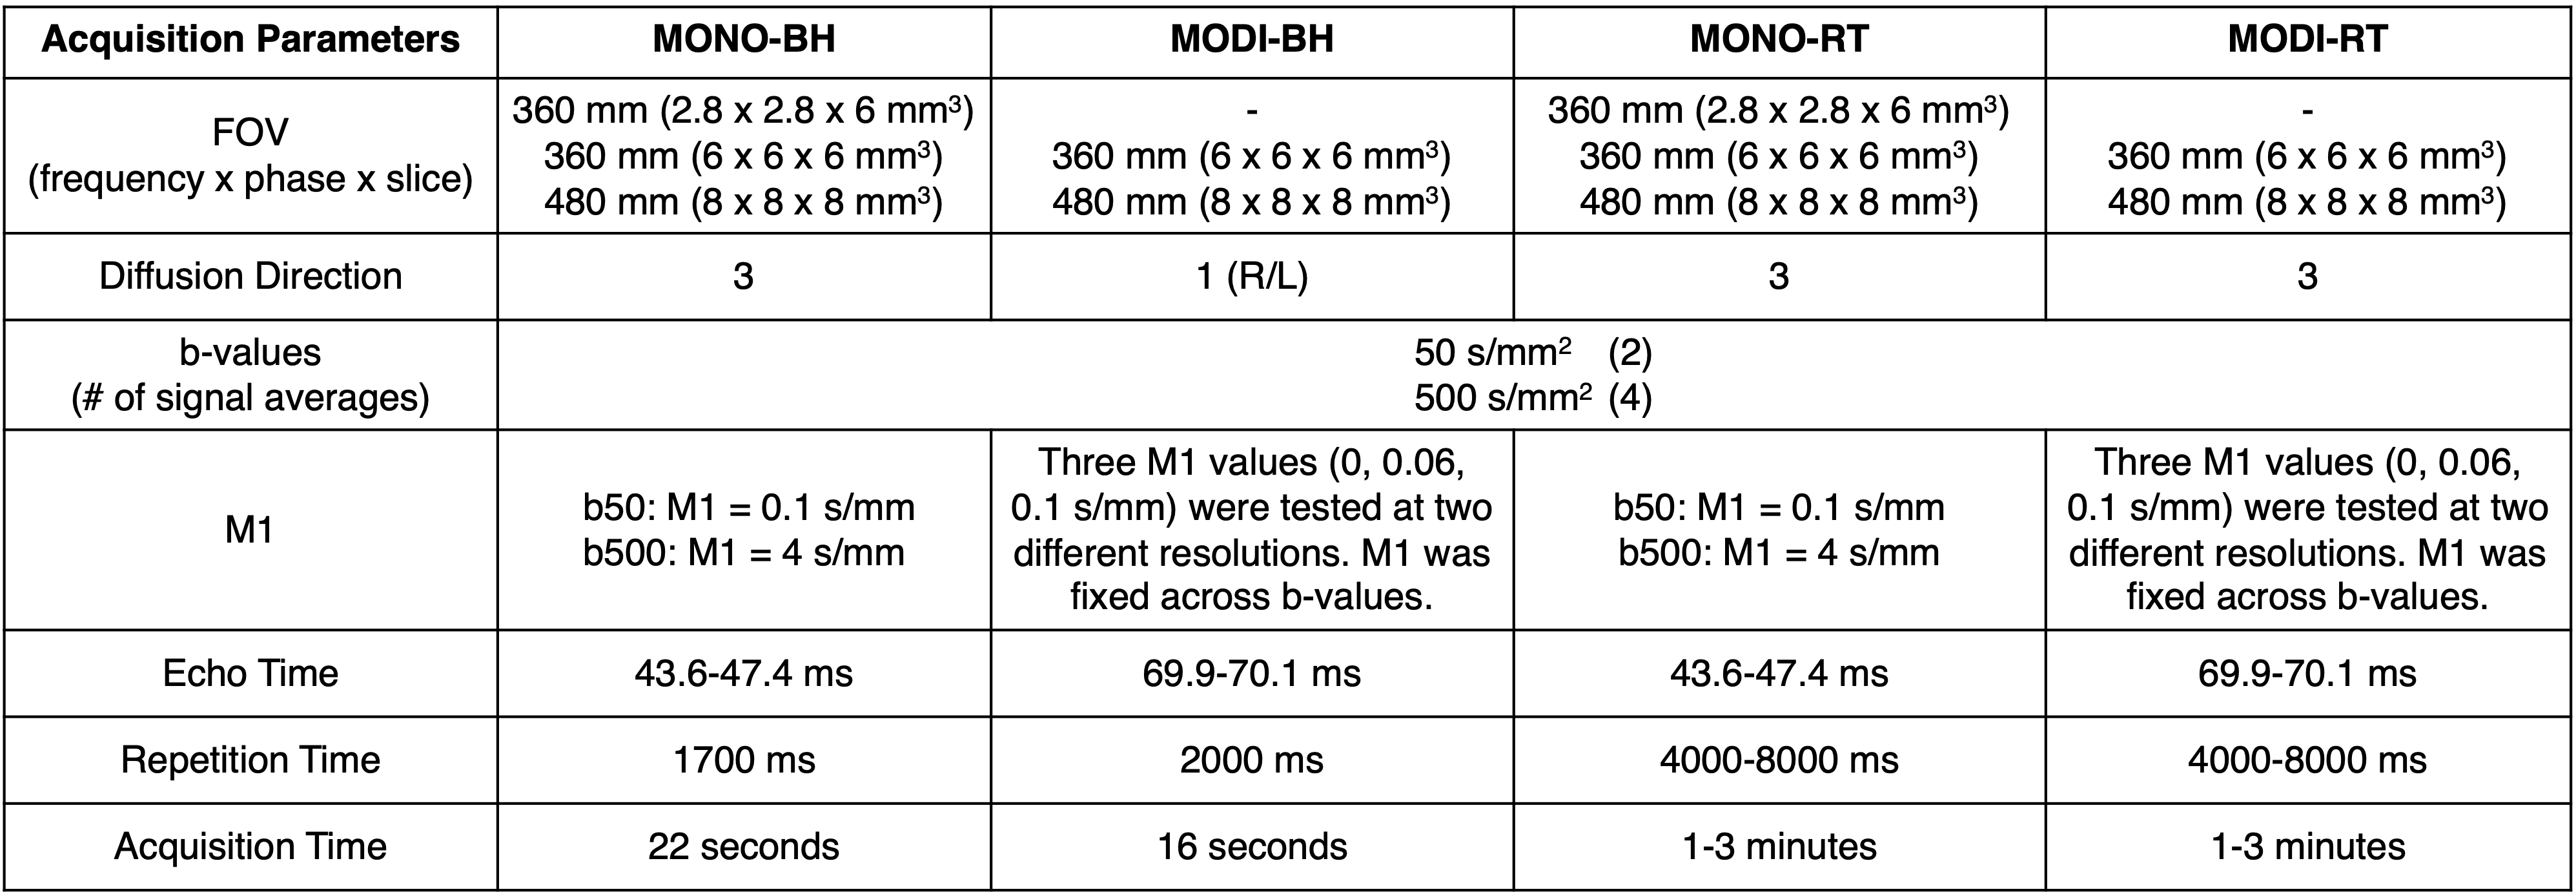
Table 1: Summary of image acquisition parameters.


Figure 1: Low-resolution MONO- and MODI- DWI images at b = 50 s/mm2 across different M1 values for MODI-DWI and corresponding ADC maps, demonstrating excellent organ anatomy delineation; although these images may not be adequate for lesion detection, they are probably adequate for evaluating parenchymal disease (i.e., diffuse liver disease), which is the purpose of the proposed approach. MONO-DWI ADC maps demonstrate bias in the left lobe (black arrow) compared to the right lobe, which is further amplified at lower resolution (blue arrow). This bias is not observed in MODI-DWI ADC.

Figure 2: MONO-DWI ADC suffers from bias at lower resolutions. There is an appreciable progressive increase in MONO-DWI liver ADC as a function of decreasing resolution, which is further amplified in the left lobe due to cardiac motion. A similar yet less tangible pattern is noted in the spleen. While no difference was noted in the spleen and right lobe liver ADC between breath-held (BH) and respiratory-triggered (RT) acquisitions (P = 0.61 and P = 0.92, respectively), in the left lobe, BH acquisition demonstrated even more bias and higher ADC values than the RT acquisition (P = 0.01).

Figure 3: MODI-DWI ADC is reproducible in both liver lobes and the spleen, across M1 values (P = 0.63), resolutions (P = 0.32), and breath-hold versus respiratory triggered acquisitions (P = 0.92).

Figure 4: MODI-DWI is more reproducible than MONO-DWI in the left lobe. MODI-DWI demonstrate similar ADC values and reproducibility compared to MONO-DWI in the right lobe of the liver. However, in the left lobe, MODI-DWI ADC reproducibility is favorable compared to MONO-DWI, across M1 values, resolutions, and breath-hold (BH) versus respiratory triggered (RT) acquisitions.

Proc. Intl. Soc. Mag. Reson. Med. 30 (2022)
2764
DOI: https://doi.org/10.58530/2022/2764