2763
PROGNOSTIC VALUE OF BASELINE MRI FOR LIVER VOLUME CHANGES FOLLOWING LOW CALORIE DIET1Radiology, University of California San Diego, La Jolla, CA, United States, 2Computational and Applied Statistics Laboratory, University of California San Diego, La Jolla, CA, United States, 3University of Wisconsin Madison, Madison, WI, United States
Synopsis
The purpose of this study was to identify the prognostic value of baseline MRI-determined imaging biomarkers for liver volume changes following low-calorie liquid diet in bariatric surgery patients
Introduction
Bariatric surgery leads to profound weight loss and remission of metabolic syndrome (1,2). Low calorie liquid diet (LCLD) prior to bariatric surgery has been shown to improve outcomes through reduced intraoperative complications (3–5). Liver shrinkage improves outcomes by reducing the technical difficulty of the operation and reducing the rate of open-conversion (3,4). LCLD leads to reduction of liver volume of ~20% on average (6) but it is highly variable. The factors that lead to liver shrinkage are poorly understood. Development of predictive models using baseline parameters could improve outcomes of bariatric surgery through diet optimization and informed scheduling of surgery but so far no such models have been reported. This investigational study attempts to establish and compare models for prediction of liver size shrinkage using either clinical and serological biomarkers ONLY; or clinical, serological, and MRI-based biomarkers.Methods
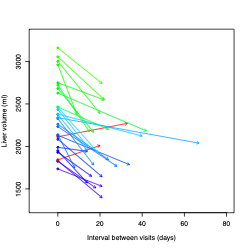
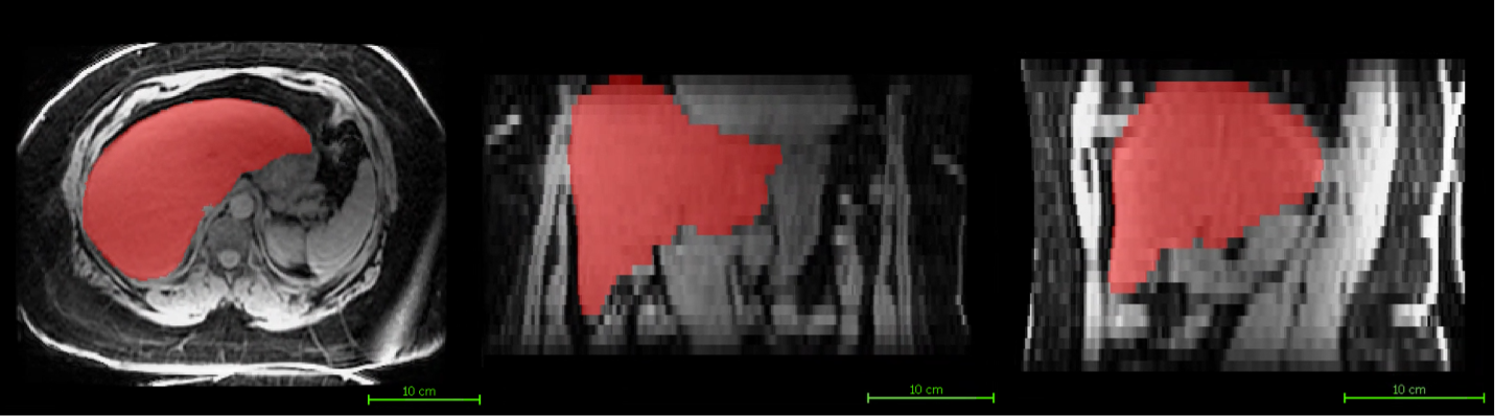
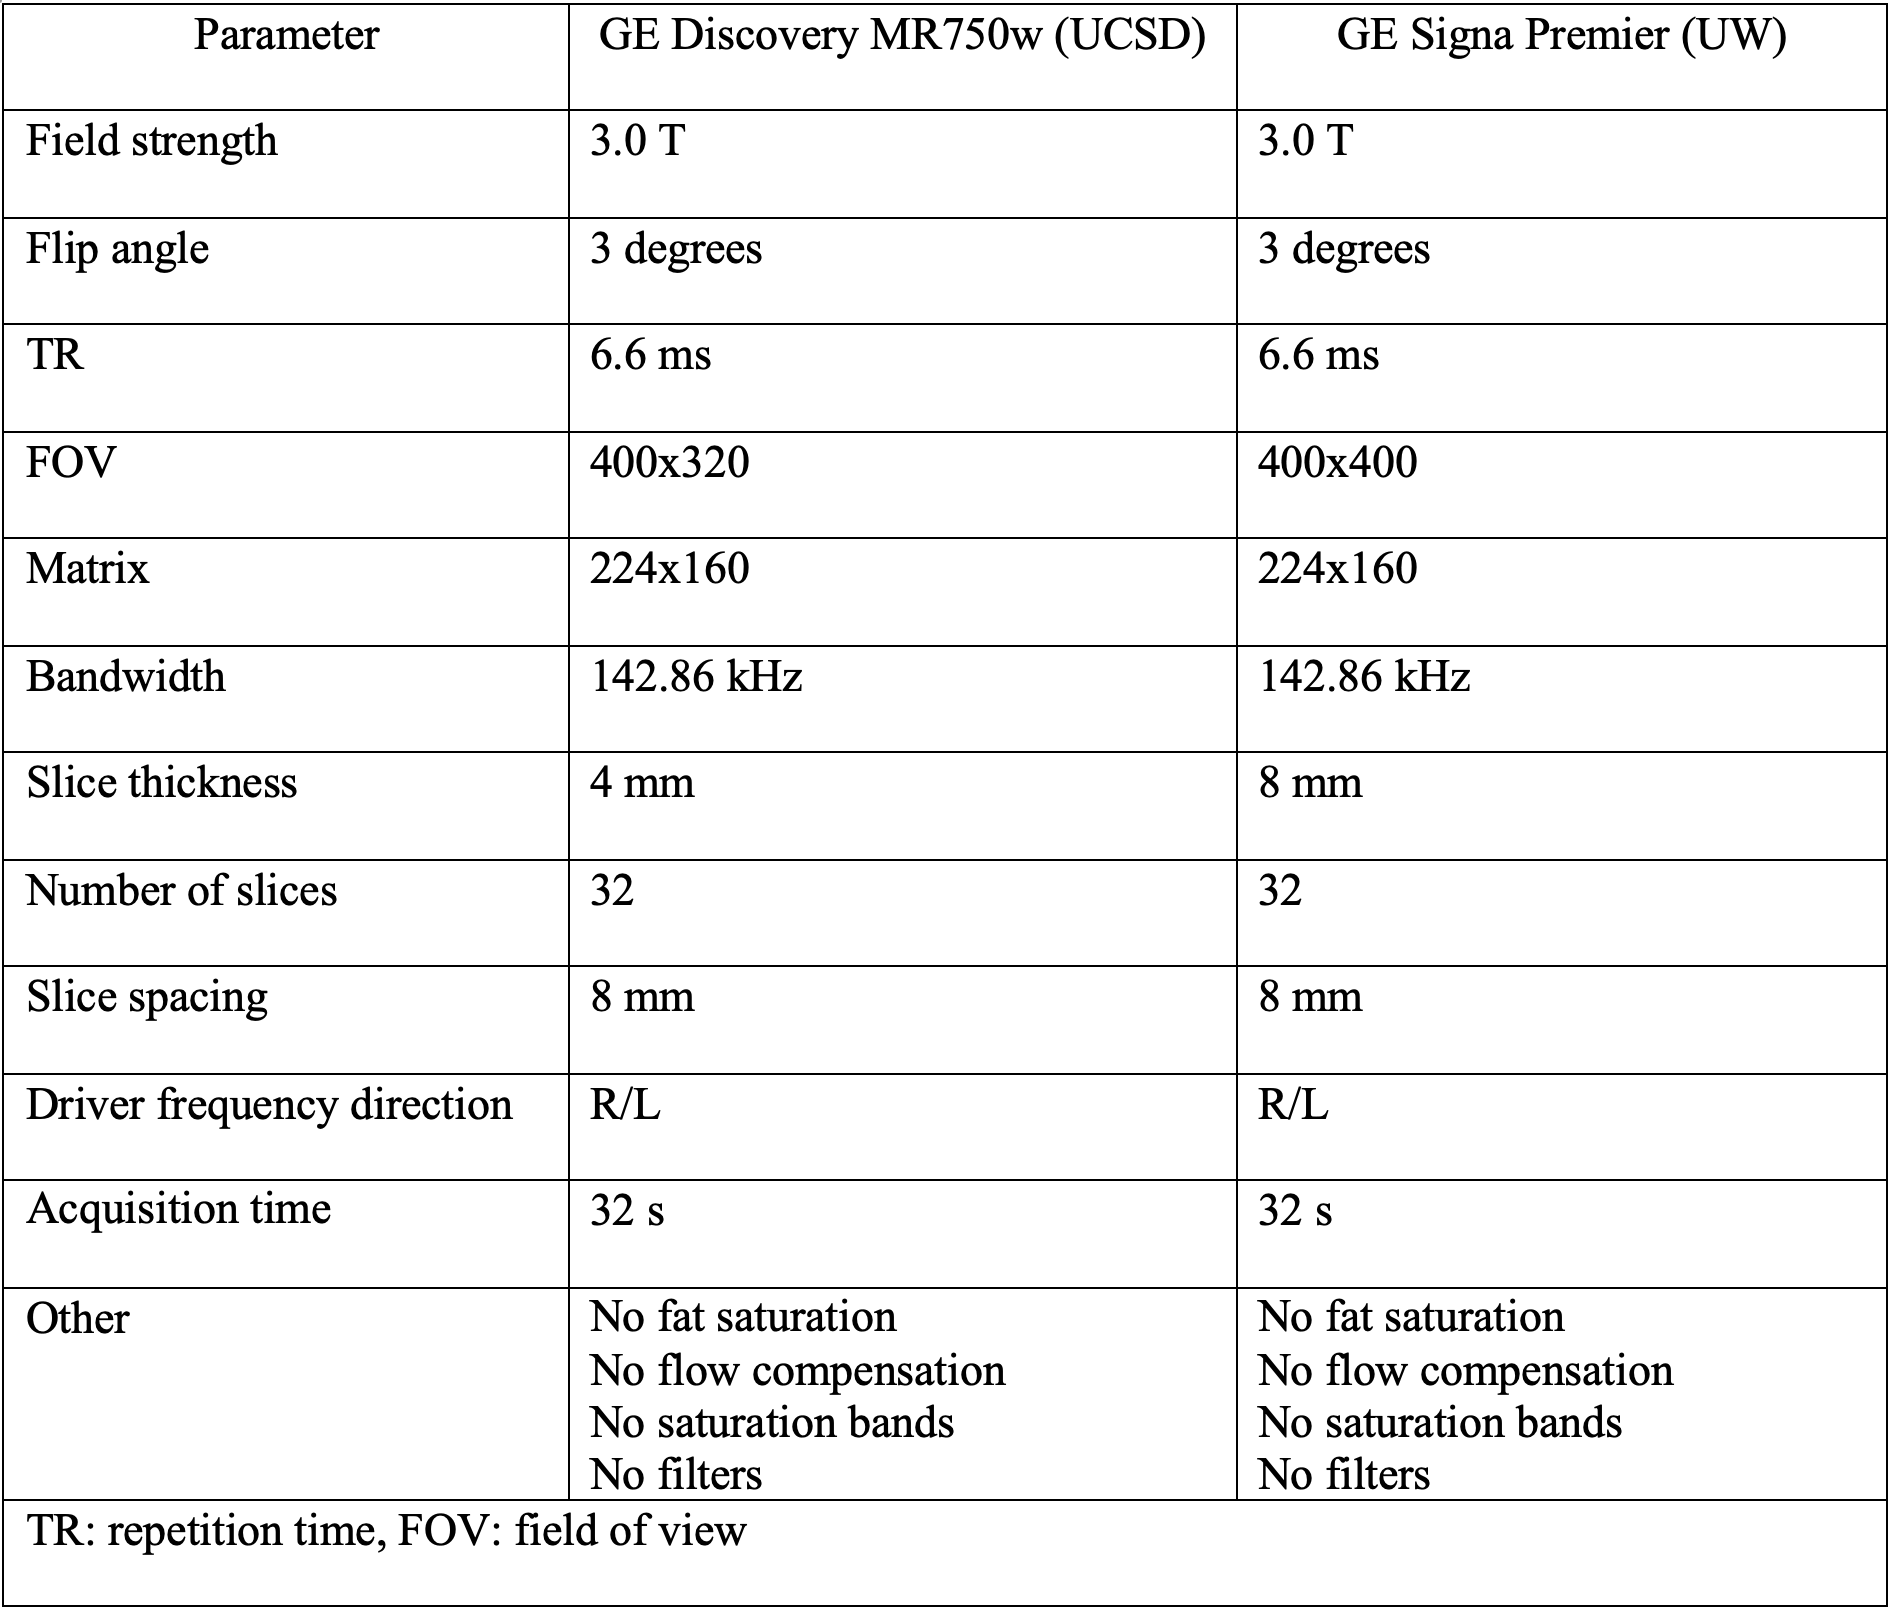
28 obese adults (24 female, 4 male, mean age 48 years) scheduled for bariatric surgery were prospectively recruited to participate in an ongoing research study which includes collection of baseline clinical parameters (age, sex, BMI), serological measurements (lipid panel, HbA1C, glucose, insulin), and non-contrast MR examinations on a 3T scanner (GE Signa Premier, or GE Discovery MR750, GE Healthcare, Waukesha WI) at 2 timepoints pre-bariatric surgery. These two timepoints were at baseline and 2-3 days prior to surgery. During this interval participants were prescribed to follow LCLD for 14-21 days. Imaging parameters included baseline and changes in mean 9-segment proton density fat fraction (PDFF) and liver volume. Liver PDFF was calculated as previously described (7). Liver volume was quantified using a 3D CNN developed at our institution. Fasting blood collection occurred at both visit time points. Bayesian Information Criterion (BIC)-based stepwise linear regression was used to identify potential predictors of liver volume change from the parameters defined above. To assess model superiority, Davidson and MacKinnon encompassing test was performed.Results
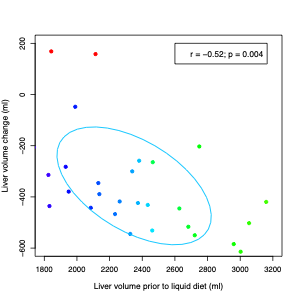
Three models were generated with: 1) Baseline non-imaging parameters; 2) Baseline and changes (between visit 1 and 2) in non-imaging parameters; and 3) Parameters from #2 and baseline imaging parameters. For model 1, no predictors were selected. For model 2, change in triglycerides and the change in HbA1C were selected (model p= 0.025, R2=0.20). For model 3, only the baseline liver volume was selected (model p=0.0043, R2=0.25). Davidson and MacKinnon encompassing test demonstrated the significant superiority of model 3 for the prediction of liver volume change.Discussion
This study suggests that MRI-based liver volume determination outperforms clinical and serological parameters for predicting liver shrinkage following low calorie liquid diet in patients planned for bariatric surgery. This study was limited by small sample size. While there were significant findings, this data will need to be validated within a larger dataset.Conclusion
Liver volume reduction can be modeled using baseline liver volume obtained through automated liver segmentation analysis. This imaging-based model outperforms models based on clinical and serological parameters. This study suggests significant value in obtaining baseline MRI liver imaging in bariatric surgery patients. Further research within larger cohorts is needed to confirm findings and to elucidate the relationship between these factors to better predict outcomes for clinical relevance.Acknowledgements
The parent study for this analysis was funded by NIH grant R01DK088925-09 and Pfizer Inc. 785K610References
1. Sutanto, A., Wungu, C. D. K., Susilo, H. & Sutanto, H. Reduction of major adverse cardiovascular events (Mace) after bariatric surgery in patients with obesity and cardiovascular diseases: A systematic review and meta-analysis. Nutrients 13, 1–19 (2021).
2. Nassour, I., Almandoz, J. P., Adams-Huet, B., Kukreja, S. & Puzziferri, N. Metabolic syndrome remission after Roux-en-Y gastric bypass or sleeve gastrectomy. Diabetes, Metab. Syndr. Obes. Targets Ther. 10, 393–402 (2017).
3. Van Nieuwenhove, Y. et al. Preoperative very low-calorie diet and operative outcome after laparoscopic gastric bypass: A randomized multicenter study. Arch. Surg. 146, 1300–1305 (2011).
4. Schwartz, M. L., Drew, R. L. & Chazin-Caldie, M. Laparoscopic Roux-en-Y Gastric Bypass: Preoperative Determinants of Prolonged Operative Times, Conversion to Open Gastric Bypasses, and Postoperative Complications. Obes. Surg. 13, 734–738 (2003).
5. Tabesh, M. R., Maleklou, F., Ejtehadi, F. & Alizadeh, Z. Nutrition, Physical Activity, and Prescription of Supplements in Pre- and Post-bariatric Surgery Patients: a Practical Guideline. Obes. Surg. 29, 3385–3400 (2019).
6. Luo, R. B. et al. How bariatric surgery affects liver volume and fat density in NAFLD patients. Surg. Endosc. 32, 1675–1682 (2018).
7. Reeder, S. B. & Sirlin, C. B. Quantification of liver fat with magnetic resonance imaging. Magn. Reson. Imaging Clin. N. Am. 18, 337–357 (2010).
Figures