2762
Portal Venous 4D Flow MRI in Obese Patients without Known Liver Disease Undergoing Weight Loss Surgery1Medical Physics, University of Wisconsin- Madison, Madison, WI, United States, 2Computational and Applied Statistics Laboratory, University of California San Diego, La Jolla, CA, United States, 3Radiology, University of Wisconsin- Madison, Madison, WI, United States, 4Radiology and Nuclear Medicine, Universität zu Lübeck, Lübeck, Germany, 5Mechanical Engineering, University of Wisconsin- Madison, Madison, WI, United States, 6Biomedical Engineering, University of Wisconsin- Madison, Madison, WI, United States, 7Radiology, University of California San Diego, San Diego, CA, United States, 8Emergency Medicine, University of Wisconsin- Madison, Madison, WI, United States
Synopsis
4D flow MRI of the portal vein has the potential to provide diagnostic value for detecting and staging certain liver diseases. To date, it is unknown whether weight loss influences portal flow in obese patients. We aimed to investigate the effect of weight loss on portal flow rate measured by non-contrast 4D flow MRI in obese patients undergoing weight loss surgery. Preliminary data of this ongoing study detected no statistically significant change in the mean volumetric portal flow rate in subjects during 2-6 months of weight loss. However, portal flow rate normalized to body weight or BMI increased significantly.
Introduction
Obese individuals have an increased prevalence of non-alcoholic fatty liver disease (NAFLD) which puts them at higher risk for developing cirrhosis.1 Cirrhosis is characterized by flow changes in the portal vein that can be measured using 4D flow MRI. Typical findings include abnormal flow, flow reversal, and portosystemic shunts.2-4Weight loss surgery (WLS) is an effective method to reduce body weight and decrease the risk of NAFLD, in obese individuals. To date, little is known about flow changes in the portal vein in response to changes in body weight because routine Doppler-ultrasound exams are challenging, particularly in severe obesity. 4D flow MRI in patients with high BMI is also challenging because of challenging background phase corrections and residual streaking artifacts from fat.
The purpose of this study was to investigate the mid- and long-term effect of weight loss on portal venous flow rate determined by non-contrast 4D flow MRI in obese patients without known liver disease undergoing WLS.
Methods
Patient cohort: In this ongoing, IRB-approved study, severely obese patients (BMI>35) who were scheduled for WLS were included between 12/2020-9/2021. Patients were imaged upon enrollment (visit 1), 1-3 days prior to surgery after a 2-week low-calorie diet (visit 2), 2-2.5 months after the surgery (visit 3), and 5.5-6 months after surgery (visit 4), (Fig.1).Image Acquisition: 4D flow MRI was acquired at 3.0T after 12 hours of fasting using a 5-point encoded radially undersampled trajectory (PC-VIPR)5,6 covering the upper abdomen: imaging volume=48x48x24cm; resolution=1.25mm3 isotropic; flip=6˚; scan time=11min; TR/TE=6.5ms/2.4ms; fat saturation; retrospective ECG and respiratory gating. Importantly, no intravenous contrast was used.
Data analysis: Offline CINE-reconstruction (conjugate gradient iterative SENSE7, 14 frames) was performed including standard corrections for Maxwell terms and gradient non-linearity. Third-order polynomial background phase correction8 was applied using a custom MATLAB (Mathworks, Natick, MA) tool. Streamline visualizations and measurements were obtained using EnSight (ANSYS, Canonsburg, PA). Volumetric flow rates were measured in the portal venous system with 3 cross sections of interest: caudal (PV1), middle (PV2), and cranial portal vein (PV3), Fig.2a.
Statistical analysis: The mean volumetric flow rate of the portal vein was determined as the mean from planes PV1, PV2, and PV3. We applied single-factor ANOVA to analyze significance of flow and BMI changes over time. We fit patient-specific ordinary least squares (OLS) regressions modeling flow and BMI as a function of time to estimate each patient’s rate of change of the respective measures. Subsequently, we examined the relationship between the BMI and flow rates of change (patient-specific OLS-slopes) using Pearson’s correlation. Values are given as mean±SD.
Results
To date, 15 patients (13 female; 49.4±9.0 years), have been included in this study. Forty-four 4D flow MRI exams were successfully conducted (Fig.2b). Six datasets (14%) were excluded due to insufficient image quality. We analyzed N=11 4D flow MRI datasets from visit 1, N=13 from visit 2, N=15 from visit 3, and N=5 from visit 4, respectively. Patient BMI decreased significantly from 44.6±5.5kg/m² at visit 1 to 36.9±4.8kg/m² at visit 3 (paired t-test, p-value≤0.001, Fig.3a).Mean portal flow rate at visit 1 was 1.15±0.28 L/min. Flow rate did not change significantly over time (p-value=0.67, Fig.3b). Portal flow rate normalized by body weight or BMI demonstrated a significant change over the course of the study (p-value=0.03, and p-value=0.04, respectively, Fig.4). Normalized portal flow rate increased in 10/15 subjects over the course of the study.
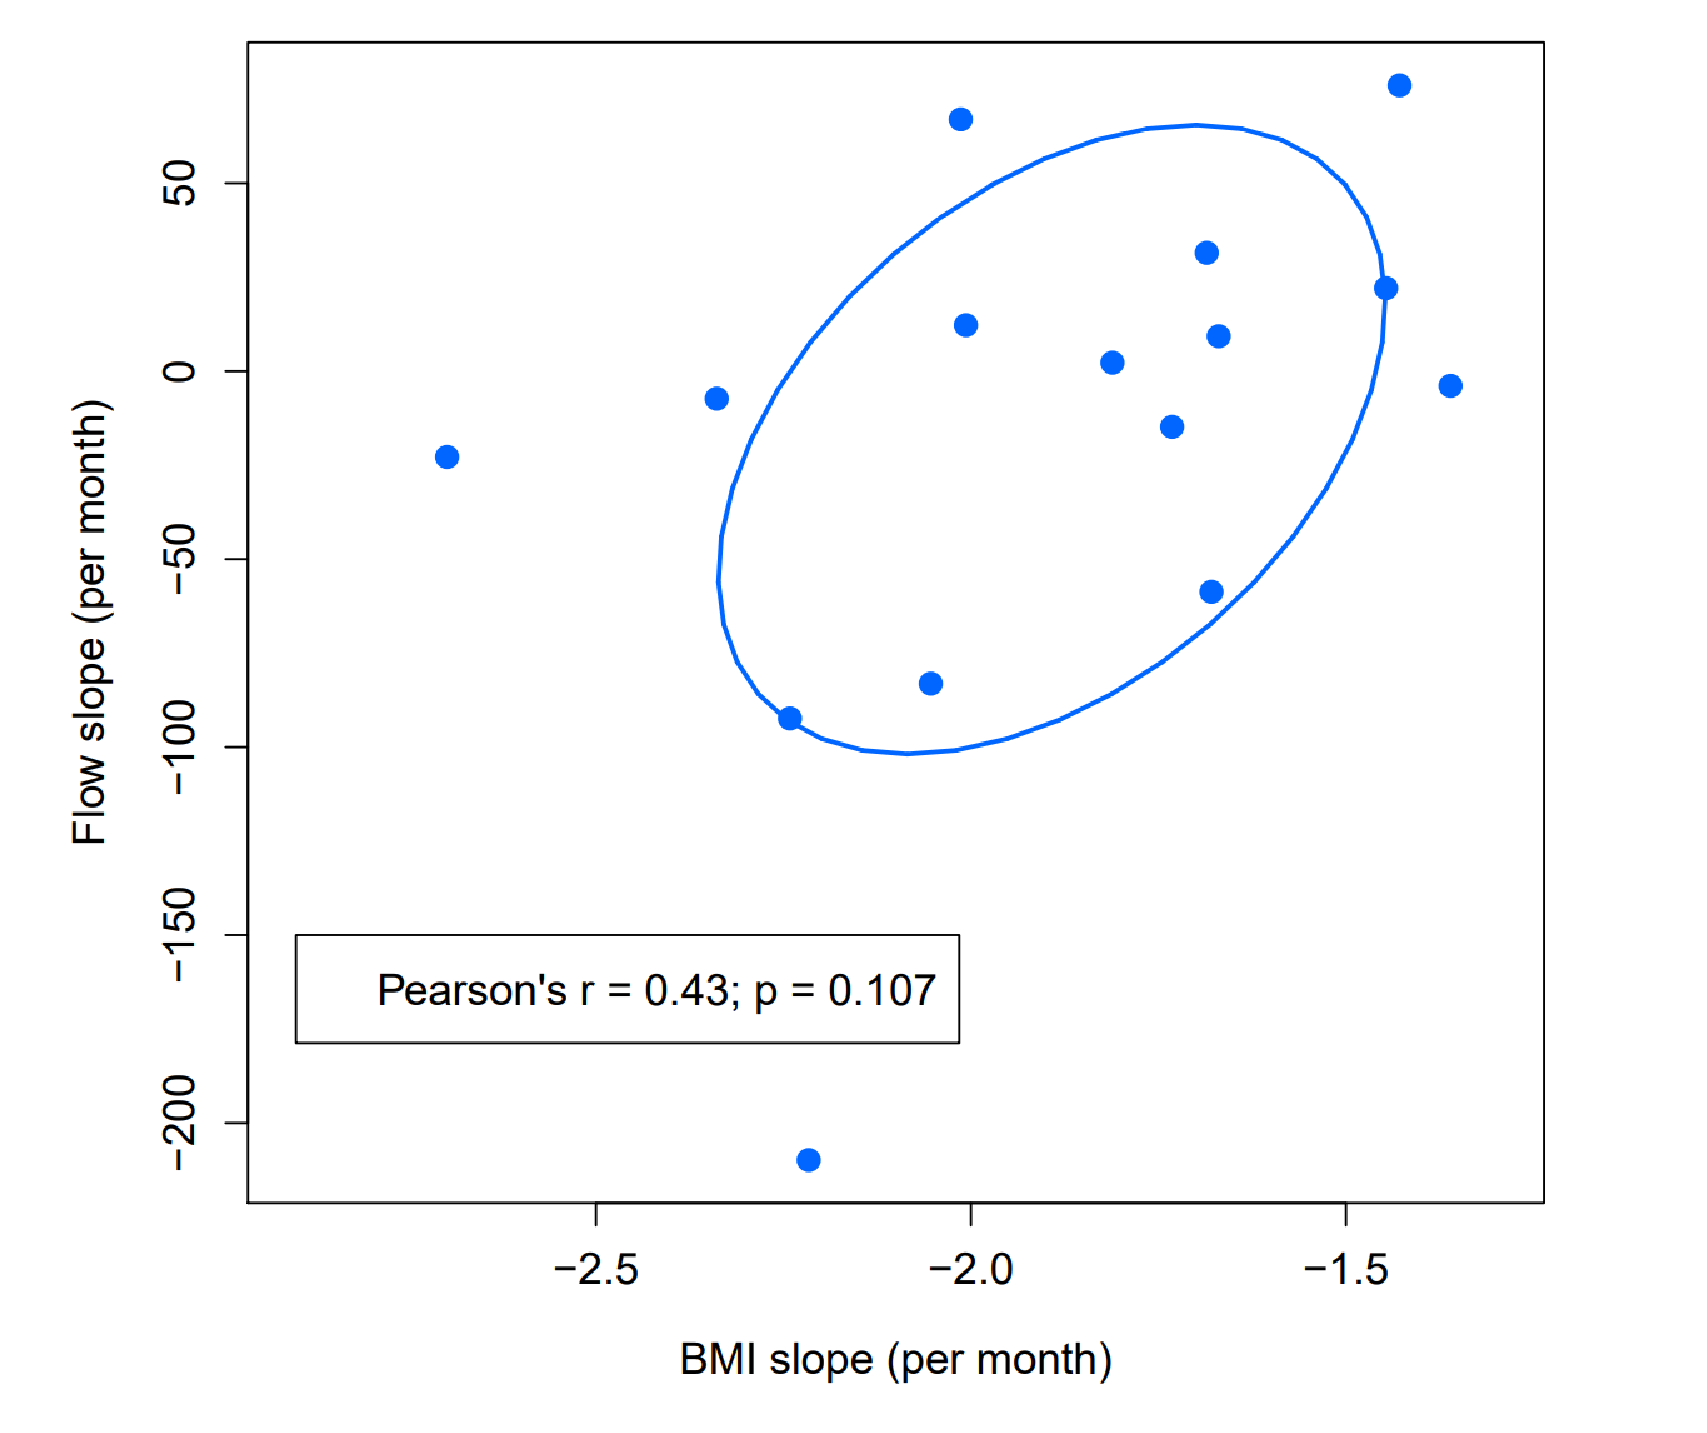
There was a weak correlation between flow change and BMI change (Pearson’s r=0.46, p=0.11): Flow decreased more in patients who lost more weight (Fig.5). This relationship did not reach significance, possibly due to small sample size.
Discussion
The mid- and long-term analysis of absolute portal venous flow rate showed no statistically significant changes after weight loss and WLS. Portal flow rate normalized to body weight or BMI increased significantly.To our knowledge, this is the first study quantifying portal venous flow before and after WLS. 4D flow MRI is challenging in the abdomen, particularly in obese subjects without the use of contrast agents. This makes the rate of 86% diagnostic datasets noteworthy.
Obese study participants presented with portal flow rates within the range of normal reference values reported for 4D flow MRI (mean 0.93-1.1L/min, SD 0.14-0.54L/min)3,9-12. Also, normalized values were within the range of normal as reported for ultrasound measurements (10.5±2.3ml/min/kg13, 13.5±2.9ml/min/kg14).
Three subjects presented with a notable decrease in absolute portal flow rate after the surgery. In contrast, the other subjects did not show relevant change between visit 2 and 3. To date, the relevance of this observation remains unclear. We will review the outcome of these patients after 1 year and compare with other clinical markers such as proton density fat fraction.
The main limitation of this preliminary analysis is the small sample size. However, this is an ongoing study with an enrollment target of 100 subjects. We will investigate a possible correlation of portal flow with other imaging findings and with clinical outcome.
Conclusion
Abdominal non-contrast 4D flow MRI is feasible in severely obese patients. Preliminary results show no significant change in the mean volumetric portal venous flow rate in subjects undergoing weight loss surgery. However, portal flow rate normalized to body weight or BMI increased significantly.Acknowledgements
The authors wish to acknowledge the NIH (R01 DK088925, R01 DK125783) and Pfizer Healthcare for supporting this study, as well as GE Healthcare who provides research support to the University of Wisconsin. Dr. Reeder is a Romnes Faculty Fellow and has received an award provided by the University of Wisconsin-Madison Office of the Vice Chancellor for Research and Graduate Education with funding from the Wisconsin Alumni Research Foundation. Dr. Oechtering receives funding from the German Research Foundation (OE 746/1-1).References
1. Younossi ZM, Koenig AB, Abdelatif D, Fazel Y, Henry L, Wymer M. Global epidemiology of nonalcoholic fatty liver disease-Meta-analytic assessment of prevalence, incidence, and outcomes. Hepatology 2016;64:73-84.
2. Motosugi U, Roldan-Alzate A, Bannas P, et al. Four-dimensional Flow MRI as a Marker for Risk Stratification of Gastroesophageal Varices in Patients with Liver Cirrhosis. Radiology 2019;290:101-7.
3. Roldan-Alzate A, Frydrychowicz A, Said A, et al. Impaired regulation of portal venous flow in response to a meal challenge as quantified by 4D flow MRI. J Magn Reson Imaging 2015;42:1009-17.
4. Stankovic Z, Csatari Z, Deibert P, et al. Normal and altered three-dimensional portal venous hemodynamics in patients with liver cirrhosis. Radiology 2012;262:862-73.
5. Johnson KM, Lum DP, Turski PA, Block WF, Mistretta CA, Wieben O. Improved 3D phase contrast MRI with off-resonance corrected dual echo VIPR. Magn Reson Med 2008;60:1329-36.
6. Johnson KM, Markl M. Improved SNR in phase contrast velocimetry with five-point balanced flow encoding. Magn Reson Med 2010;63:349.
7. Qu P, Zhong K, Zhang B, Wang J, Shen GX. Convergence behavior of iterative SENSE reconstruction with non-Cartesian trajectories. Magnetic Resonance in Medicine 2005;54:1040-5.
8. Walker PG, Cranney GB, Scheidegger MB, Waseleski G, Pohost GM, Yoganathan AP. Semiautomated method for noise reduction and background phase error correction in MR phase velocity data. J Magn Reson Imaging 1993;3:521-30.
9. Brunsing RL, Brown D, Almahoud H, et al. Quantification of the Hemodynamic Changes of Cirrhosis with Free-Breathing Self-Navigated MRI. J Magn Reson Imaging 2021.
10. Roberts GS, Francois CJ, Starekova J, Roldan-Alzate A, Wieben O. Non-invasive assessment of mesenteric hemodynamics in patients with suspected chronic mesenteric ischemia using 4D flow MRI. Abdom Radiol (NY) 2021.
11. Landgraf BR, Johnson KM, Roldan-Alzate A, Francois CJ, Wieben O, Reeder SB. Effect of temporal resolution on 4D flow MRI in the portal circulation. J Magn Reson Imaging 2014;39:819-26.
12. Roldan-Alzate A, Frydrychowicz A, Niespodzany E, et al. In vivo validation of 4D flow MRI for assessing the hemodynamics of portal hypertension. J Magn Reson Imaging 2013;37:1100-8.
13. Ohnishi K, Sato S, Pugliese D, Tsunoda T, Saito M, Okuda K. Changes of splanchnic circulation with progression of chronic liver disease studied by echo-Doppler flowmetry. The American journal of gastroenterology 1987;82:507-11.
14. Carlisle KM, Halliwell M, Read AE, Wells PN. Estimation of total hepatic blood flow by duplex ultrasound. Gut 1992;33:92-7.
Figures