2761
The effect of Gd-EOB-DTPA on liver IVIM imaging of rabbits with non-alcoholic fatty liver disease1Xi’an Gaoxin Hospital, Xi’an, China
Synopsis
Hepatobiliary cell-specific contrast agent of Gd-EOB-DTPA hepatobiliary phase acquisition DWI sequence will not affect lesion display and ADC value [1].Few studies have been performed on the effect of IVIM on hepatic parenchyma and have focused on studies in various hepatic occupancy contexts with discrepant findings [2,3].This study modeled a healthy control group and a non-alcoholic fatty liver disease (NAFLD) group. Gd-EOB-DTPA had no significant effect on the image quality and quantitative index of liver IVIM imaging in two groups, and IVIM scanning in the hepatobiliary waiting interval after placing Gd-EOB-DTPA enhancement helped to improve the examination flow rate.
Introduction:
Gadoxetic acid disodium salt (Gd-EOB-DTPA) is a hepatobiliary cell-specific contrast agent that improves the diagnostic efficacy of hepatic reserve function and diffuse liver disease [4]. Current studies have shown that Gd-EOB-DTPA hepatobiliary phase acquisition DWI sequences will not affect lesion display and ADC value determination [1]. The effect of Gd-EOB-DTPA on hepatic parenchymal IVIM has been little studied and is mainly based on studies in various hepatic occupancy contexts, where the functional status of hepatocytes may differ and the ability to take up Gd-EOB-DTPA may also vary. In order to obtain more accurate results, the present study modeled rabbit NAFLD group and healthy control group to analyze the effect of Gd-EOB-DTPA on the quality, reproducibility and quantitative index of liver IVIM images in a more in-depth and precise manner.Methods:
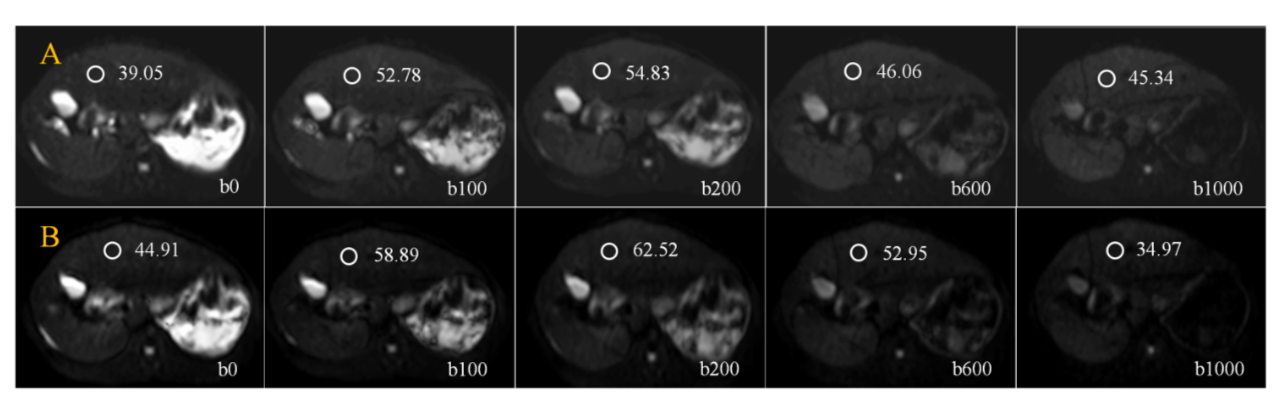
This study was approved by the institutional animal care and use committee. 42 healthy male New Zealand White Rabbits (6-8 months age) each weighing 2.2-2.5kg were divided into normal diet control group (n= 10) and high-fat diet NAFLD group (n= 32). Control group was fed with standard diet, and NAFLD group was fed with high-fat diet (88% standard diet + 10% lard + 2% cholesterol) [19]. All examinations of NAFLD group were performed at 4 weeks, 8 weeks, 12 weeks and 16 weeks (each n = 8) respectively. Rabbits underwent axial liver IVIM and other sequences (T1WI、T2WI、Dixon) on a 3.0T MR scanner (Skyra, SIEMENS) pre- and post-enhancement(0.025 mmol/ kg) (17~22 minutes delay). A region of interest (ROI) was manually placed by three radiologists with 6- and 10-years’ experience on the location of the bottom of the gallbladder, three circular ROIs with an area of 40~50mm2 were selected in the left lateral lobe, left medial lobe and right lobe of the liver to avoid the main blood vessels and artifacts. The intraclass correlation coefficient (ICC) was used to evaluate the consistency of the three observers. The paired t-test or non-parametric test was used to compare the differences in liver SNR, D, D*, and PF values of the control group and the NAFLD group between pre- and post-enhancement.Results:
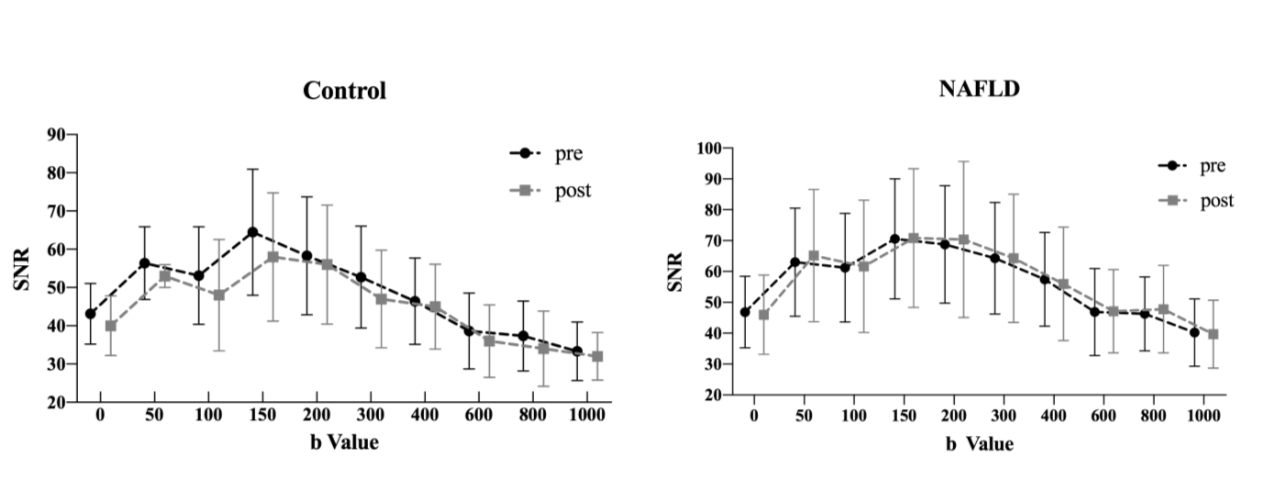
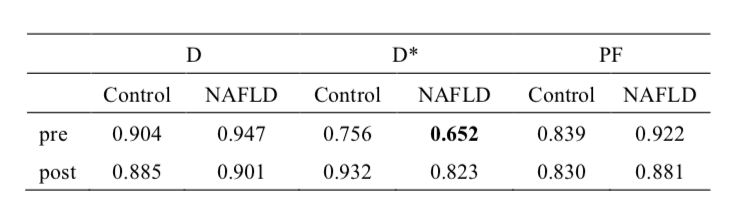
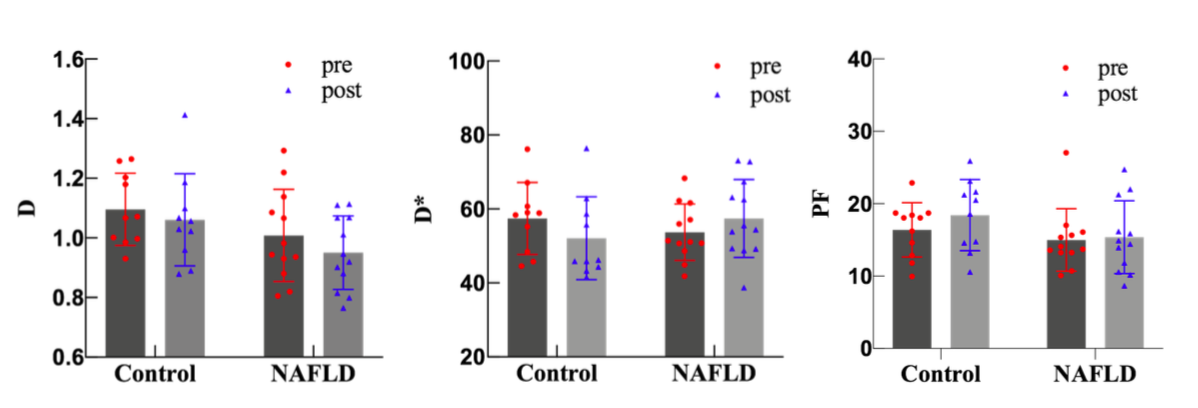
There were 28 rabbits were finally underwent liver IVIM scan pre- and post-enhancement IVIM scan. Excluding those who died during the feeding process (5 rabbits), and that with excessive intestinal artifacts seriously affecting the image quality (1 rabbit). There were 22 rabbits were finally included for analysis (12 in the NAFLD group and 10 in the control group). Except for the general consistency of D* values pre-enhancement in the NAFLD group, the D values, PF values and D* values of pre- and post-enhancement were all in good agreement (Table1). In NAFLD group and control group, the difference in SNR (Figure 1~2) and D, D* and PF values (Figure3) of each b-value DWI image before and after liver parenchymal enhancement were not statistically significant (P>0.05).Discussion:
The concentration of water molecules in the blood was significantly higher than the maximum blood concentration (0.2 mmol/ml) at the conventional injectable dose of Gd-EOB-DTPA [5], which is presumed to be an insignificant effect of Gd-EOB-DTPA enhancement before and after on D* and PF values reflecting blood flow rate and blood volume in the NAFLD and control groups. In addition, it was reported that after selective uptake of Gd-EOB-DTPA by functional hepatocytes, water molecules maintained free diffusive motion around it, and the effect on D values, which represent the diffusive motion ability of water molecules, could be neglected [6,7].Conclusion:
Gd-EOB-DTPA had no significant effect on the image quality and quantitative index of liver IVIM imaging in healthy controls and NAFLD group, and IVIM scanning in the hepatobiliary waiting interval after placing Gd-EOB-DTPA enhancement helped to improve the examination flow rate.Acknowledgements
NOReferences
[1] Colagrande S, Mazzoni LN, Mazzoni E, et al. Effects of gadoxetic acid on quantitative diffusion-weighted imaging of the liver[J]. Journal of Magnetic Resonance Imaging, 2013, 38(2):365-370.
[2] Saito K, Yoshimura N, Shirota N, et al. Distinguishing liver haemangiomas from metastatic tumours using gadolinium ethoxybenzyl diethylenetriamine pentaacetic acid-enhanced diffusion-weighted imaging at 1.5T MRI[J]. Journal of Medical Imaging and Radiation Oncology, 2016, 60(5):599-606.
[3] Tang YH, Wang YW, Yan Fei, et al. The effect of gadolinium disodium on the focal lesions of the right liver lobe and the measurement of incoherent motion parameters in the voxel of the right liver lobe [J]. Chinese Journal of Medical Imaging, 2020,28(6):5
[4] Shi Z, Cai W, Feng X, et al. Radiomics Analysis of Gd-EOB-DTPA Enhanced Hepatic MRI for Assessment of Functional Liver Reserve[J]. Academic Radiology, 2021(3).
[5] Colagrande S, Mazzoni LN, Mazzoni E, et al. Effects of gadoxetic acid on quantitative diffusion-weighted imaging of the liver[J]. Journal of Magnetic Resonance Imaging, 2013, 38(2):365-370.
[6] Schering AG Global Business Unit Diagnostic Imaging. Primovist product monog raph. 1st edition, February 2005, Schering AG, 13342 Berlin, Germany.
[7] Lee NK, Kim S, Lee JW, et al. Biliary MR imaging with Gd-EOB-DTPA and its clinical applications[J]. Radiographics, 2009, 29(6):1707-1724.
Figures