2760
Magnetic resonance mapping with calculation of extracellular volume fraction allows for a reliable assessment of liver cirrhosis severity1Department of Diagnostic and Interventional Radiology, University Hospital Bonn, Bonn, Germany, 2Department of Internal Medicine I, University Hospital Bonn, Bonn, Germany, 3Center for Cirrhosis and Portal Hypertension Bonn (CCB), University Hospital Bonn, Bonn, Germany
Synopsis
Assessment of disease severity in patients with liver cirrhosis is of great clinical importance and allows outcome prediction and overall mortality risk estimation. In the present study, we investigated the diagnostic utility of MRI-derived extracellular volume fraction (ECV) for the assessment of liver cirrhosis severity and differentiation between different Child-Pugh classes. Our study results demonstrated a high diagnostic performance of ECV for the assessment of liver cirrhosis severity and offer a reliable discrimination between different Child-Pugh classes. ECV might be a new quantitative marker for the assessment of liver cirrhosis severity, which can be calculated from quantitative liver MRI.
Chronic liver disease and liver cirrhosis remains - with an increasing incidence – a major cause of morbidity and mortality1. Liver cirrhosis is related to life-threatening complications. Therefore, prognosis estimation is crucial for clinical decision making in this patients’ population. For this purpose, different methods and scores have been developed of which the most validated is the Child-Pugh score. Imaging also plays an important role for prognosis estimation and complication assessment in cirrhotic patients. In this regard, magnetic resonance imaging (MRI) belongs currently to the standard of care in cirrhotic patients. Several MRI techniques have been tried out to assess the functional aspect of liver disease/cirrhosis severity. In this regard, quantitative T1 mapping with extracellular volume fraction (ECV) calculation seems to be a promising technique. The aim of this study was to investigate the diagnostic utility of ECV for the assessment of liver cirrhosis severity and differentiation between different Child-Pugh classes.
Materials and Methods
This retrospective study was approved by the local institutional review board with waived informed consent. Between January 2019 and September 2020 patients with confirmed diagnosis of liver cirrhosis, who underwent multiparametric liver MRI were identified. All cirrhotic patients were categorized into three groups based on Child-Pugh classes of cirrhosis severity: A, B and C. Additionally, control subjects with no history of liver disease were included. Model of End-Stage Liver Disease (MELD) was calculated. All scans were conducted on a 1.5 Tesla MRI (Philips Ingenia). For T1 mapping, a heart rate independent 10-(2)-7-(2)-5-(2)-3-(2) modified Look-Locker inversion recovery acquisition scheme with internal triggering was applied before and 10 minutes after contrast media application. The ECV was calculated with ROI-based values using following equation2: ECV = (1 − hematocrit) × (ΔR1liver/ΔR1blood), where R1 = 1/T1. All image analysis was performed by two board-certified radiologists blinded to the clinical data. For statistical analysis ANOVA followed by Tukey´s multiple comparison tests, Spearman’s correlation coefficient, and ROC analysis were used. A P value <0.05 was considered as statistically significant.
Results
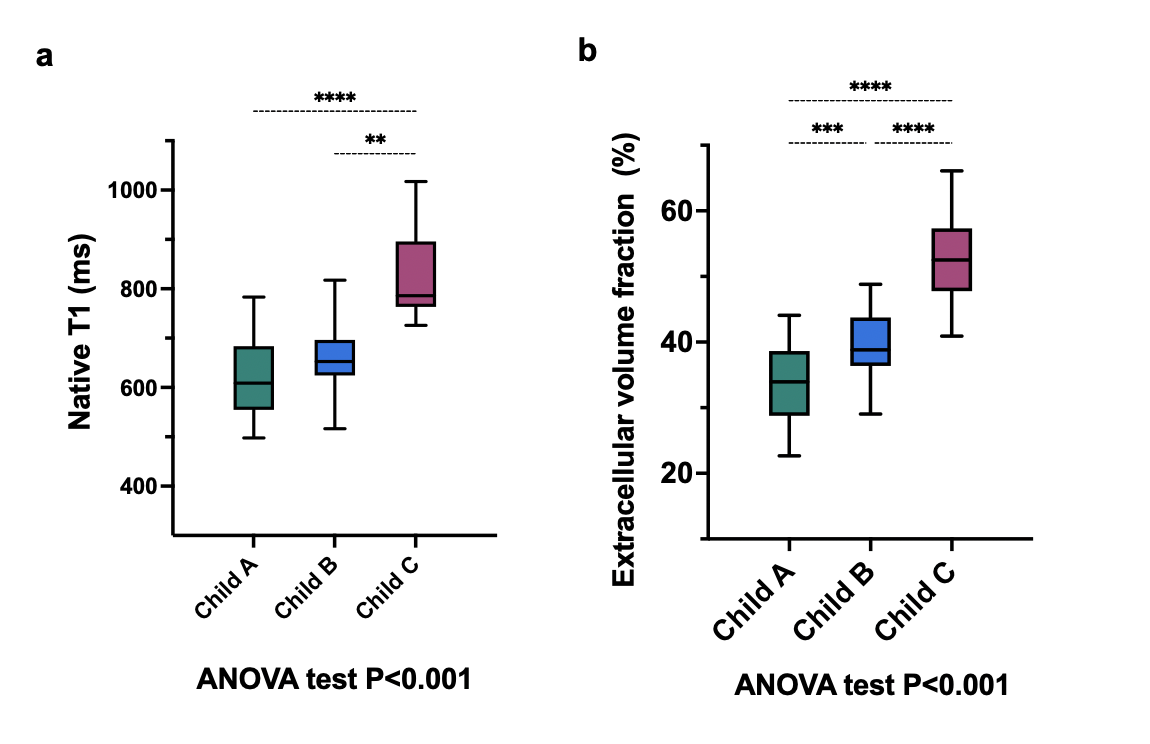
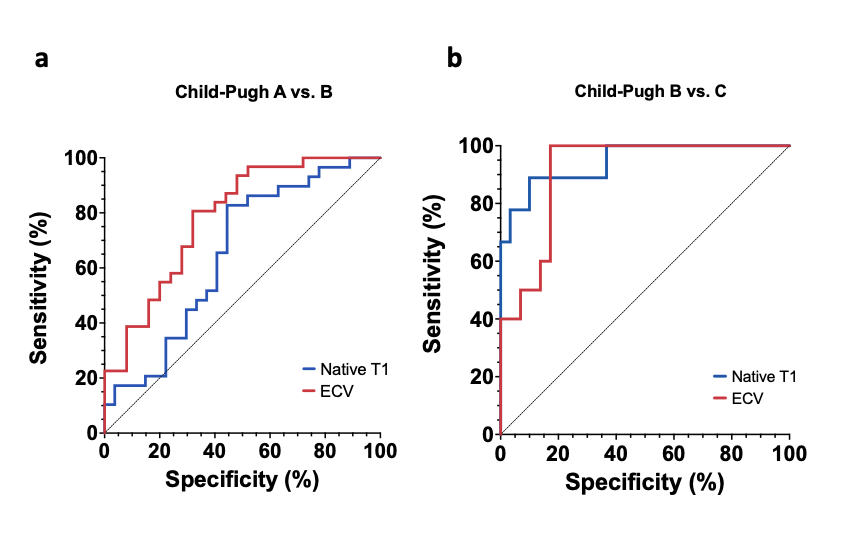
A total 68 patients with liver cirrhosis (mean age: 55±13 years, 27 female) and 22 control subjects (mean age: 46±16, 8 female) were included. A total of 27 (40%), 32 (47%), 9 (13%) of patients with cirrhosis had Child-Pugh classes A, B and C, respectively. Hepatic T1 relaxation times were significantly higher in cirrhotic patients than in control subjects (518.6±47.9 ms) and increased depending on Child-Pugh class: 620.5±78.9 ms (Child-Pugh A) vs. 666.6 ±74.3 ms (Child-Pugh B) vs. 828.4±91.2 ms (Child-Pugh C) (P<0.001). Hepatic ECV values were significantly higher in cirrhotic patients than in control subjects (25.9±4.5%) and also increased depending on Child-Pugh class: 33.3±6.0% (Child-Pugh A) vs. 39.6±4.9% (Child-Pugh B) vs. 52.8±1.2% (Child-Pugh C) (P<0.001), see also Figures 1 and 2. There were significant differences in hepatic ECV between cirrhotic patients of all Child-Pugh classes (P<0.001). Hepatic native T1 (r=0.45, P<0.001) and ECV (r=0.64, P<0.001) correlated with Child-Pugh score. Hepatic ECV revealed the highest diagnostic performance for differentiation between Child-Pugh classes A and B, as well as B and C, with an AUC of 0.785 (cutoff value: >36.2%, sensitivity of 86.2%, specificity of 55.6%) and 0.944 (cutoff value: >46.9%, sensitivity of 88.9%, specificity of 90%), respectively. The diagnostic performance of hepatic native T1 relaxation times was lower than that of ECV for differentiating between Child-Pugh scores A and B as well as between Child-Pugh score B and C with an AUC of 0.651 (cutoff: >620.3ms, sensitivity of 86.2%, specificity of 55.6%) and 0.910 (cutoff: >722ms, sensitivity of 100%, specificity of 82.8%) (P<0.05, respectively), see also Figure 3. The diagnostic performance of MELD score was lower than that of the both hepatic native T1 and ECV (P<0.05).
Discussion
It is known that liver fibrosis leads to prolongation of T1 relaxation times and expansion of extracellular space and as a consequence, to the accumulation of the extracellular contrast agent in the extracellular space, which is reflected in increased ECV values3,4. In our study we extended the applicability of T1 mapping techniques to the assessment of liver cirrhosis severity. We demonstrated a high diagnostic performance of mapping parameters to discriminate between different cirrhosis classes, which was also higher than that of the MELD score. This can be explained by the fact that for the calculation of clinical and laboratory scores different markers are used, which decrease the specificity of these scores as changes outside the liver contribute to the final score. In contrast to clinical scores, T1 mapping with calculation of ECV seems to be more liver-specific. The calculation of ECV could improve the clinical management in cirrhotic patients without adding any costs and burdens in patients’ care.
Conclusion
Our study results suggest that MRI-derived ECV is a reliable marker for the assessment of cirrhosis severity and can help to differentiate between different Child-Pugh classes. We, therefore, suggest the use of combined clinical- and imaging-based approach to improve the outcome prediction, risk stratification, and clinical decision making in cirrhotic patients. Further prospective studies are needed to validate these findings in a larger population to enable the implementation of ECV into a routine clinical practice.
Acknowledgements
None.References
1. Asrani SK, Devarbhavi H, Eaton J, Kamath PS (2019) Burden of liver diseases in the world. J Hepatol 70(1):151–171.
2. Schelbert EB, Messroghli DR (2016) State of the Art: Clinical Applications of Cardiac T1 Mapping. Radiology 278(3):658–676.
3. Luetkens JA, Klein S, Traeber F et al. (2018) Quantitative liver MRI including extracellular volume fraction for non-invasive quantification of liver fibrosis: a prospective proof-of-concept study. Gut 67(3):593–594.
4. Mesropyan N, Kupczyk P, Dold L et al. (2021) Non-invasive assessment of liver fibrosis in autoimmune hepatitis: Diagnostic value of liver magnetic resonance parametric mapping including extracellular volume fraction. Abdom Radiol 46(6):2458–2466.
Figures