2759
LIA (Liver Shear Stiffness, INR, Etiology) Score Predicts Risk of Further Decompensation in Patients with Decompensated Cirrhosis1The third affiliated hospital of Sun Yat-sen University, Guangzhou, China, 2Mayo Clinic College of Medicine, Mayo Clinic, Rochester, MN, United States
Synopsis
In patients who have been clinically diagnosed with decompensated cirrhosis (DC), progression to more advanced decompensation is associated with high mortality. Therefore, the early detection of the risk of further decompensation is helpful to formulate individual treatment and follow-up schedules for patients with DC. Liver stiffness is a potential prognosis biomarker for patients with cirrhosis. This study evaluated MR elastography (MRE) as a tool to predict the risk of further decompensation. By integrating MRE-assessed liver stiffness with clinical information, we developed a risk score that is valuable for predicting further decompensation in patients with DC.
Introduction
Cirrhosis – the end stage of hepatic fibrosis –constitutes the fifth‐leading cause of adult deaths and the eighth-highest economic cost among major illnesses 1. Decompensated cirrhosis (DC) is characterized by the development of related clinical events, including ascites, gastrointestinal bleeding, encephalopathy, and jaundice. In a comprehensive risk stratification of the whole course of DC proposed by D’Amco 2, further decompensation is an advanced state of DC with any combination of two events and the 5-year mortality rate is high up to 88%. Moreover, patients with only one decompensating event or re-compensating from a decompensated state still have a high risk of further decompensation development 3-4. Therefore, the early detection of the risk of further decompensation is helpful to formulate individual treatment and follow-up schedules and improve the prognosis and quality of life for patients with DC. However, the predictive performance of standard clinical prognosis models (like MELD, CLIF-C ADs, etc.) for the risk of further decompensation is unclear. And the tool integrated by liver stiffness and clinic information to predict the risk of further decompensation is lacking. The aim of this study was to develop a risk model based on MRE to predict further decompensation in patients with DC and to compare its predictive value with that of other models.Methods
Cirrhotic patients with only one decompensating event or re-compensating from a decompensated state who underwent 3D-MRE and conventional MRI from 01 January 2015 to 31 December 2019 were enrolled in this study. Enrolled patients underwent conventional MRI and MRE examinations using a 3.0T MR system (Discovery MR750, GE Healthcare) with an eight-channel, phased-array torso coil. The MR protocols also included routine anatomic MRI and dynamic contrast enhancement of the liver. 3D-MRE was performed before administering intravenous contrast agents, using a 32-slices, flow-compensated, spin-echo echo-planar imaging, MRE sequence. For each patient, the liver shear stiffness (LSS) was reported as the mean and standard deviation (SD) of a single volumetric region of interest (ROI) manually drawn to encompass as much of the liver as possible that had substantial wave propagation based on visual evaluation by two experienced analysts. MRE magnitude and phase/wave images were used to guide the ROI placement while avoiding major vessels, focal liver lesions, liver boundaries, and regions with significant wave interference or artifacts. The entire ROI drawing and volume mean stiffness calculation process was performed using the ITK-SNAP software package (version 3.8.0, Cognitica, Philadelphia, PA, USA).After the examination of MRE, patients were follow-up regularly for the development of further decompensation. A risk model was developed by the Cox proportional hazards model and simplified as a scoring system. Predictive performance was assessed with the time-dependent area under the receiver operating characteristic curve (AUC) analysis.Results
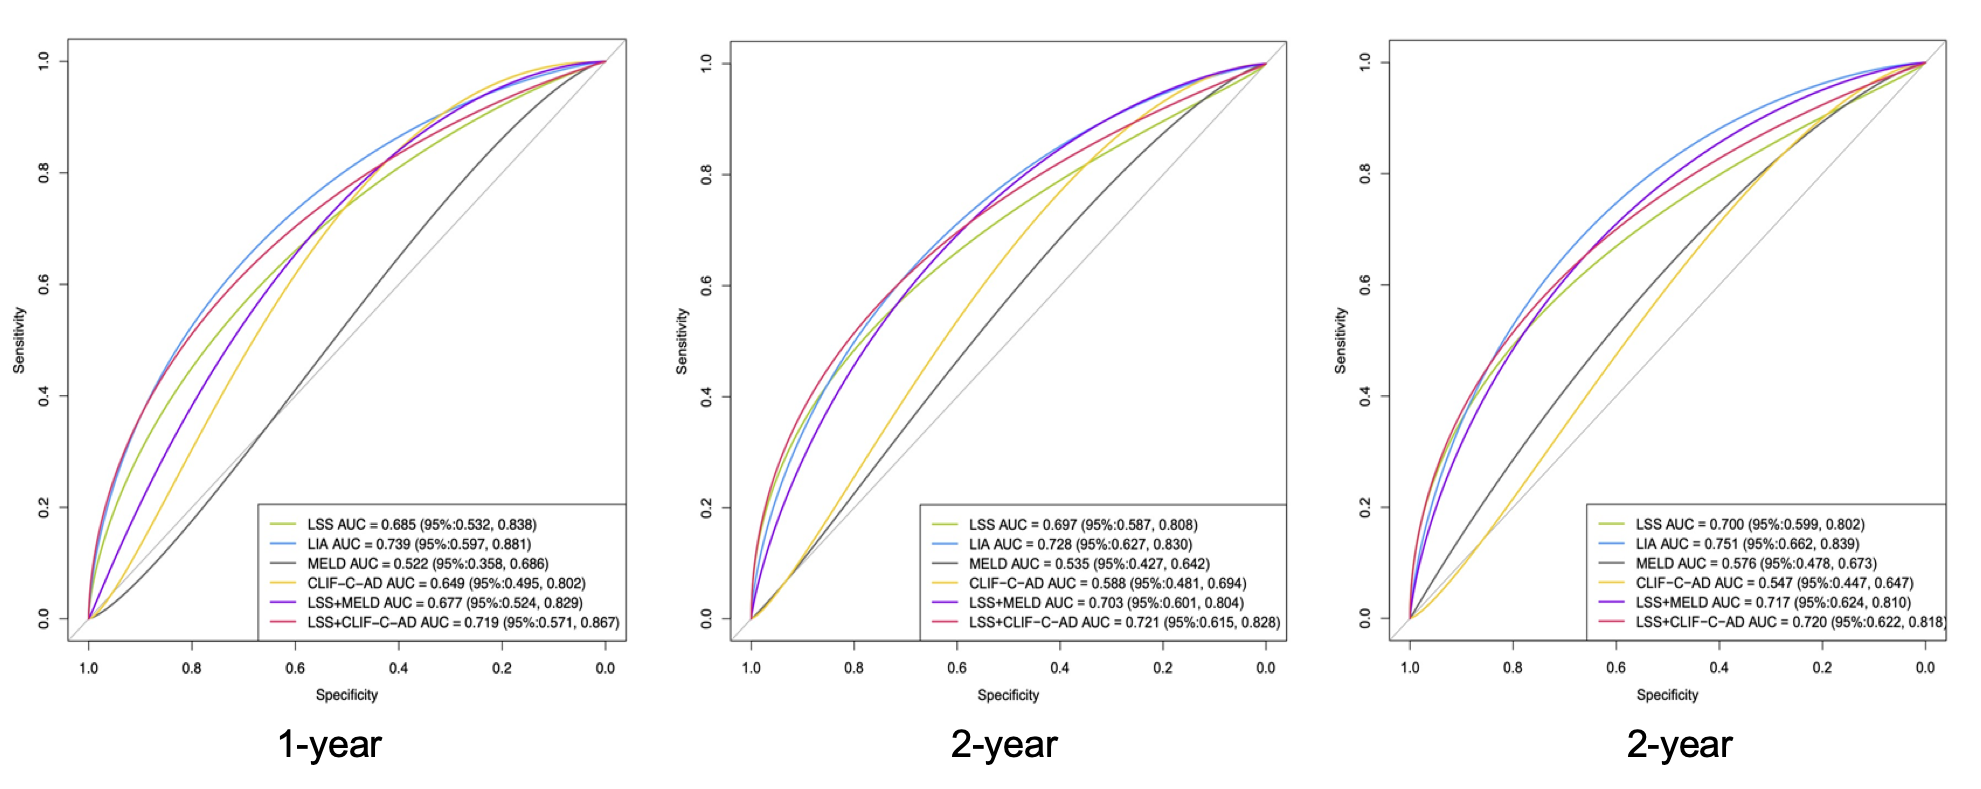
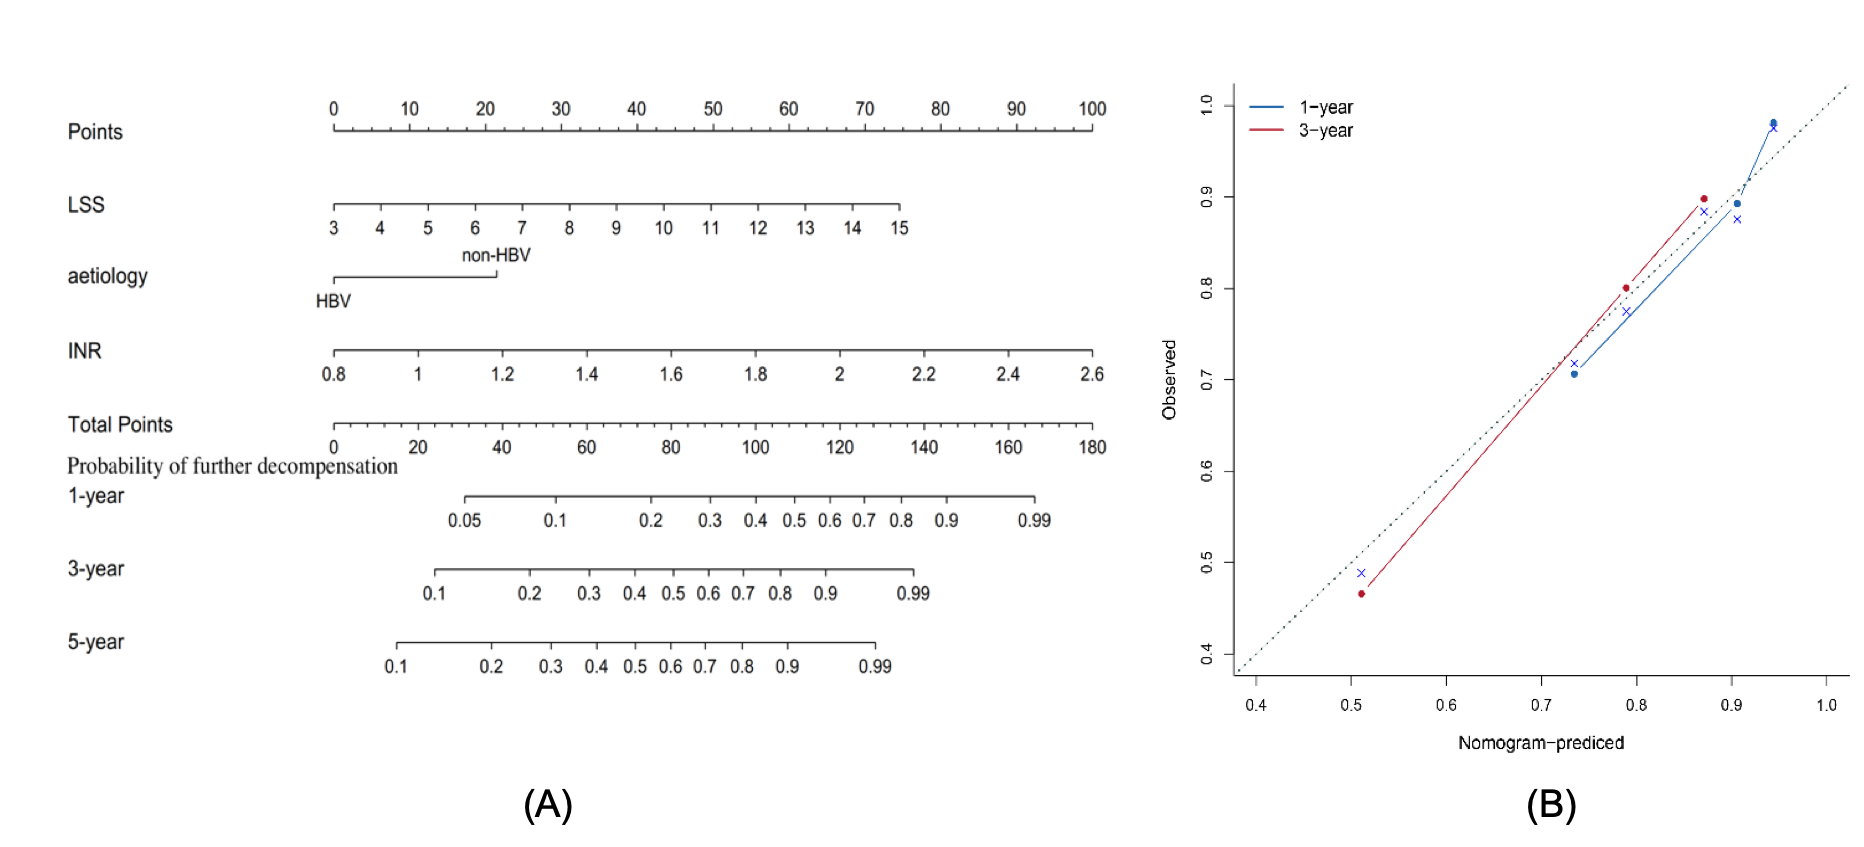
With a median follow-up of 29 months (range 1 to 63 months), 38 (22.9%) of 166 patients had only one decompensating event or re-compensating developed to further decompensation. In the result of multivariate regression, LSS (HR 1.218; 95%CI 1.058-1.403; p=0.006) and INR (HR 4.797; 95%CI 1.453-15.840; p=0.010) were independent predictors for risk of further decompensation development. Etiology had an association with the risk of further decompensation development (HR 1.959; 95%CI 0.904-4.246; p=0.089). The variables of LSS, INR, and type of etiology were weighted to develop the risk score (abbreviated as LIA score). As shown in Figure 1, LIA score (AUC 0.751, 95%CI 0.663-0.839) was superior in predicting the development of further decompensation compared to MELD (AUC 0.576, 95%CI 0.478-0.673, p<0.005) or CLIF-C ADs (AUC 0.547, 95% CI 0.447-0.647, p<0.006). The cut-off value (108) of LIA score can effectively stratify the risk of disease progression in patients with first decompensation or re-compensating from a decompensated state (HR 4.674; 95%CI 2.345-9.281, p<0.001).Discussion
Our study found that patients’ baseline LSS measured by MRE is associated with the risk of further decompensation. Moreover, compared with MELD and CLIF-C ADs, the MRE-based LIA score can be more effectively stratify the risk of further decompensation in patients with only one decompensating event or re-compensating from a decompensated state. As a quantitative biomarker, LSS has been proved to be not only related to the degree of fibrosis, but also to portal pressure and inflammation 5-6. Therefore, the new risk score (LIA score) based on MRE can be helpful for the stratified management of patients with first decompensation and the development of a personalized follow-up plan.Conclusion
The results indicate that the MRE-based LIA score can predict the risk of further decompensation in patients with only one decompensating event or re-compensating from a decompensated state.Acknowledgements
The authors state that this study has received funding from the National Natural Science Foundation of China grant 91959118 (JW), Science and Technology Program of Guangzhou, China 201704020016 (JW), Clinical Research Foundation of the 3rd Affiliated Hospital of Sun Yat-Sen University YHJH201901 (JW), and Guangdong Basic and Applied Basic Research Foundation (No.2021A1515010582) (JW).References
1. Scaglione S, Kliethermes S, Cao G, Shoham D, Durazo R, Luke A, et al. The epidemiology of cirrhosis in the United States: A population-based study. J Clin Gastroenterol. 2015;49:690-696.
2. D’Amico G, Pasta L, Morabito A, D’Amico M, Caltagirone M, Malizia G, et al. Competing risks and prognostic stages of cirrhosis: A 25-year inception cohort study of 494 patients. Aliment Pharmacol Ther. 2014;39:1180-1193.
3. Tonon M, Piano S, Gambino CG, Romano A, Pilutti C, Incicco S, et al. Outcomes and mortality of grade 1 ascites and recurrent ascites in patients with cirrhosis. Clin Gastroenterol Hepatol 2021;19:358-366.
4. Lens S, Baiges A, Alvarado E, LLop E, Martinez J, Fortea JI, et al. Clinical outcome and hemodynamic changes following HCV eradication with oral antiviral therapy in patients with clinically significant portal hypertension. J Hepatol 2020;73:1415-1424.
5. Jansen C, Möller P, Meyer C, Kolbe CC, Bogs C, Pohlmann A, et al. Increase in liver stiffness after transjugular intrahepatic portosystemic shunt is associated with inflammation and predicts mortality. Hepatology 2018;67:1472-1484.
6. Yin M, Talwalkar JA, Glaser KJ, Venkatesh SK, Chen J, Manduca A, et al. Dynamic postprandial hepatic stiffness augmentation assessed with MR elastography in patients with chronic liver disease. AJR Am J Roentgenol 2011;197:64-70.
Figures