2758
Radiomics models based on mDixon for simultaneous liver steatosis, fibrosis and iron deposition quantification of chronic liver disease1Third Affiliated Hospital of Soochow University & First People's Hospital of Changzhou, changzhou, China, 2Philips Healthcare, shanghai, China
Synopsis
To assess the diagnostic performance of radiomics analysis based on mDixon Quant in simultaneously quantifying liver steatosis, fibrosis and iron deposition of chronic liver disease (CLD) and eliminating the interaction of histopathological factors.
Purpose
To assess the diagnostic performance of radiomics analysis based on mDixon in quantifying pathological features of CLD and eliminating the interaction of coexisting liver histopathological factors.Materials and Methods
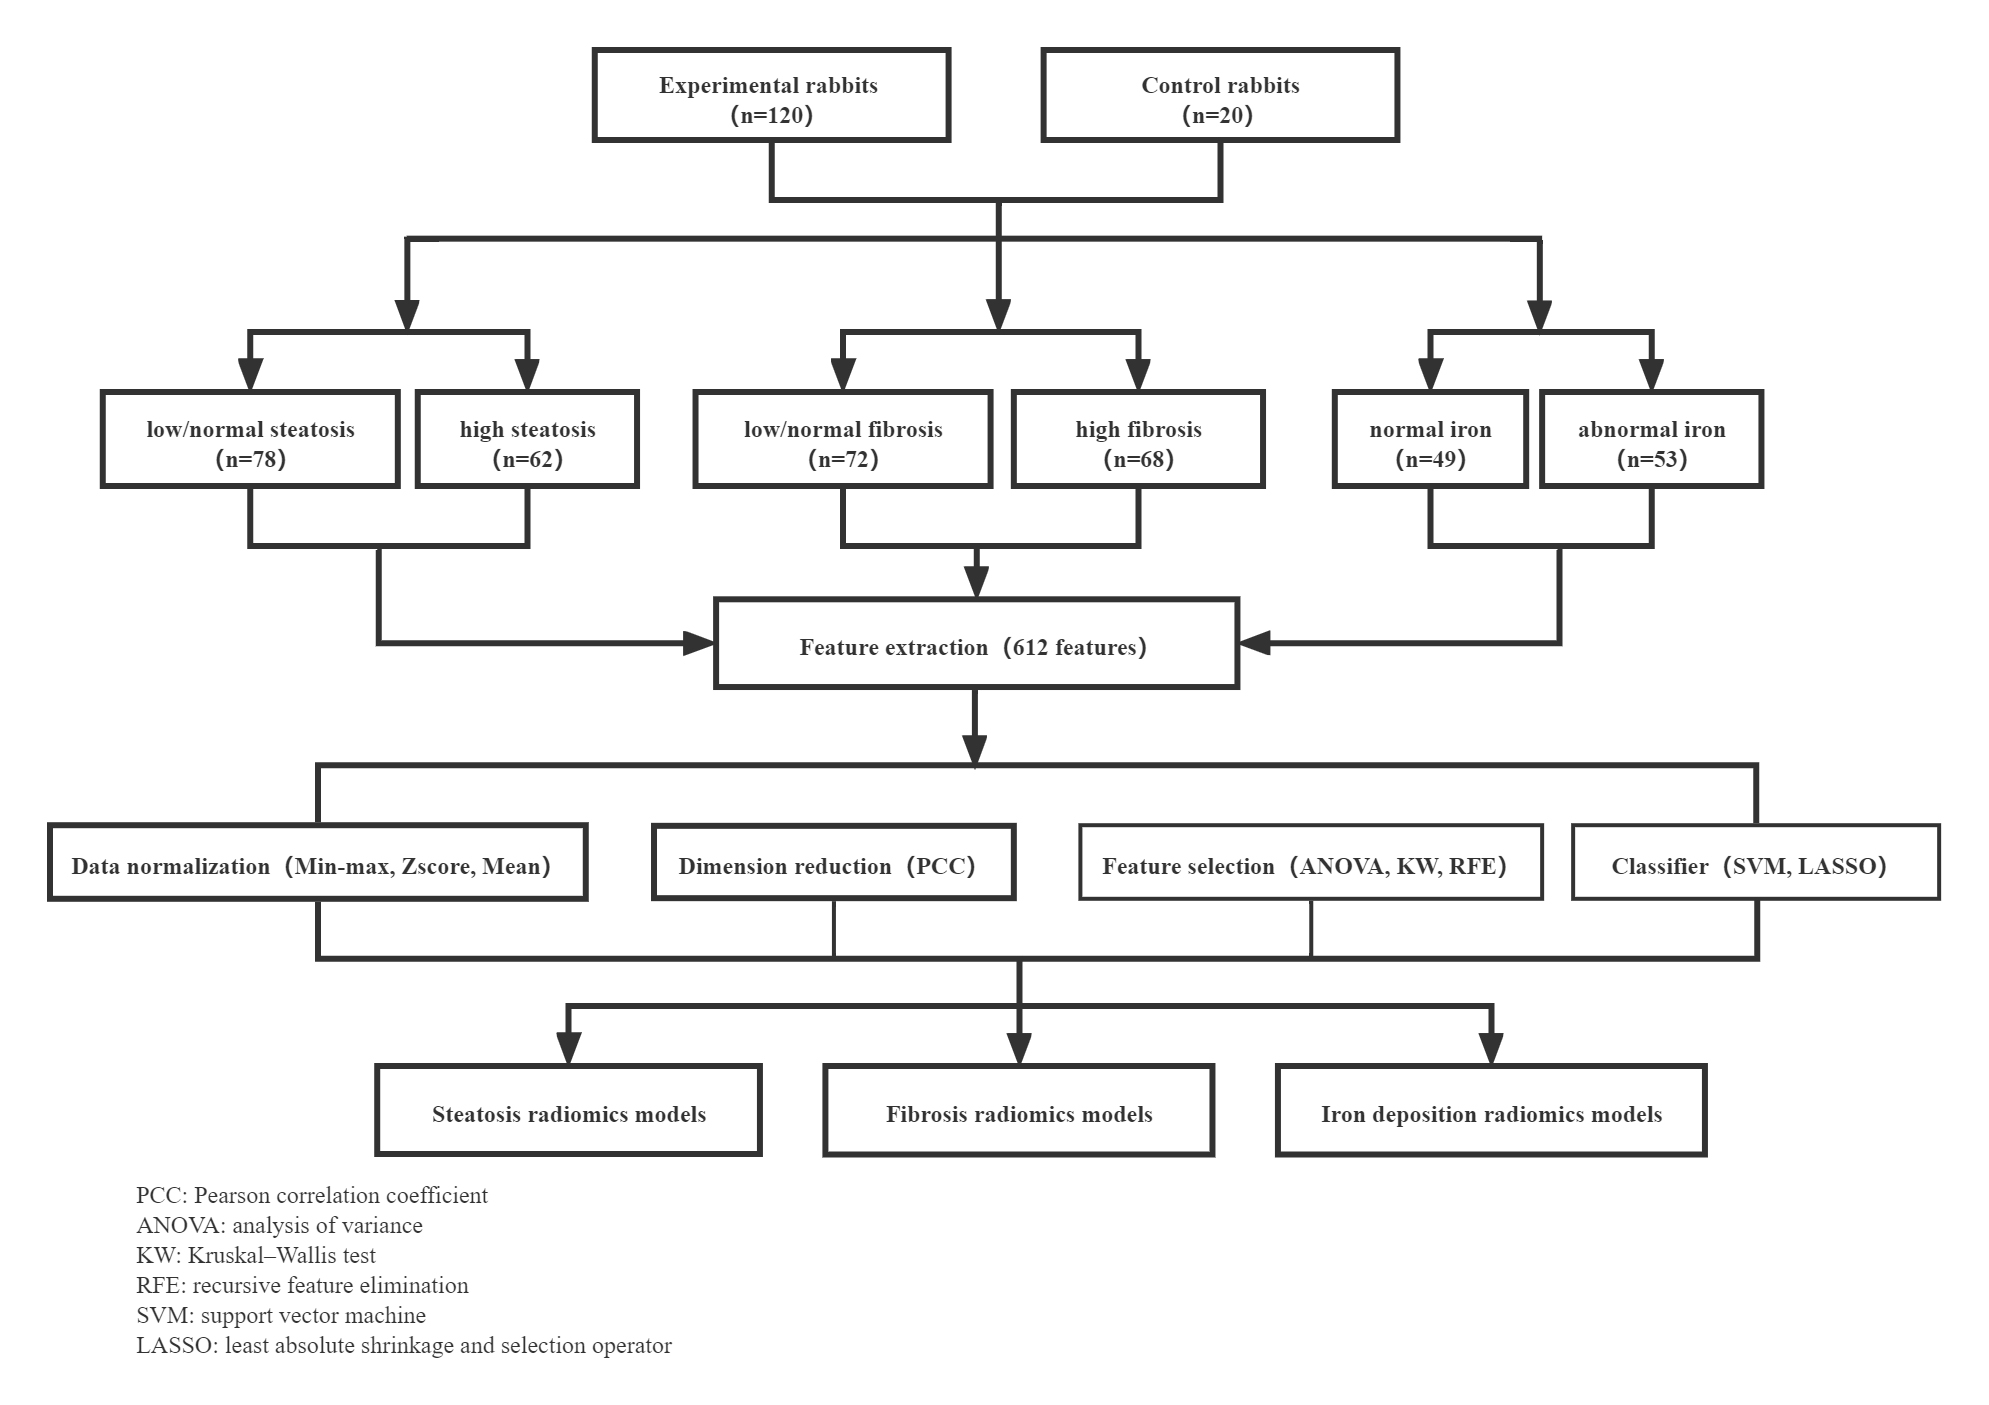
Following Institutional Animal Care and Use Committee (IACUC) approval, 120 rabbits administered chronic carbon tetrachloride (CCl4) for 4-16 weeks and a cholesterol-rich diet for 4 weeks in the experimental group and 20 rabbits injected with saline and normal diet as the control group were examined using mDixon. Two radiologists manually segmented the whole liver. First-order statistical features, shape-based features, and texture features (GLCM, GLDM, GLSZM, GLRLM) were extracted based on mDixon. With percentage of total fat (PTFat), percentage of total fibrosis (PTFib), and liver iron concentration (LIC) from histological quantification assessment as reference values, radiomics models were constructed, the performance of top five models in quantifying liver steatosis, fibrosis and abnormal iron deposition were compared using the DeLong test and optimal models were selected to compare the predictive power in the test cohort for steatosis, fibrosis and abnormal iron deposition.Results
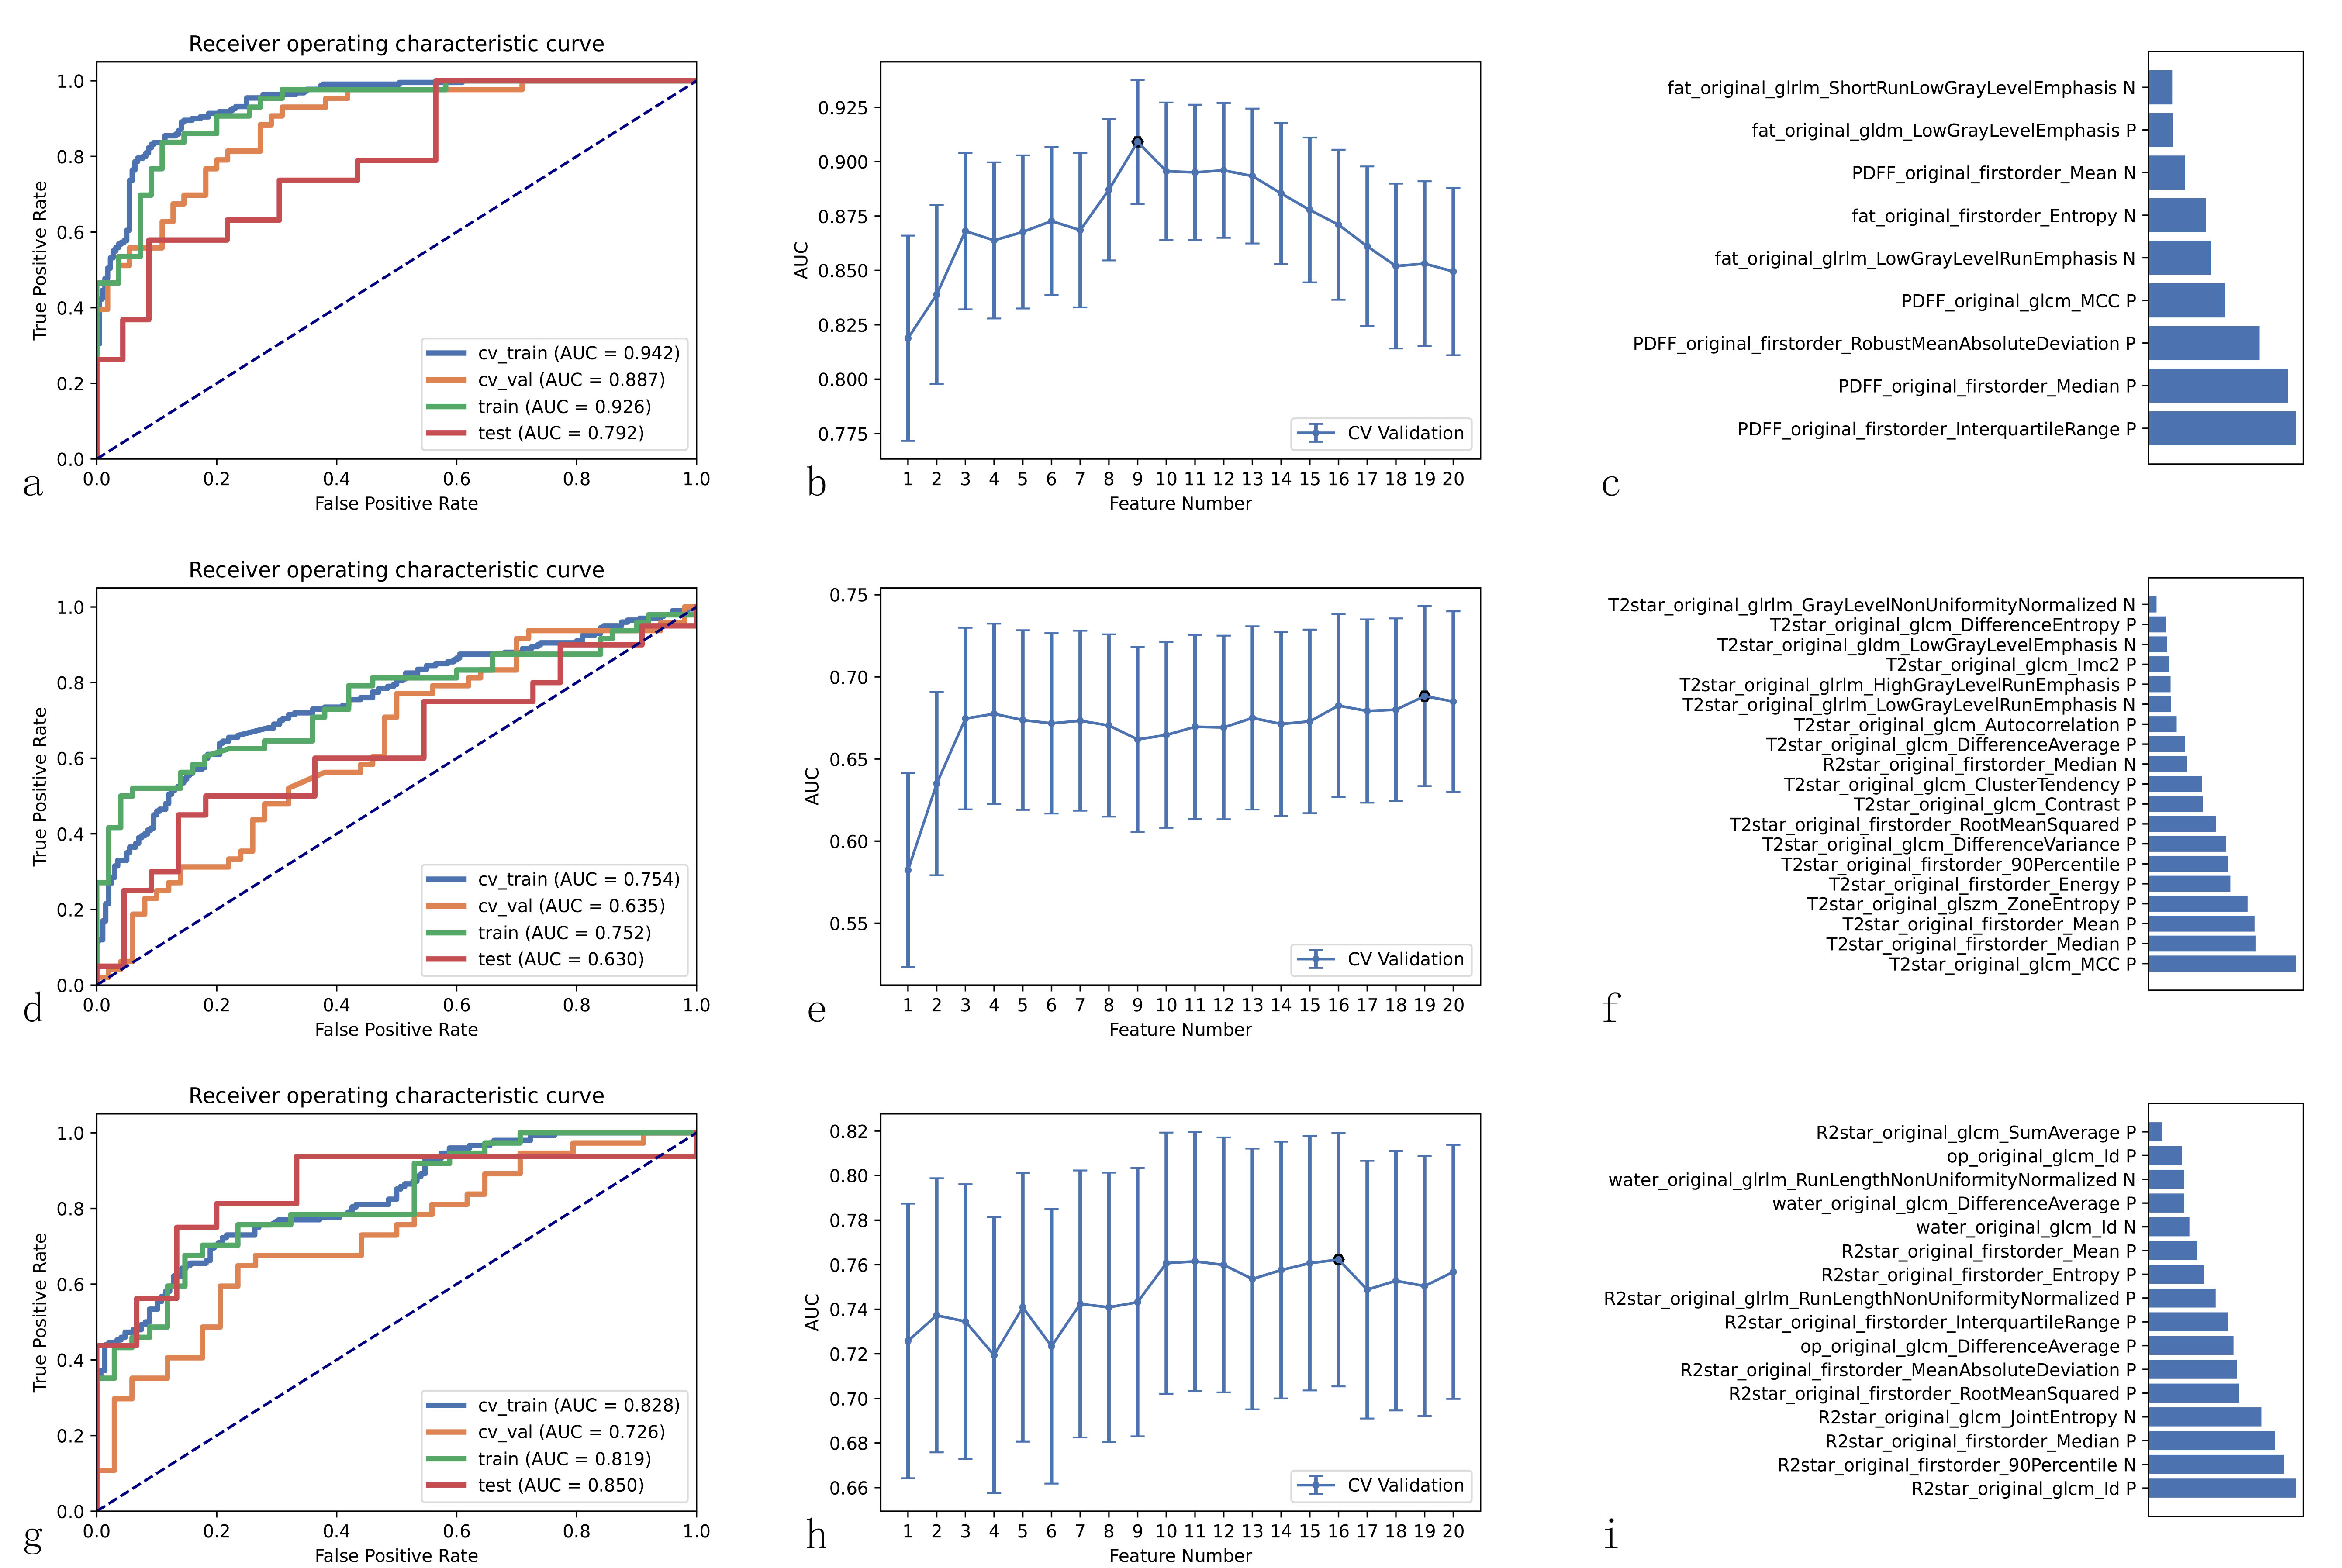
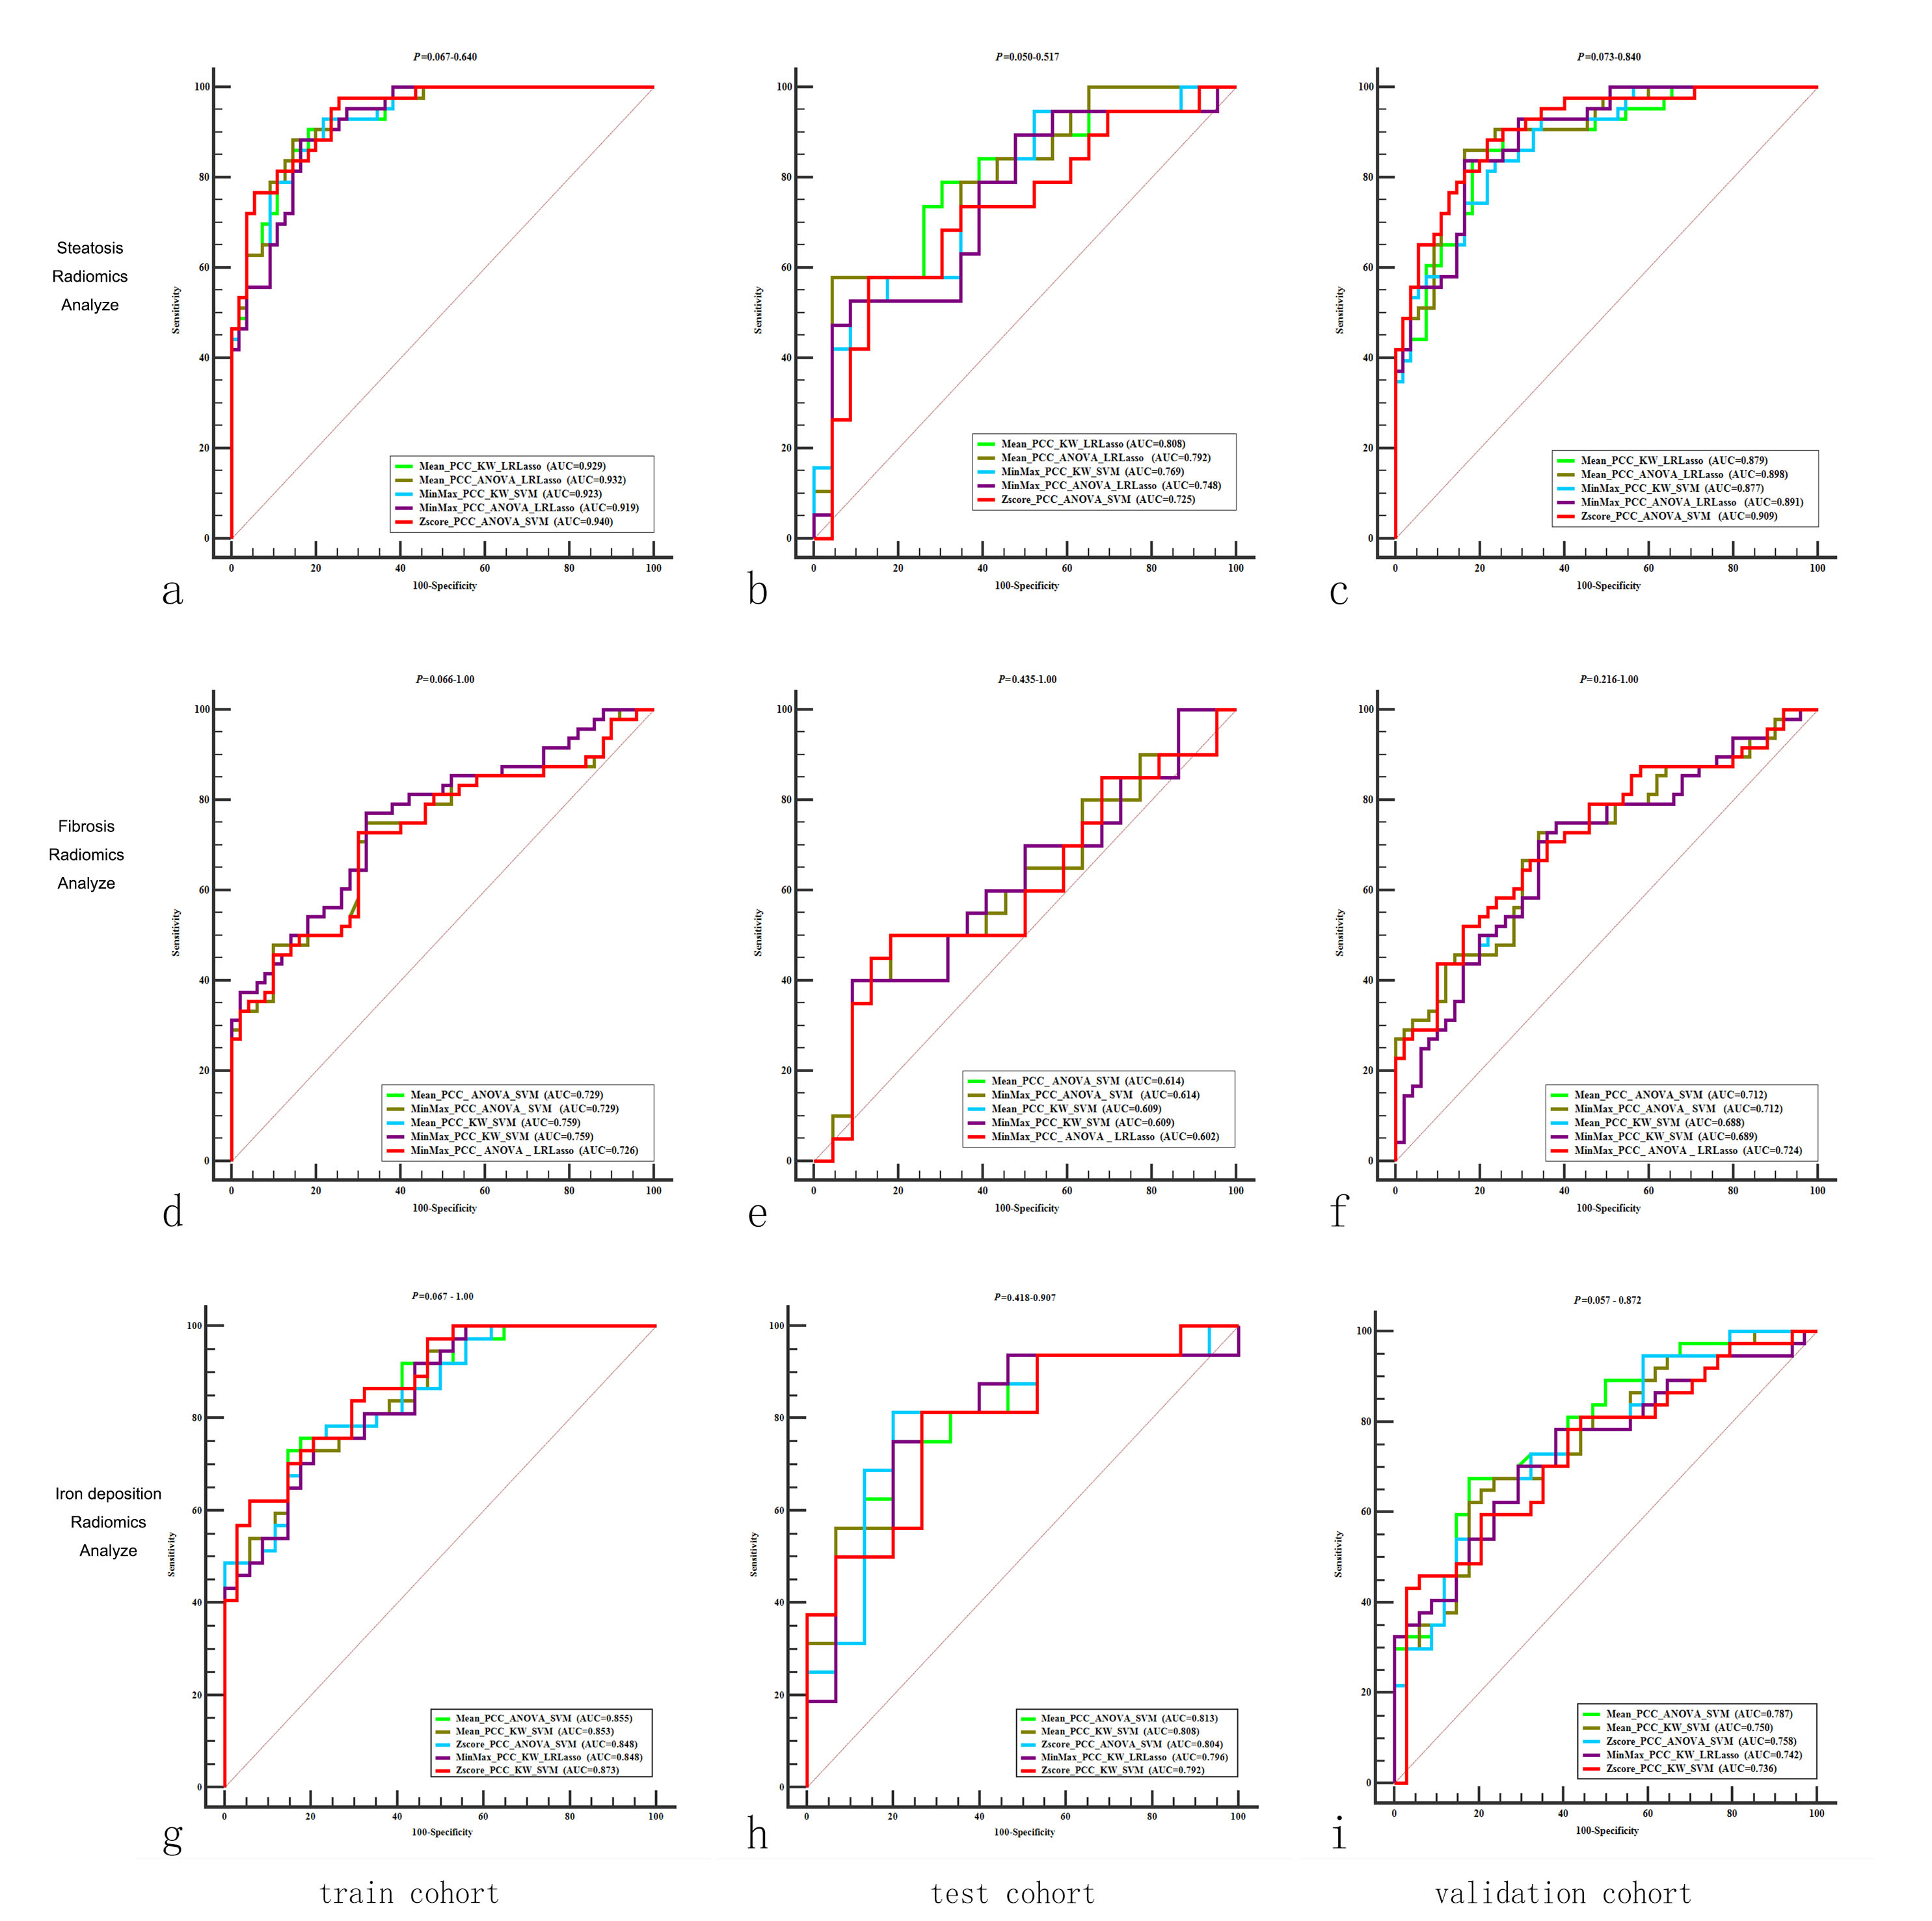
No significant differences were found among the top five models in quantifying liver steatosis, fibrosis and abnormal iron deposition (P=0.050-1.00). For discriminating high PTFat vs. low PTFat, high PTFib vs. low PTFib, and abnormal LIC vs. normal LIC, radiomics models based on nine features, nineteen features, and sixteen features were selected as optimal radiomics models, yielding areas under the curve (AUCs) of 0.792, 0.630, and 0.850 in the test cohort, respectively.Discussion
Our study demonstrated that radiomics models based on the mDixon sequence can quantify simultaneous liver steatosis, fibrosis and iron deposition. Furthermore, radiomics analysis can effectively minimize interference from different pathological features (steatosis, fibrosis and iron deposition). Although normalization methods, feature selection methods and classifier models for radiomics analysis are complicated, our results showed that the top five models provided similar diagnostic performance with similar key features in quantifying pathologic features.Most previous studies focused on the diagnostic accuracy of PDFF in quantifying steatosis versus liver biopsy results[1–8], but ROI-based measurements have been insufficient in mimicking the inhomogeneity within liver tissue[9]. Our study found that radiomics analysis using the mDixon sequence is a promising, noninvasive method for whole liver steatosis assessment, consistent with previous studies[10, 11]. More importantly, in addition to being a biomarker of liver steatosis, our study verified the value of radiomics features for liver fibrosis and iron deposition assessment.
Excess fat, iron and fibrosis commonly coexist as key features of CLD histopathologically [12]. The interference among pathological features (coexistence of fat, fibrosis and iron deposition) with MRI signal decay cannot be ignored. Our study developed liver steatosis radiomics models, fibrosis radiomics models, and iron deposition radiomics models based on a single sequence to simultaneously evaluate all histopathology features. The results demonstrated the feasibility of radiomics analysis derived from disparate parameters for eliminating the interaction among fat, iron, and fibrosis in the liver and for mimicking the coexisting features of the liver.
The merits and disadvantages of normalization, feature selection methods, dimension reduction and classifiers are debatable. Regarding the comparison of different radiomics models in staging fibrosis, steatosis, and iron deposition using mDixon, our study argues that the pipeline of the radiomics model makes no difference in the result.
There are some limitations for the study. First, this was an experimental study. Rabbits of the liver model treated with carbon tetrachloride are quite different from humans with chronic liver disease related to hepatitis B (HBV) or hepatitis C virus (HCV). Second, the radiomics analysis lacks external validation. Third, for the assessment of iron deposition, our results showed only mild iron deposition (mean LIC=305±50 mmol/kg) with a small sample size (53/102). Fourth, triglycerides are composed of microvesicular and macrovesicular hepatic steatosis.
Conclusion
Our results suggest the possibility of simultaneous liver steatosis, liver fibrosis and liver iron deposition quantification using radiomics analysis based on a single sequence (mDixon) and provide initial proof of the effective minimization of the interference from different pathological features.Acknowledgements
The scientific guarantor of this publication is Wei Xing. This work was supported by Key Technology Research and Development Program of Jiangsu(K2019023) & Youth Project of Changzhou City Health Commission (QN202022). All authors declare that they have no conflict of interest.References
1. Idilman IS, Aniktar H, Idilman R, et al (2013) Hepatic Steatosis: Quantification by Proton Density Fat Fraction with MR Imaging versus Liver Biopsy. Radiology 267:767–775. https://doi.org/10.1148/radiol.13121360
2. Kukuk GM, Hittatiya K, Sprinkart AM, et al Comparison between modified Dixon MRI techniques, MR spectroscopic relaxometry, and different histologic quantification methods in the assessment of hepatic steatosis. Eur Radiol 11
3. Kim HJ, Cho HJ, Kim B, et al (2019) Accuracy and precision of proton density fat fraction measurement across field strengths and scan intervals: A phantom and human study. J Magn Reson Imaging 50:305–314. https://doi.org/10.1002/jmri.26575
4. Jayakumar S, Middleton MS, Lawitz EJ, et al (2019) Longitudinal correlations between MRE, MRI-PDFF, and liver histology in patients with non-alcoholic steatohepatitis: Analysis of data from a phase II trial of selonsertib. Journal of Hepatology 70:133–141. https://doi.org/10.1016/j.jhep.2018.09.024
5. Min J, Park HS, Kim YJ, et al (2018) Estimation of hepatic fat fraction using modified Dixon magnetic resonance imaging techniques: effect of liver cirrhosis. Clinical Imaging 51:50–58. https://doi.org/10.1016/j.clinimag.2018.02.002
6. Bhat V (2017) Quantification of Liver Fat with mDIXON Magnetic Resonance Imaging, Comparison with the Computed Tomography and the Biopsy. JCDR. https://doi.org/10.7860/JCDR/2017/26317.10234 7. Guo Z, Blake GM, Li K, et al (2020) Liver Fat Content Measurement with Quantitative CT Validated against MRI Proton Density Fat Fraction: A Prospective Study of 400 Healthy Volunteers. Radiology 294:89–97. https://doi.org/10.1148/radiol.2019190467
8. Serai SD, Dillman JR, Trout AT (2017) Proton Density Fat Fraction Measurements at 1.5- and 3-T Hepatic MR Imaging: Same-Day Agreement among Readers and across Two Imager Manufacturers. Radiology 284:244–254. https://doi.org/10.1148/radiol.2017161786
9. Campo CA, Hernando D, Schubert T, et al (2017) Standardized Approach for ROI-Based Measurements of Proton Density Fat Fraction and R2* in the Liver. American Journal of Roentgenology 209:592–603. https://doi.org/10.2214/AJR.17.17812
10. Chen G, Jiang J, Wang X, et al (2020) Evaluation of hepatic steatosis before liver transplantation in ex vivo by volumetric quantitative PDFF‐MRI. Magn Reson Med mrm.28592. https://doi.org/10.1002/mrm.28592
11. Gutmann DAP, Rospleszcz S, Rathmann W, et al (2020) MRI-Derived Radiomics Features of Hepatic Fat Predict Metabolic States in Individuals without Cardiovascular Disease. Academic Radiology S1076633220304086. https://doi.org/10.1016/j.acra.2020.06.030
12. Zhao R, Hamilton G, Brittain JH, et al (2021) Design and evaluation of quantitative MRI phantoms to mimic the simultaneous presence of fat, iron, and fibrosis in the liver. Magn Reson Med 85:734–747. https://doi.org/10.1002/mrm.28452
Figures