2757
Liver health outcome of chronic hepatic steatosis: an interim analysis of the Dallas Heart Study cohort1Department of Radiology and Advanced Imaging Research Center, UT Southwestern Medical Center, Dallas, TX, United States, 2Department of Internal Medicine, UT Southwestern Medical Center, Dallas, TX, United States, 3Perspectum, Oxford, United Kingdom, 4University Hospitals Cleveland Medical Center, Cleveland, OH, United States
Synopsis
The natural history of hepatic steatosis and risk factors for the development of advanced chronic liver disease (CLD) are unknown. This interim analysis of 191 subjects in the Dallas Heart Study longitudinal cohort shows that having hepatic steatosis (defined as proton-density fat fraction >5%) at the baseline exam was significantly associated with development of advanced CLD (defined as corrected liver T1 ≥ 800msec) 10-20 years later, with CLD prevalence of 38.8% and 16.9% in the steatosis vs. non-steatosis cohort (p<0.001). The baseline overweight or obesity status also appears to be associated with advanced CLD, independent of having steatosis at baseline.
Introduction
Fatty liver disease (FLD) is the most common liver disease in developed countries and is characterized by fat accumulation in the hepatocytes (steatosis). In particular, nonalcoholic fatty liver disease (NAFLD) is exceedingly common in patients with obesity and metabolic syndrome, and it has become a major healthcare concern with estimated prevalence of 25-30% of adults worldwide1,2. NAFLD is a spectrum ranging from uncomplicated steatosis (NAFL) to complicated steatohepatitis (NASH) with superimposed inflammation. Patients with NASH carry the risks of cirrhosis and liver cancer, whereas those with NAFL do not. However, there is limited understanding of NAFLD natural history, due to lack of longitudinal data in NAFLD cohorts; in particular, risk factors associated with development of NASH is still poorly understood. Initiated in 2000, Dallas Heart Study (DHS) is the first epidemiological study to characterize FLD in a U.S. adult population using Proton-Density Fat Fraction (PDFF), a currently accepted noninvasive biomarker of steatosis3. One of the current aims of DHS is to follow the original participants, allowing for over 10 years of disease latency, and assess for the presence of advanced liver disease.Method
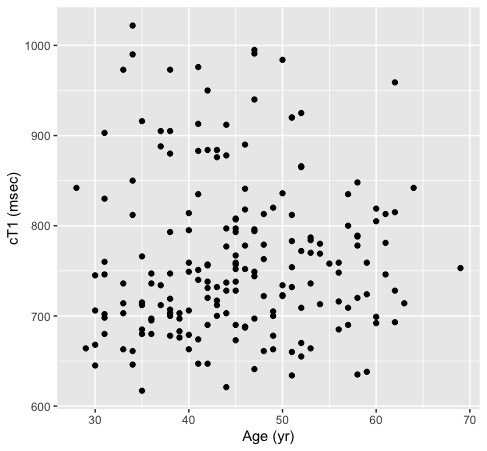
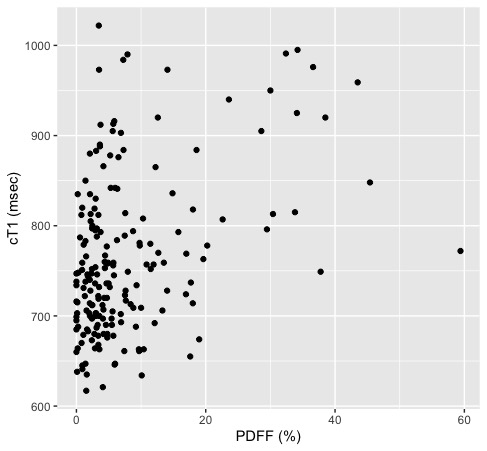
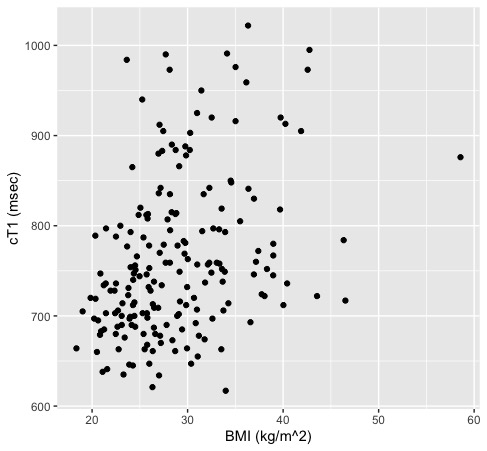
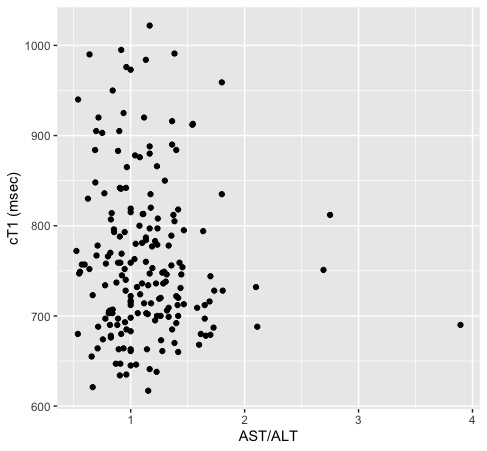
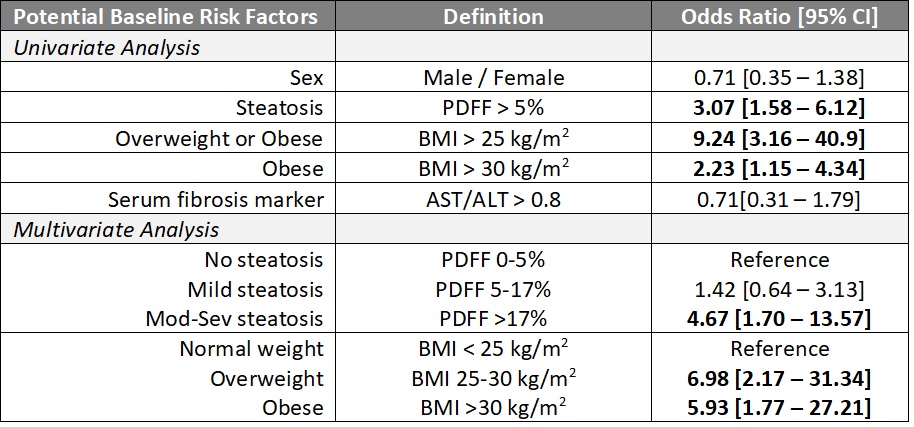
This is an interim analysis of the ongoing DHS third examination, a large multiethnic sample of adults in Dallas County, Texas, USA. Baseline assessments during the first and second DHS examination (2000-2002 or 2007-2009 respectively) included magnetic resonance spectroscopy (MRS) for hepatic steatosis quantification by Proton-Density Fat Fraction (PDFF). Currently, DHS is re-examining 70% of the original DHS participants, for a target sample size of 2,600. The current DHS assessment employs advanced whole-body magnetic resonance imaging (MRI), which includes LiverMultiScan® (Perspectum, Oxford, UK) to permit noninvasive quantification of hepatic fibro-inflammation by corrected T1 (cT1)4. Statistical analyses were performed using R version 6.3. The correlation of current cT1 with the baseline age, PDFF, body mass index (BMI), and aspartate-to-alanine aminotransferase ratio (AST/ALT), was assessed by scatter plots and by Spearman correlation coefficients. The association between presence of advanced chronic liver disease (CLD, defined as cT1 ≥ 800 msec) and the following baseline characteristics were assessed by odds ratios: sex, steatosis (PDFF > 5%)4, overweight (BMI >25 kg/m2), obesity (BMI >30 kg/m2), and serum fibrosis marker (AST/ALT >0.8)5. Based on this univariate analysis, adjusted odds-ratios and 95% confidence intervals (CI) were calculated using multivariable logistic regression.Results
Thus far, 191 subjects from the original DHS cohort completed liver cT1 analysis. The cohort includes 75 males and 116 females (18 Hispanic; 70 non-Hispanic black; 98 non-Hispanic White; 5 Other). The median age at baseline measurement was 45 (interquartile range 38-51) years. The prevalence of steatosis was 44.5% (95% CI 37.4-51.8%). The overall prevalence of elevated cT1 was 26.7% (95% CI 20.7-33.7), and significantly more elevated (p<0.001) in the steatosis group with 38.8 [28.6-50.0] % compared to the non-steatosis group with 16.9 [10.6-25.8] %. The scatter plots of cT1 vs. baseline age, PDFF, BMI, and AST/ALT are shown in Figure 1 with their respective Spearman correlations. The univariate analysis shown in Table 1 shows that baseline steatosis, overweight/obesity, and obesity, are associated with current liver cT1 elevation. Multivariable analysis including baseline steatosis grade (normal, mild, moderate or severe, by PDFF)6 and weight class (normal, overweight, obese) as predictors showed that having ≥moderate steatosis and being overweight or obese status at baseline independently confer higher risk of elevated liver cT1 after 10-20 years of followup (Table 1).Discussion
Currently available prevalence estimates for advanced CLD are based on cross-sectional studies and do not consider the potential latency of liver disease progression in the background of hepatic steatosis. The longitudinal study of the DHS cohort is designed to elucidate the long-term liver health burden of hepatic steatosis, by leveraging hepatic cT1, a noninvasive biomarker of hepatic fibro-inflammation as the liver health outcome. Our early data suggest that hepatic steatosis alone may not accurately predict progression of CLD independent of other obesity-related risk factors. The correlative data generated in this study will likely help stratify patients at increased risk for early or future development of advanced CLD, guide targeted follow-up or therapeutic recommendations.Conclusion
A statistically significant association is suggested between the baseline hepatic steatosis and the presence of advanced chronic liver disease (CLD) 10-20 years later. In addition, baseline weight status appears to be independently associated with advanced CLD. Other biological or lifestyle phenotypes may also modify the risks of CLD progression. The final dataset of the entire cohort may confirm these findings and reveal additional risk factors of CLD progression.Acknowledgements
References
1. Younossi ZM, Koenig AB, Abdelatif D, et al. Global epidemiology of nonalcoholic fatty liver disease-Meta-analytic assessment of prevalence, incidence, and outcomes. Hepatology 2016;64(1):73-84. doi: 10.1002/hep.28431 [published Online First: 2015/12/29]
2. Younossi Z, Anstee QM, Marietti M, et al. Global burden of NAFLD and NASH: trends, predictions, risk factors and prevention. Nat Rev Gastroenterol Hepatol 2018;15(1):11-20. doi: 10.1038/nrgastro.2017.109 [published Online First: 2017/09/21]
3. Szczepaniak LS, Nurenberg P, Leonard D, et al. Magnetic resonance spectroscopy to measure hepatic triglyceride content: prevalence of hepatic steatosis in the general population. Am J Physiol Endocrinol Metab 2005;288(2):E462-8. doi: 10.1152/ajpendo.00064.2004 [published Online First: 2004/09/02]
4. Andersson A, Kelly M, Imajo K, et al. Clinical utility of MRI biomarkers for identifying NASH patients' high risk of progression: A multi-center pooled data and meta-analysis. Clin Gastroenterol Hepatol 2021 doi: 10.1016/j.cgh.2021.09.041 [published Online First: 2021/10/10]
5. McPherson S, Stewart SF, Henderson E, et al. Simple non-invasive fibrosis scoring systems can reliably exclude advanced fibrosis in patients with non-alcoholic fatty liver disease. Gut 2010;59(9):1265-9. doi: 10.1136/gut.2010.216077 [published Online First: 2010/08/31]
6. Tang A, Tan J, Sun M, et al. Nonalcoholic fatty liver disease: MR imaging of liver proton density fat fraction to assess hepatic steatosis. Radiology 2013;267(2):422-31. doi: 10.1148/radiol.12120896 [published Online First: 2013/02/06]
Figures