2754
Characterising hypoxia in rhabdomyosarcoma xenografts with oxygen-enhanced MRI
Jessica K.R. Boult1, Upasana Roy1, Carolina Bernauer2, Carol Box1, Louise Howell3, Elise Y. Lepicard1, Yann Jamin1, James P.B. O'Connor1, Janet M. Shipley2, and Simon P. Robinson1
1Division of Radiotherapy and Imaging, The Institute of Cancer Research, London, United Kingdom, 2Division of Molecular Pathology, The Institute of Cancer Research, London, United Kingdom, 3Core Research Facilities, The Institute of Cancer Research, London, United Kingdom
1Division of Radiotherapy and Imaging, The Institute of Cancer Research, London, United Kingdom, 2Division of Molecular Pathology, The Institute of Cancer Research, London, United Kingdom, 3Core Research Facilities, The Institute of Cancer Research, London, United Kingdom
Synopsis
Hypoxic gene signatures are prevalent in paediatric rhabdomyosarcomas and are important in conferring resistance to standard treatments. Oxygen-enhanced MRI (OE-MRI) and histological assessment of pimonidazole adduct formation show that xenografts derived from three human rhabdomyosarcoma cell lines exhibit high levels of hypoxia with differences in vascular perfusion evident between the models.
There is much interest in hypoxia-alleviating
strategies to reduce tumour hypoxia for therapeutic gain, and these will be assessed
in rhabdomyosarcoma models in vivo using
OE-MRI. A reduction in hypoxia in response to atovaquone in spheroids derived
from the same rhabdomyosarcoma cell lines in
vitro has been confirmed.
Introduction
Rhabdomyosarcomas (RMS) are the most common soft tissue sarcomas in children and adolescents and a major cause of cancer-related mortality in this age group. A growing body of evidence suggests that hypoxia is important in conferring resistance to treatment in RMS1-3.We have demonstrated the potential of oxygen-enhanced MRI (OE-MRI) for mapping hypoxia non-invasively in vivo4-6, and it is important that this method is further evaluated in tumour types in which hypoxia has been implicated in poor prognosis.
Here we report the use of OE-MRI and histopathology to characterise the hypoxic phenotype of a panel of human RMS cell lines propagated in mice or grown as tumour spheroids in vitro.
Methods
RH41, RD and RH30 RMS xenografts were propagated subcutaneously in the flanks of female NCr nude mice. When tumours reached ~350mm3 pimonidazole (60mg/kg i.p.) was administered 30min prior to imaging on a Bruker Biospec 7T system, performed over a 3cm field-of-view using a 4cm volume coil with the tumour surrounded by dental paste to minimise susceptibility artefacts.OE-MRI using IR-TrueFISP T1-mapping and susceptibility-contrast MRI were performed and analysed as previously described6 with additional acquisition of diffusion-weighted images (EPI TE=38.1, TR=1500ms, 8 averages, 5 b-values 200-1000s/mm2) for the estimation of apparent diffusion coefficient (ADC)7, and the use of the USPIO contrast agent ferumoxytol (150µmolFe/kg)8.
Following MRI, the perfusion marker Hoechst 33342 (15mg/kg i.v.) was administered for 1min and tumours rapidly excised and snap frozen. Whole tumour frozen sections cut in the imaging plane were processed for fluorescent detection of pimonidazole adduct formation and Hoechst 33342 uptake, and subsequently stained with H&E7.
To assess response to a hypoxia-alleviating therapy, RH41 and RD spheroids were formed in ultra-low attachment plates and treated for 24h with 3.75µM-60µM atovaquone, which decreases hypoxia by reducing oxygen consumption rate9, or DMSO control. Subsequently they were incubated with 200µM pimonidazole for 2h prior to fixation and immunofluorescent detection of pimonidazole on paraffin-embedded sections.
One-way ANOVA was performed to assess statistical significance, assuming a significance level of 5%.
Results
T2-weighted images demonstrated that RH41 tumours were more homogeneous than RD and RH30 tumours (Figures 1&2), which demonstrated cystic or necrotic areas on both MRI and H&E-stained sections (Figure 2). Median ADC values were higher in RH30 tumours (768±27x10-6mm2/s) than RH41 and RD (616±27 and 636±24x10-6mm2/s, respectively, P<0.05, data not shown).Oxygen-induced ΔR1 maps show some intratumoural heterogeneity but little change was observed (Figure 1). Binarised maps derived from ΔR1 signifying voxels that enhanced with (OxyE) or were refractory to (OxyR) hyperoxia show relatively equal proportions in all three models. Perfused voxels refractory to hyperoxia (pOxyR) identified using a USPIO-derived perfusion mask were distributed across the tumours often in small islands interspersed with areas of enhancing voxels and non-perfused (NP) areas (Figures 1&2).
For all three models, areas of pimonidazole adduct formation were spatially associated with pOxyR or non-perfused voxels, while denser areas of Hoechst 33342-stained perfused vasculature associated with pOxyE voxels (Figure 2).
More intertumoural heterogeneity in ΔR1 and consequently OxyR and pOxyR values was observed in the RH41 cohort than RD and RH30 (Figure 3). Mean cohort OxyR was ~50% with pOxyR above 25% in all three models, which corresponded to ~30% pimonidazole adduct formation in all models. No differences in these parameters were found between the groups. Hoechst 33342-perfused fraction was higher in RD tumours (8.5±1.0%) than RH41 and RH30 (5.8±0.5 and 4.7±0.6%, respectively, P<0.05), which was also reflected in a difference in USPIO-perfused fraction between RD and RH30 (90±2 and 66±7%, P<0.05).
Control RD and RH41 spheroids >300µm in diameter demonstrated pimonidazole adduct-positive hypoxic cores (Figure 4). RD spheroids treated with 60µM and 30µM atovaquone, and RH41 spheroids treated with 60µM atovaquone, no longer presented a hypoxic core; this was confirmed by a reduction in mean fluorescence intensity compared to DMSO controls. Atovaquone treatment did not affect the diameter of the spheroids over 24h (data not shown).
Discussion
RMS xenografts derived from RH41, RD and RH30 cells present with high levels of hypoxia, as assessed by OE-MRI and pimonidazole adduct formation, which also corresponded well spatially. The levels of OxyR, pOxyR and pimonidazole adduct staining observed were higher than those previously reported in range of other subcutaneously-grown xenografts4-6,10.Numerous strategies have been investigated to reduce tumour hypoxia for therapeutic gain11. Remarkably, the majority of these clinical trials failed to identify and select patients with hypoxic tumours prior to enrolment12,13. Non-invasive methods, such as OE-MRI, that are able to quantify the extent and heterogeneity of hypoxia within an individual tumour would clearly offer clinical benefit in personalised treatment planning.
RH41 and RD spheroids presented with hypoxic cores when grown to 300µm diameter in vitro. As a prelude to studies investigating hypoxia-alleviating therapies in vivo, spheroids were treated with the repurposed anti-malarial agent atovaquone. Hypoxia was reduced in a dose-dependent manner, with a significant reduction in pimonidazole staining observed at 30µM in RD and 60µM in RH41 spheroids.
These data support subsequent in vivo studies to assess the response of RMS xenografts to atovaquone or other hypoxia-modifying therapeutics using OE-MRI, ahead of potential combination studies to evaluate the role of hypoxia-alleviation in improving sensitivity to standard-of-care therapeutics in RMS.
Acknowledgements
We acknowledge support from CR-UK programme grant C16412/A27725, The Oracle Cancer Trust, and Children with Cancer UK.References
- Romualdi C, De Pitta C, Tombolan L, et al. Defining the gene expression signature of rhabdomyosarcoma by meta-analysis. BMC Genomics 2006;7:287.
- Zhang L, Marrano, P, Wu B, et al. Combined antitumor therapy with metronomic topotecan and hypoxia-activated prodrug, evofosfamide, in neuroblastoma and rhabdomyosarcoma preclinical models. Clin Cancer Res 2016;22:2697-2708.
- Nordsmark M, Asner J, Keller J, et al. Hypoxia in human soft tissue sarcomas: Adverse impact on survival and no association with p53 mutations. Br J Cancer 2001;84:1070-1075.
- O'Connor JPB, Boult JKR, Jamin Y, et al. Oxygen-enhanced MRI accurately identifies, quantifies, and maps tumor hypoxia in preclinical cancer models. Cancer Res 2016;76:787-795.
- Little RA, Jamin Y, Boult JKR, et al. Mapping hypoxia in renal carcinoma with oxygen-enhanced MRI: Comparison with intrinsic susceptibility MRI and pathology. Radiology 2018;288:739-747.
- Lepicard EY, Boult JKR, Jamin Y, et al. 0276 Imaging hypoxia in head and neck cancer xenografts with oxygen-enhanced MRI. Proc Intl Soc Mag Reson Med 29 2021.
- Reeves EL, Li J, Boult JKR, et al. 0143 Breast tumour response to PEGPH20-induced stromal modulation assessed by multiparametric MRI. Proc Intl Soc Mag Reson Med 28 2020.
- Boult JKR, El-Shemerly M, Bachmann F, et al. 0933 Tumour vascular response to the FGFR inhibitor derazantinib assessed using susceptibility contrast MRI with ferumoxytol. Proc Intl Soc Mag Reson Med 29 2021.
- Ashton TM, Fokas E, Kunz-Schughart LA, et al. The anti-malarial atovaquone increases radiosensitivity by alleviating tumour hypoxia. Nature Commun. 2016;7:12308.
- Salem A, Little RA, Latif A, et al. Oxygen-enhanced MRI is feasible, repeatable, and detects radiotherapy-induced change in hypoxia in xenograft models and in patients with non-small cell lung cancer. Clin Cancer Res 2019;25:3818-3829.
- Dewhirst MW, Birer SR. Oxygen-enhanced MRI is a major advance in tumor hypoxia imaging. Cancer Res 2016;76:769-772.
- Lee ATJ, Pollack SM, Huang P, et al. Phase III soft tissue sarcoma trials: success or failure? Curr Treat Options Oncol 2017;18:19.
- Lindner LH. Hypoxia-activated prodrug: an appealing preclinical concept yet lost in clinical translation. Lancet Oncol 2017;18:991-993.
Figures
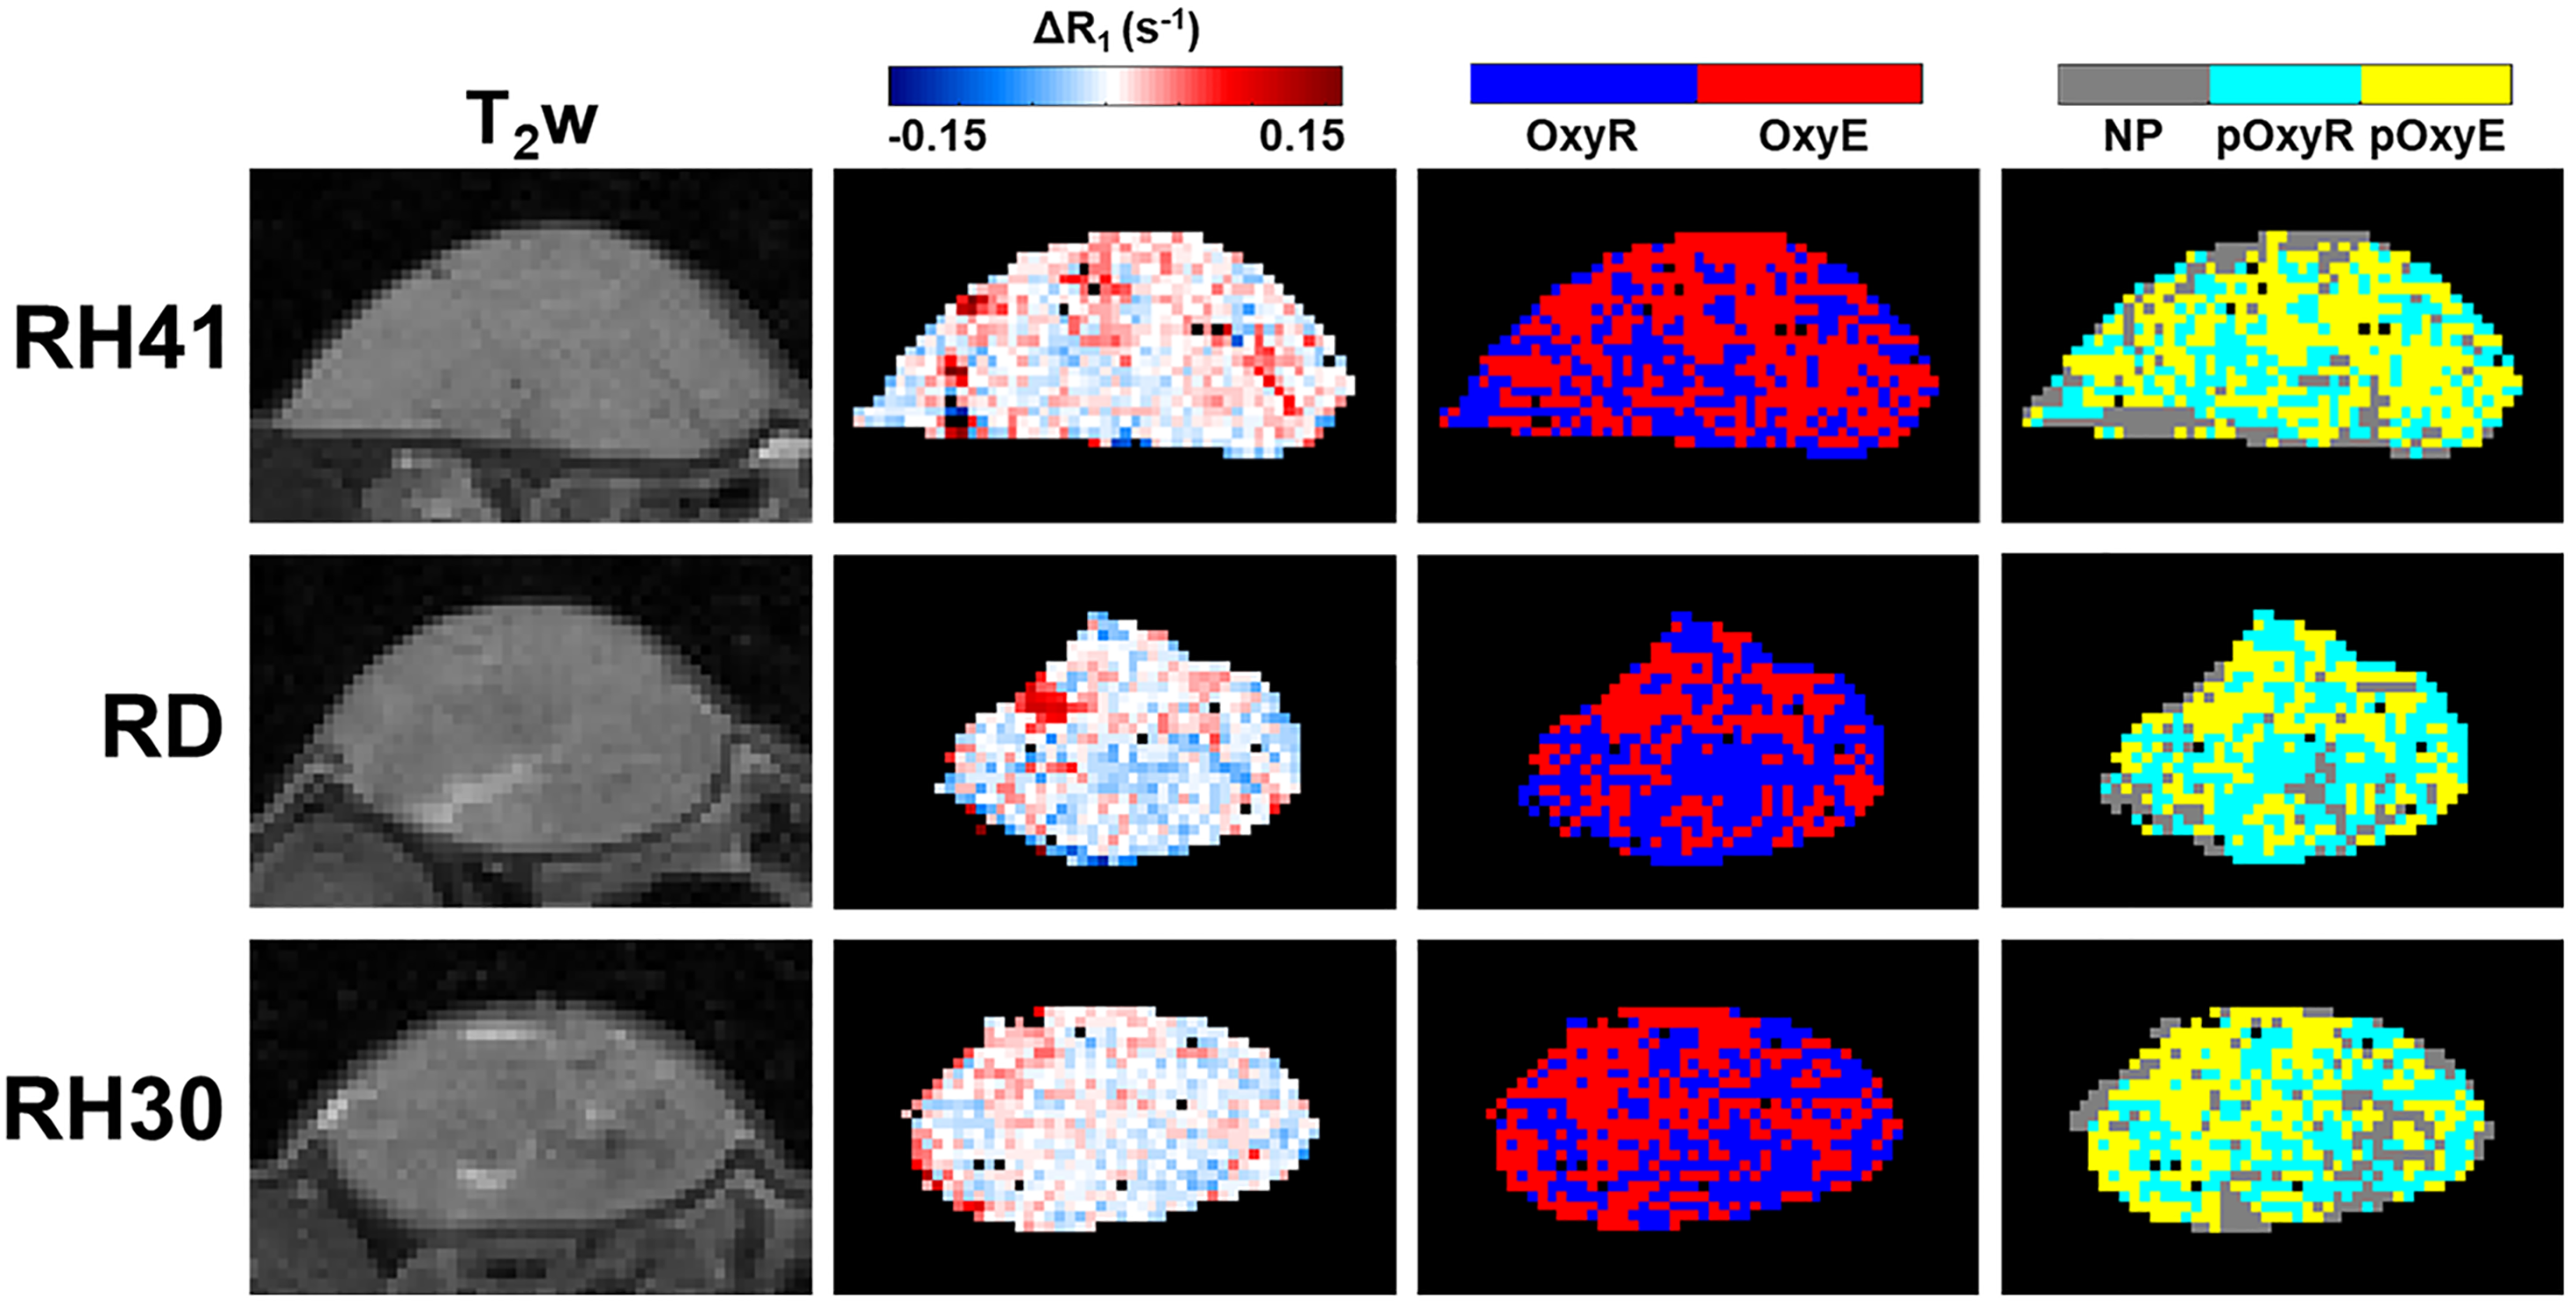
Figure
1. T2-weighted (T2w) images of RH41, RD and
RH30 xenografts alongside the associated parametric maps of hyperoxia-induced
ΔR1; oxygen-refractory (OxyR, blue) and oxygen-enhanced (OxyE, red)
voxels; and perfused oxygen-refractory (pOxyR, cyan), perfused oxygen-enhanced
(pOxyE, yellow) and non-perfused (NP, grey) voxels.
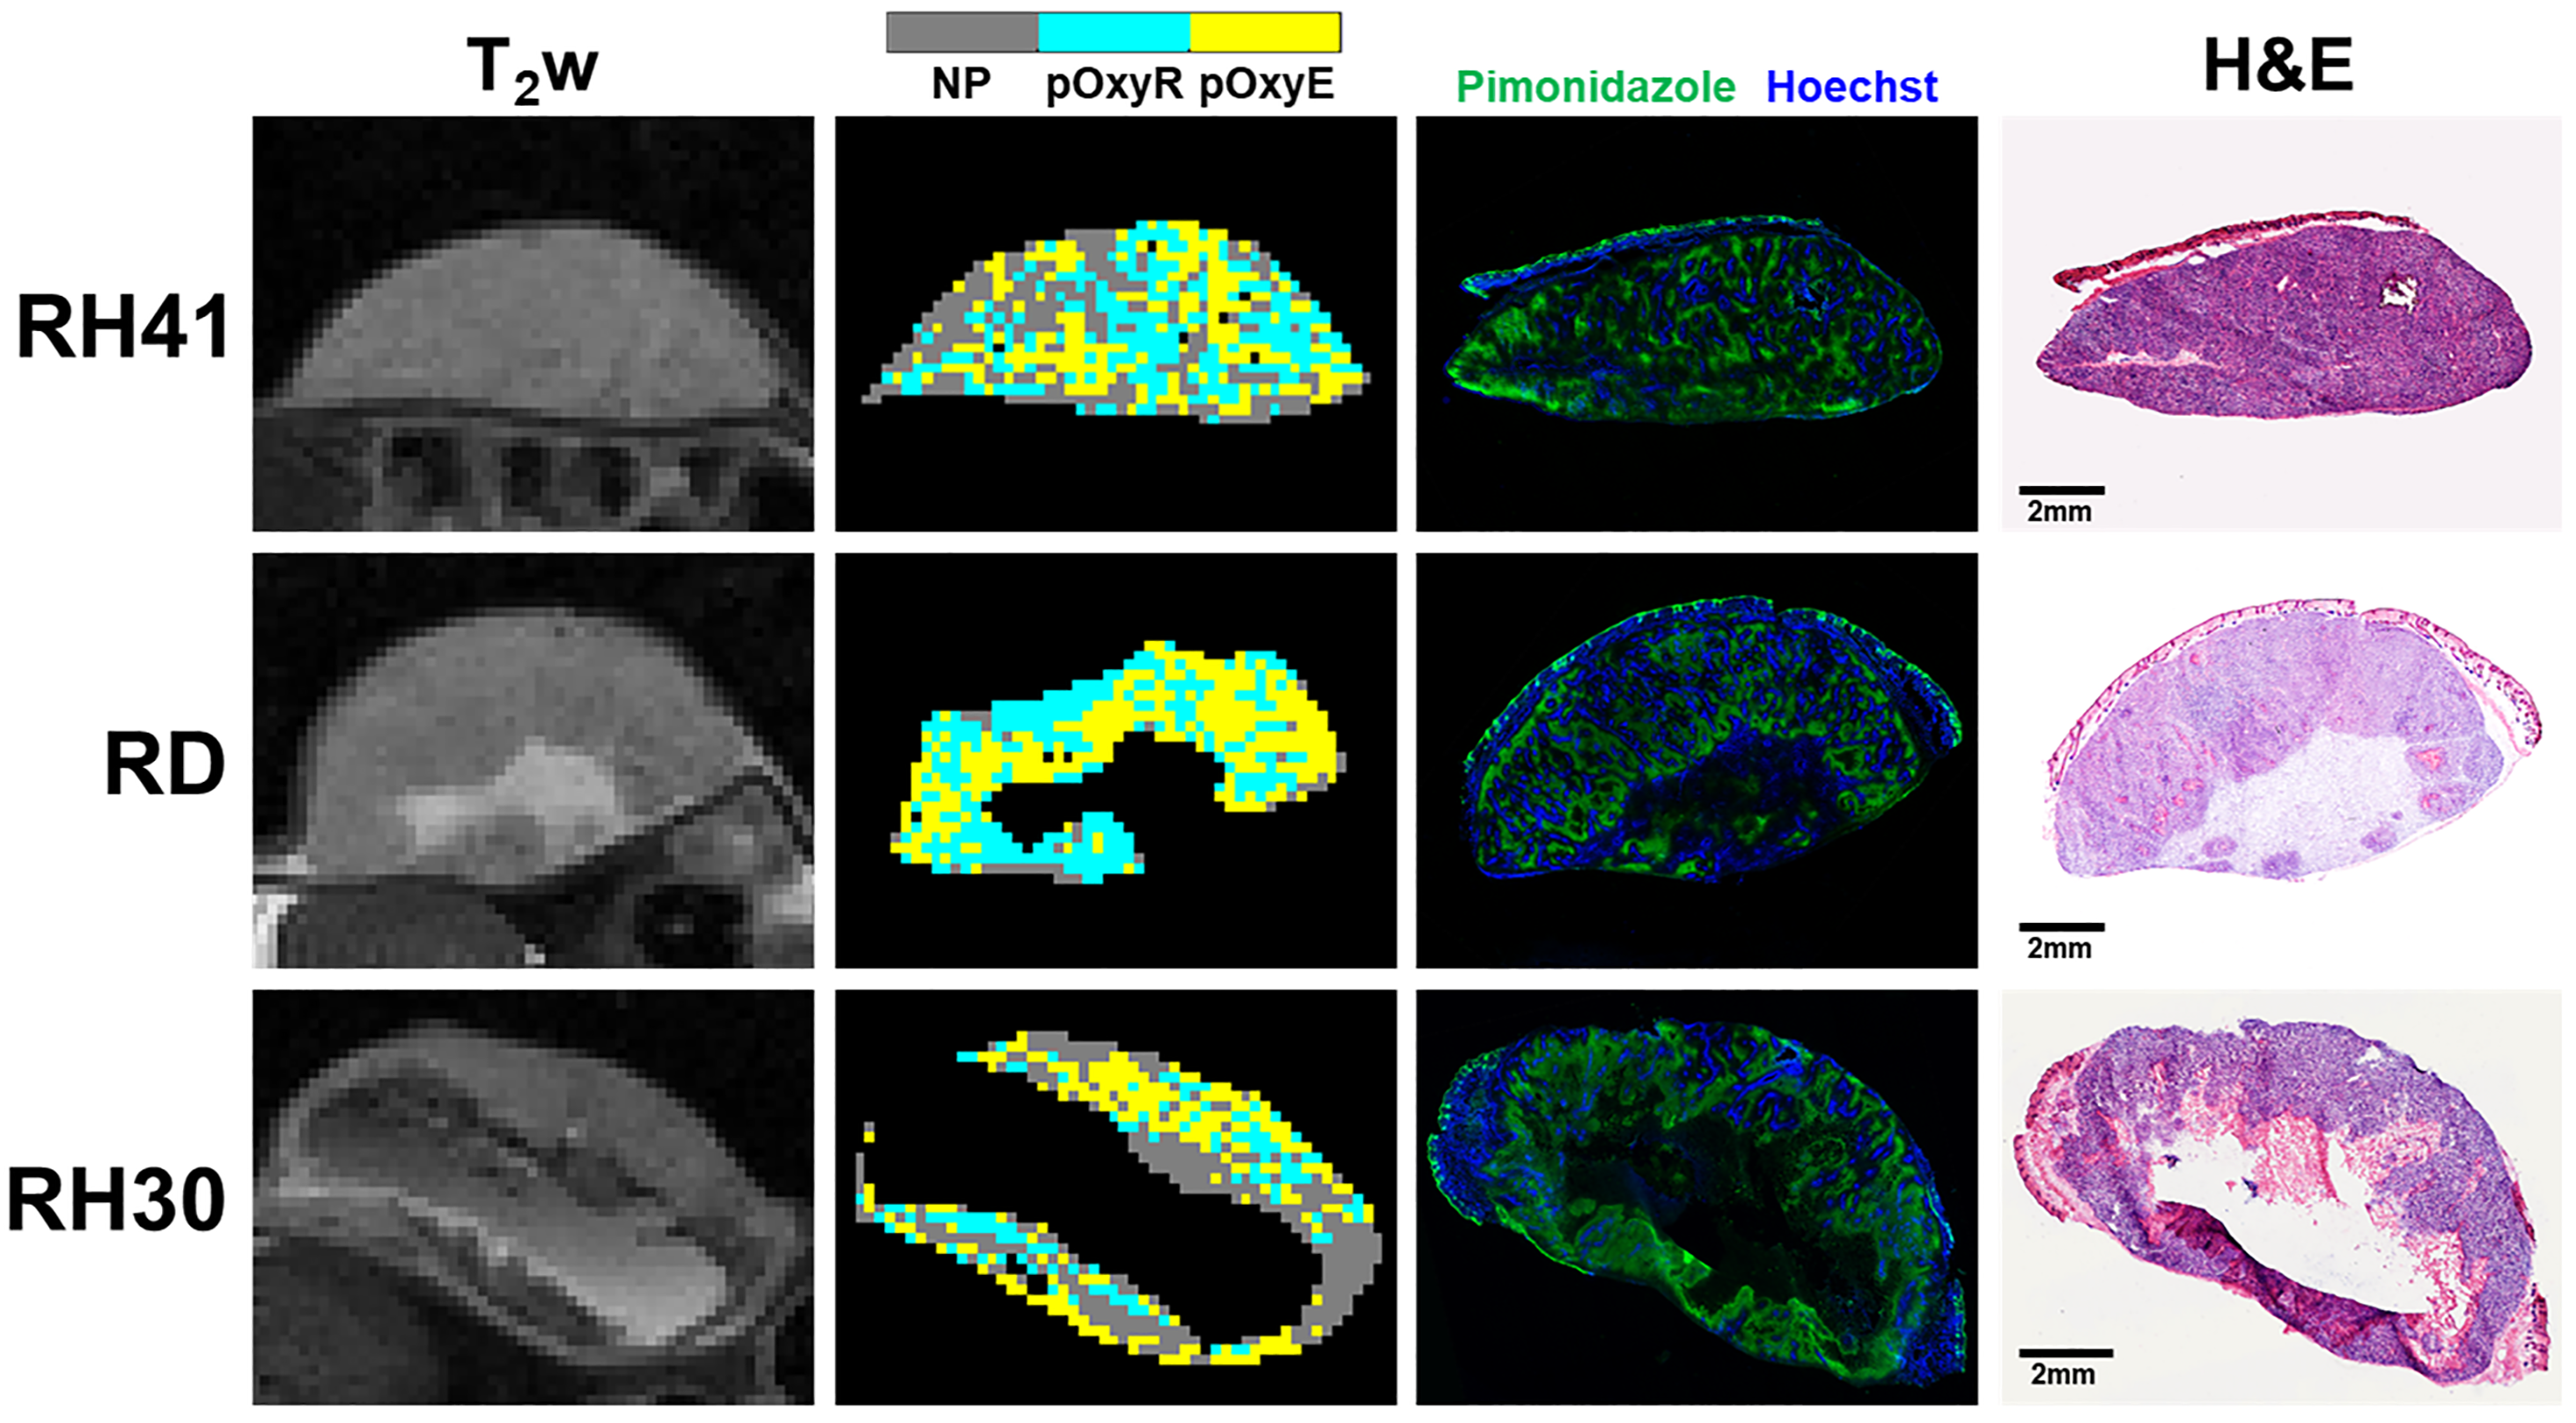
Figure
2. T2-weighted (T2w) images and parametric maps
of perfused oxygen-refractory (pOxyR, cyan), perfused oxygen-enhanced (pOxyE,
yellow) and non-perfused (NP, grey) voxels of RH41, RD and RH30 xenografts
alongside matched histological sections stained for pimonidazole adduct
formation (hypoxia, green) and Hoechst 33342 (perfusion, blue) followed by H&E.
Note the cystic or necrotic regions in RD and RH30 xenografts excluded from MRI
and histological assessment.
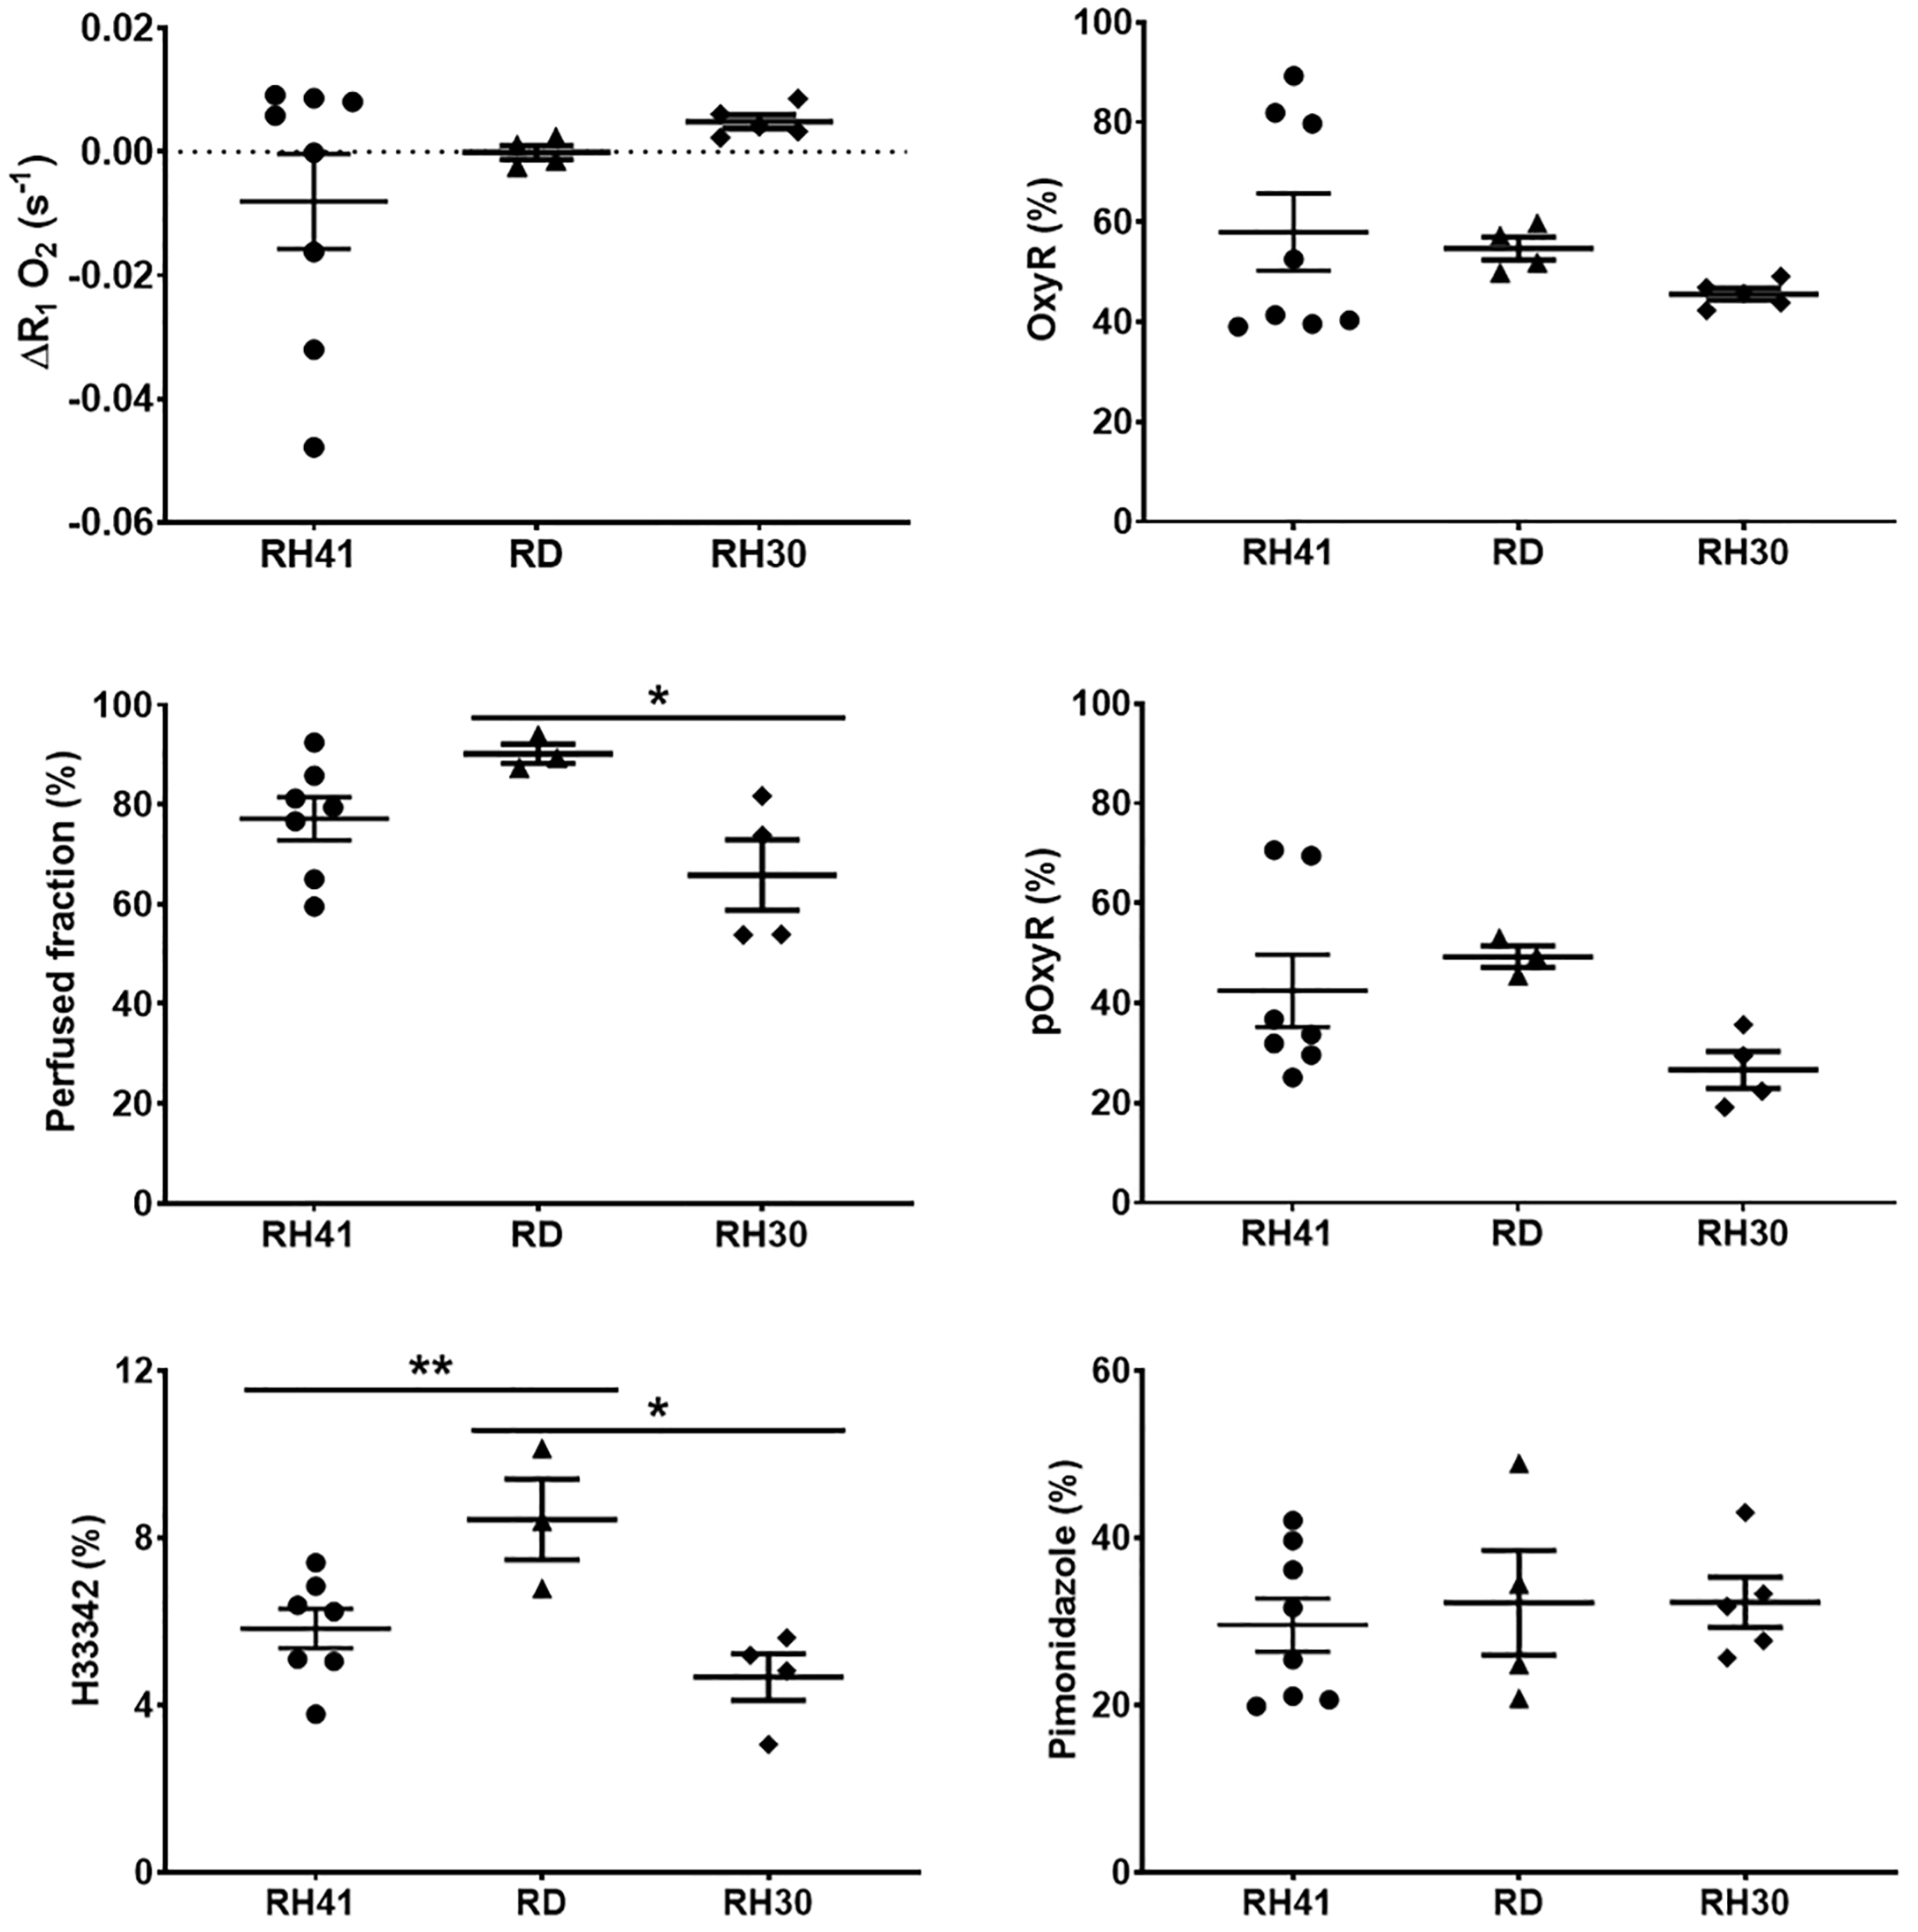
Figure
3. Quantification of hyperoxia-induced ΔR1, the proportion of oxygen-refractory
voxels (OxyR), USPIO-derived perfused fraction, perfused oxygen-refractory voxels
(pOxyR), Hoechst 33342-derived perfused fraction and pimonidazole adduct
formation (hypoxia). Median values of MRI parameters from individual tumours
are plotted ±sem. *P<0.05, **P<0.01, one-way ANOVA.
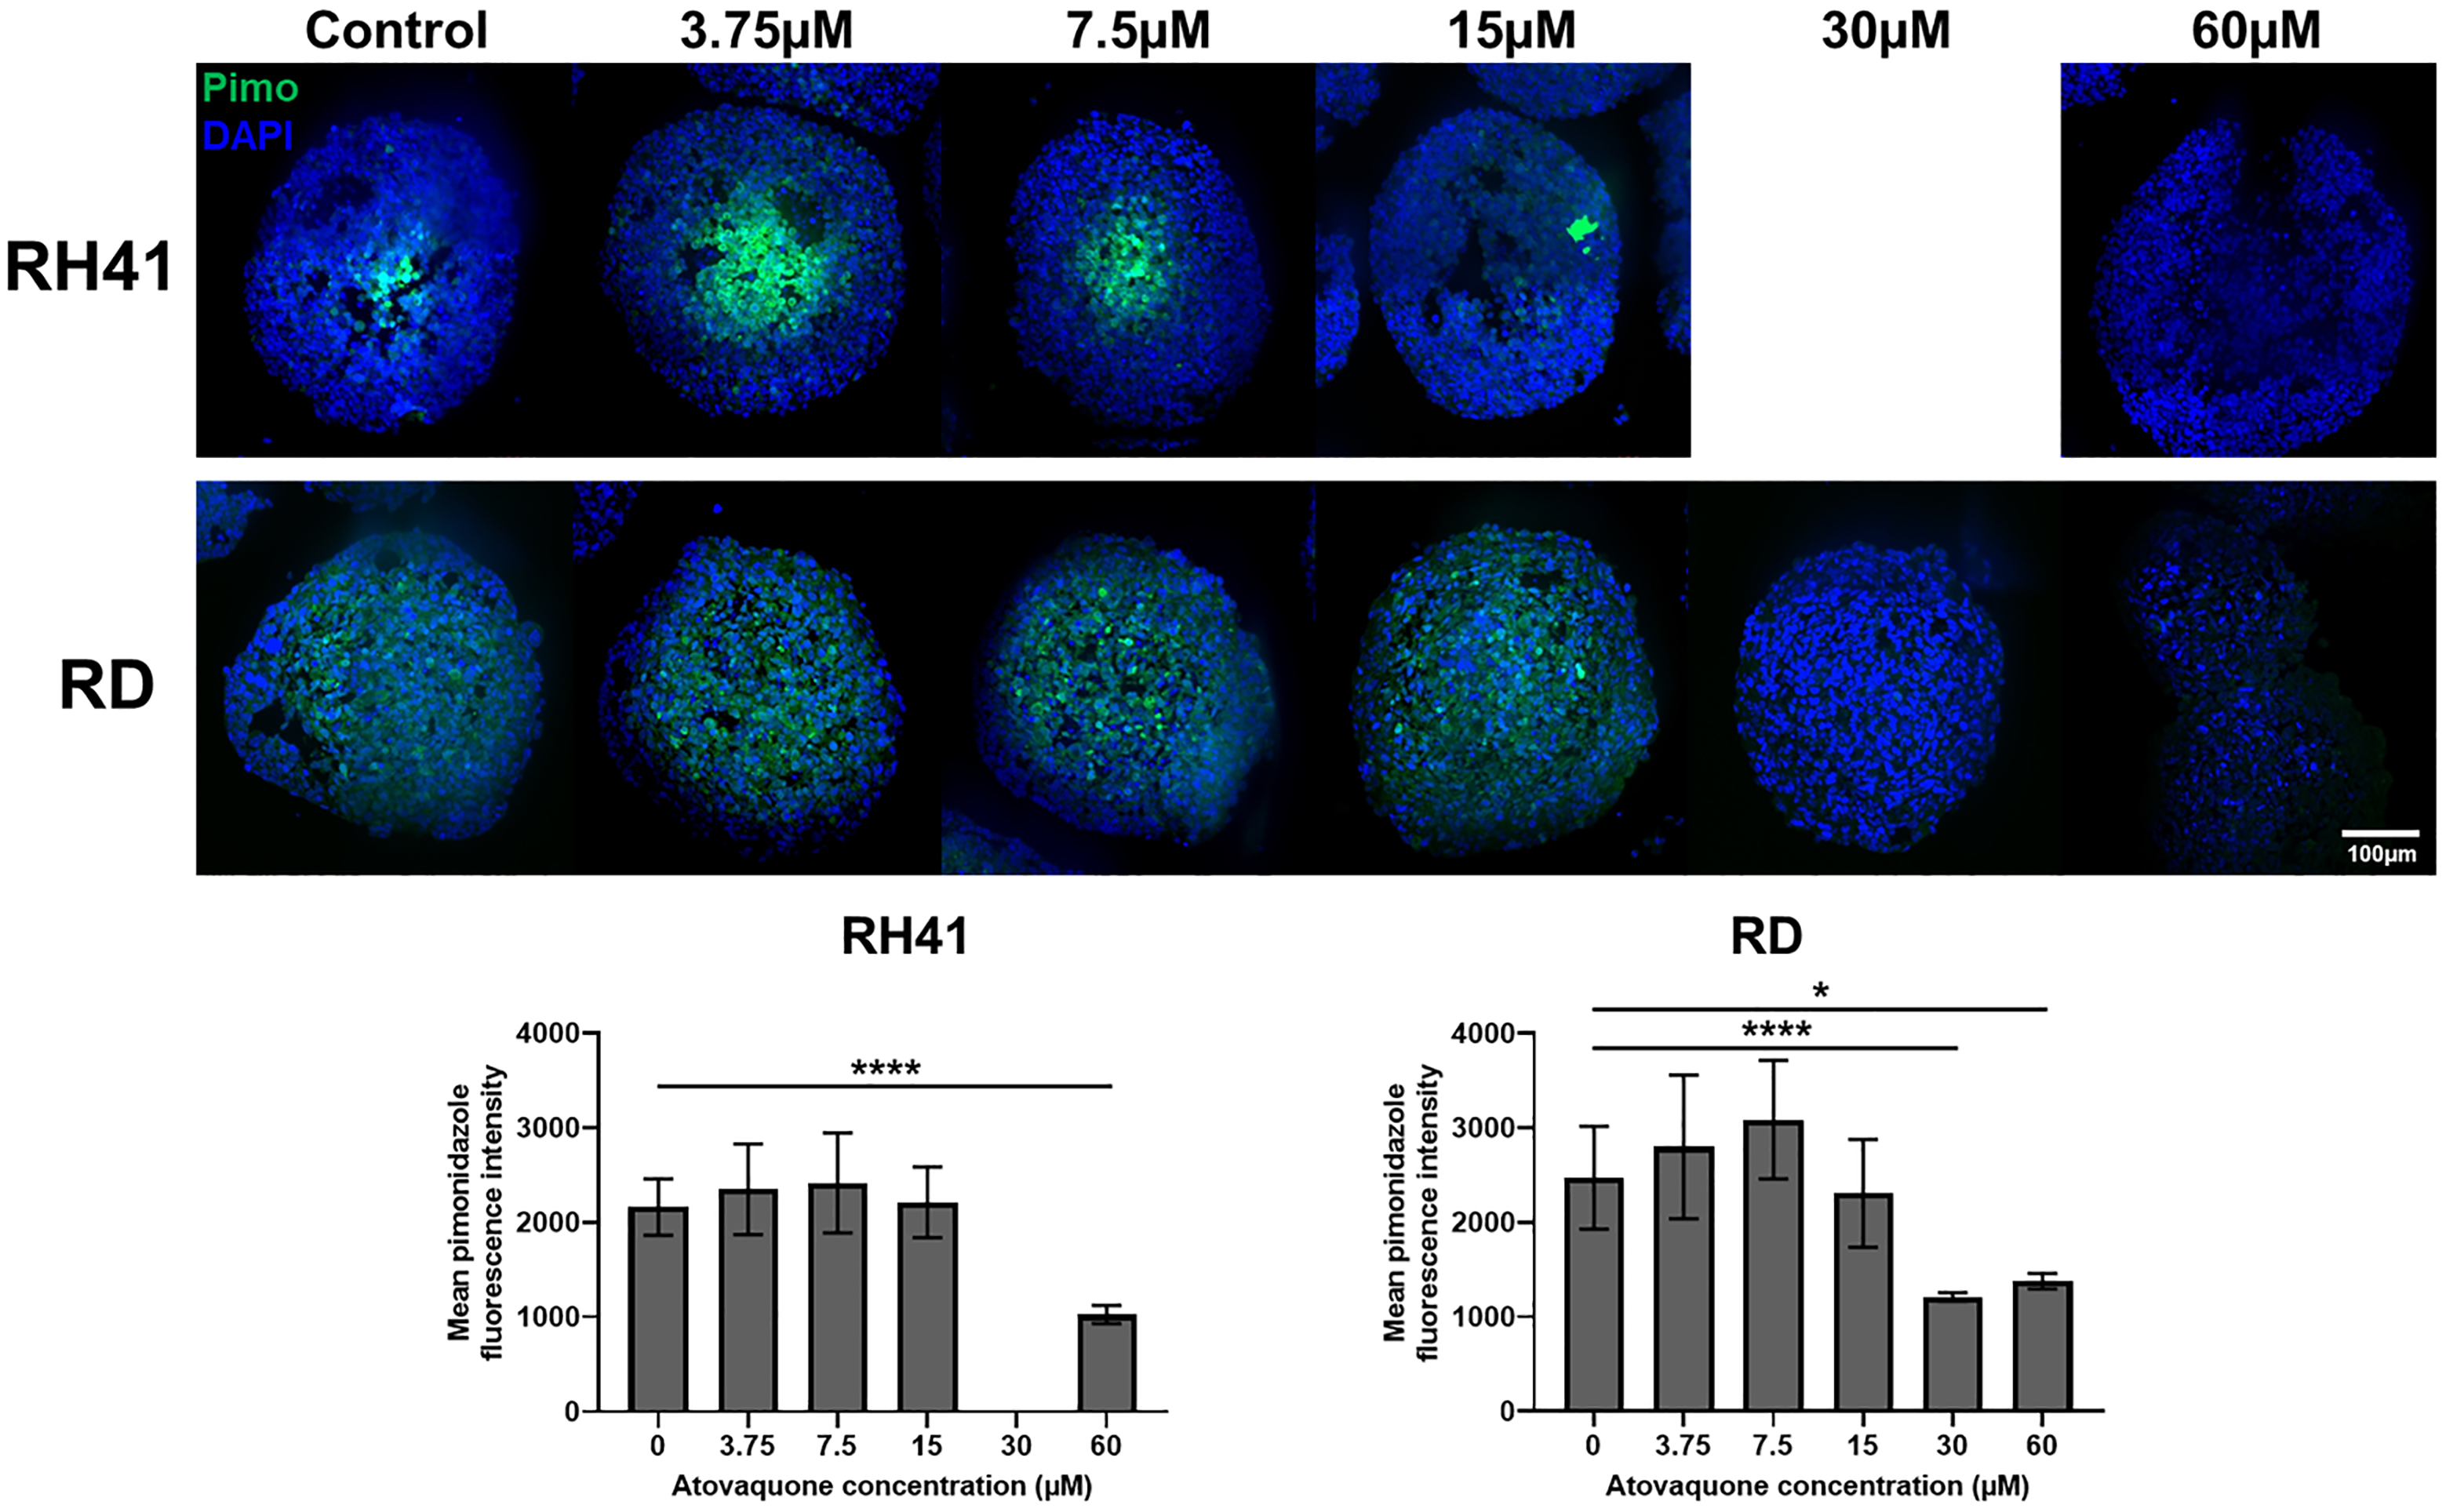
Figure
4. Paraffin-embedded
sections of RH41 and RD spheroids stained
for pimonidazole adduct formation (green) with DAPI as a nuclear counterstain
(blue) following 24h treatment with a range of atovaquone concentrations or
DMSO control. Quantification of pimonidazole
fluorescence intensity in n≥3 spheroids, presented as mean±SD. * P<0.05,
****P<0.0001, one-way ANOVA.
DOI: https://doi.org/10.58530/2022/2754