2753
Dynamic Contrast Enhanced MR Wavelet-Based Radiomics Analysis for Characterization of Tumor Heterogeneity of Rat Brain Tumors1Radiation Oncology, Henry Ford Cancer Institute, Detroit, MI, United States, 2Department of Mechanical & Aerospace Engineering, University of Florida, Gainesville, FL, United States, 3Neurology, Henry Ford Cancer Institute, Detroit, MI, United States
Synopsis
Wavelet-analysis of DCE-MR images was performed to explore the association between radiomics information and relaxivity-change (ΔR1) in human U251n tumors grown in rat brains. Sixteen DCE-MRI experiments (8 rats before- and after- radiation) were studied. Wavelet-decomposition analysis was performed using ΔR1 time trace. Frequency-based localized approximations of ΔR1 with four degrees of regularities were estimated and compared to the volume-transfer-constant (Ktrans, calculated from a modified Tofts-model pharmacokinetic analysis). Results confirm strong associations between wavelet-based radiomic information and contrast uptake/flow/leakage in the tumor vasculature. Results suggest that radiomics has potential as a biomarker of tumor physiology.
Introduction
Understanding tumor physiological mechanisms that impact tumor structure and microenvironment can improve cancer patient survival1-3. Tumor heterogeneity in cancers has been observed at the histological and genetic levels, and a body of evidence demonstrates its impact on therapeutic outcomes1-3. Variation in cell packing density (VCPD), hypoxia, acidosis, and elevated interstitial fluid pressure (IFP) are a few characteristics of solid tumors. It has been shown that tumor vascular networks and the distribution of tumorous cells inside and on the periphery of solid tumors are spatially heterogeneous4,5. Tumor heterogeneity at the cellular level, elevated IFP, and VCPD in solid tumors influence tumor pathology and are fundamental to understanding the response to treatment and probability of recurrence4,5. Therefore, non-invasive quantification of tumor heterogeneity and heterogeneity-based stratification of different types of tumors facilitate diagnosis and response of tumors to treatment. Recent studies have shown that radiomics, which is the science of extracting hidden and subtle information from medical images6-9, can be meaningfully linked to different tumor characteristics such as tumor biology, tumor physiology, tumor heterogeneity, its mutation status, HPV status, the level of aggression, chance of response to treatment, recurrence, metastases, etc.2 . This pilot study investigates the value of wavelet-based radiomics information extracted from dynamic contrast-enhanced magnetic resonance images (DCE-MRI) of rat brain tumors. Frequency components of the signal were decomposed using wavelet decomposition to perform the radiomics analysis. The goal was to explore the associations of the extracted radiomics information with tumor permeability parameters estimated using pharmacokinetic analysis (modified Tofts model).Methods
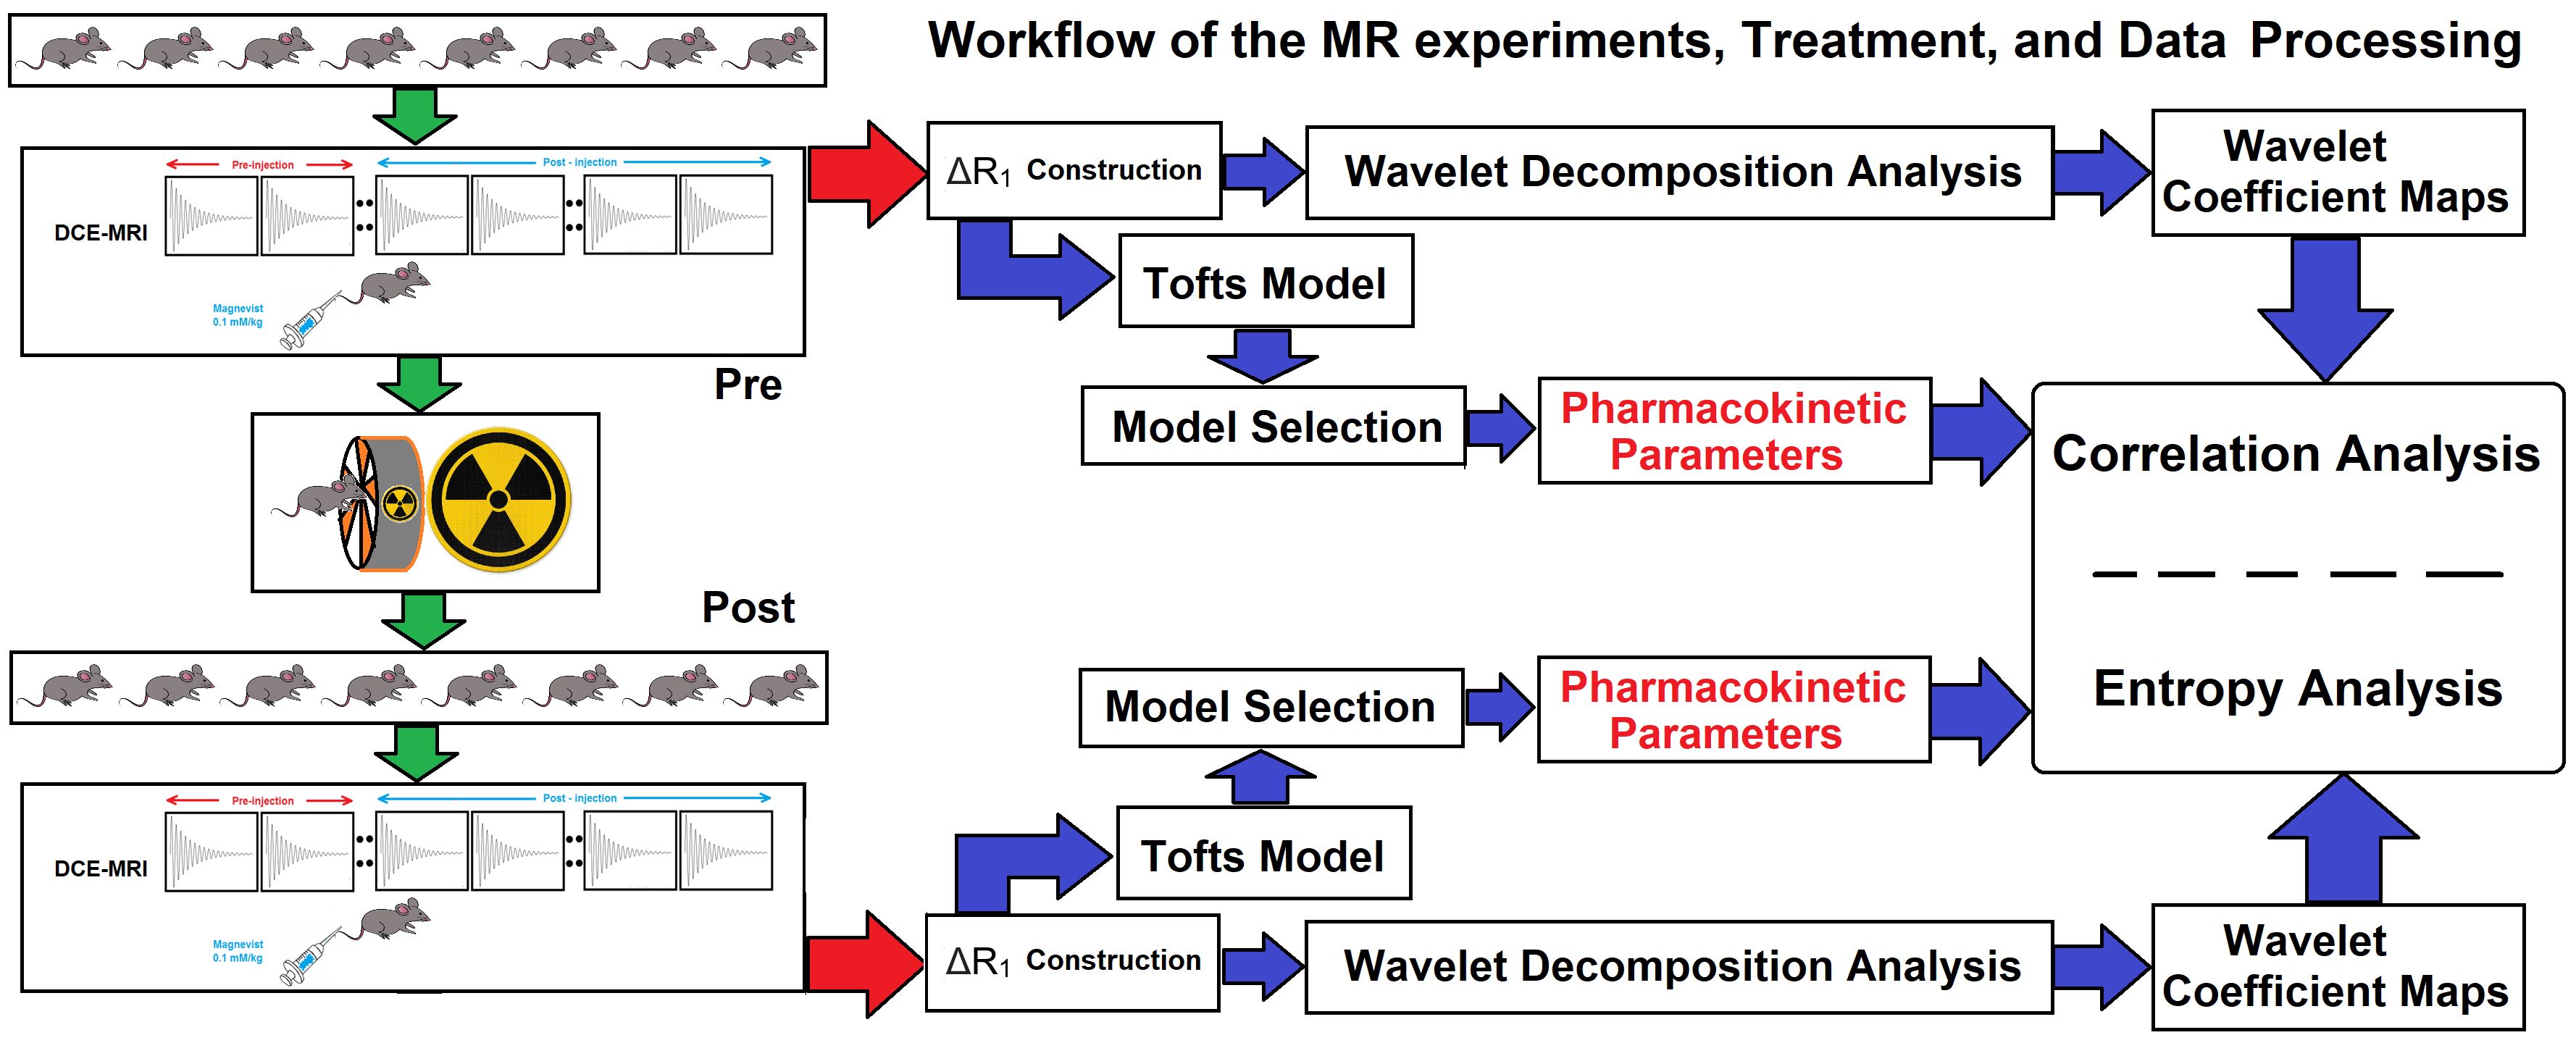
Eight adult female immune-compromised-RNU/RNU rats were stereotactically implanted with human U251n cancer cells to form an orthotopic glioma (IACUC #: 1509). For each rat, two DCE-MRI studies (multi-slice, multi-echo gradient-echo sequence, with three 2.0 mm slices, no gap, matrix:128x64, FOV:32x32mm2, TR/ (TE1-TE2)=24ms/(2ms-4ms), flip-angle=18º, SW=150 kHz) were performed using a 7T Varian (Agilent, 20cm bore system with Bruker console) scanner. DCE-MRI was performed using 400-acquisitions at 1.55s intervals (experiment duration: 10min). A bolus of magnetic-resonance contrast-agent (MRCA-Magnevist) was injected (tail-vein) by hand push at acquisition 15. Two DCE-MRI studies taken 24h apart with a single 20Gy stereotactic radiation exposure performed before the second study (see Figure-1). The time trace of relaxivity change (ΔR1 α CA concentration) in all the voxels of the animal’s brain for the 16 DCE-MRI studies (4 in non-treated control studies, 6 experiments before and 6 after Radiation Therapy) were calculated. The post-treatment MRIs were taken a range of 1-6.5 hrs post-radiation. A wavelet decomposition analysis was performed on the time trace of the ΔR1 for each voxel and the frequency-based localized approximations of the ΔR1 with four degrees of regularities at different scales were estimated. In each decomposition level, the ΔR1 profile was downsampled and decomposed into approximation and detail coefficients using an orthogonal mother wavelet (Daubechies, moment=2). The power of the wavelet coefficient was calculated for each voxel and four different wavelet coefficient maps corresponding to different regularities/scales were estimated. The volume transfer constant (Ktrans, outward leakage from the vascular compartment to the extracellular-extra-vascular compartment) map was estimated and derived by the modified Tofts model and a nested model selection technique10,11. Finally, the correlation coefficients between the Ktrans map and its corresponding wavelet coefficient map in the tumor region were calculated and the entropy of each map was estimated.Results
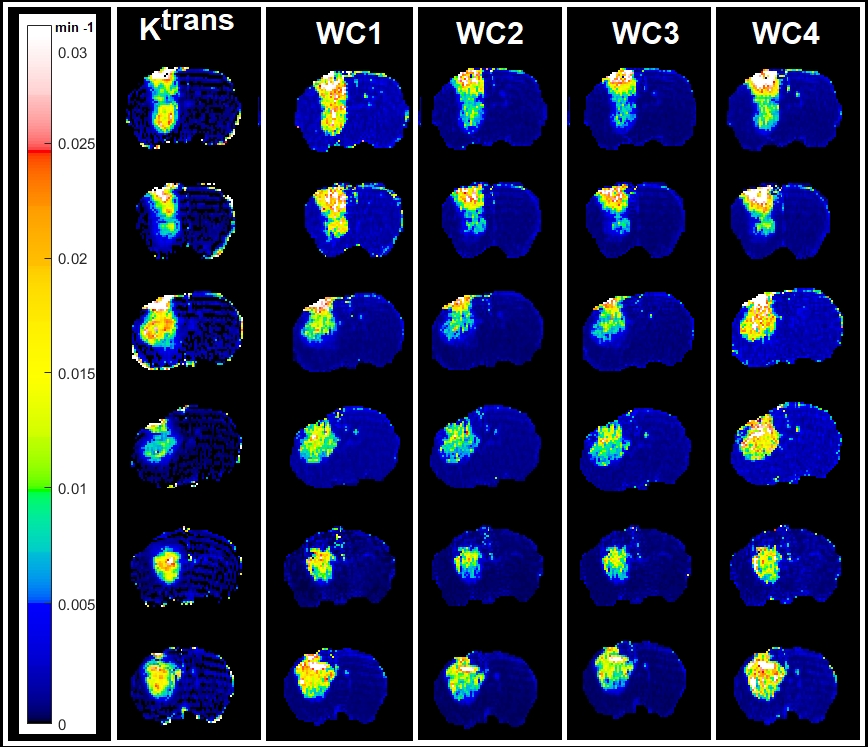
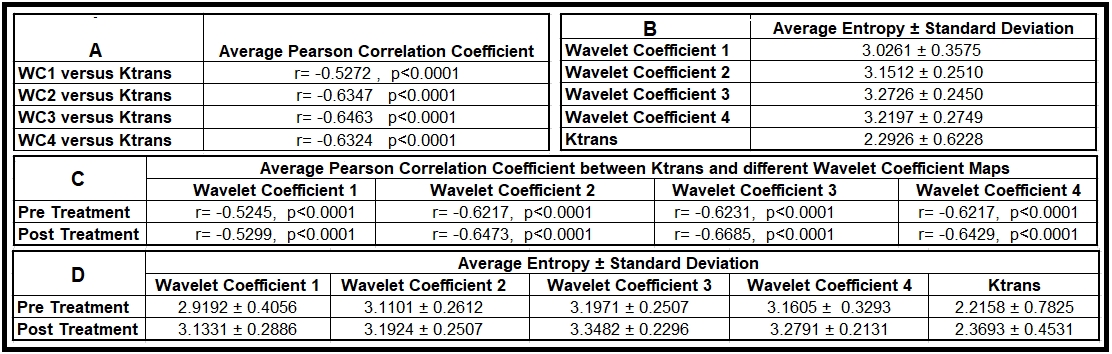
Figure-1 illustrates the workflow of DCE-MR experiments, treatment, wavelet-based radiomic analysis, and data processing for the eight animals. The voxel-wise Pearson correlation coefficients and the measure of entropy for 16 DCE-MRI experiments (eight subjects; 8 pre- and 8 post- RT) are shown in Table-1. Figure-2 shows the map of transfer constants (Ktrans) and its four corresponding wavelet coefficient maps for six different exemplary brain slices.Discussion
Figure 2 and Table-1 demonstrate the strong correlation between the wavelet-based radiomic information extracted from ΔR1 and tumor vascular leakiness (Ktrans). The average value of the entropy calculated from the tumor zone of the Ktrans maps were significantly lower than the average value of the entropy of the four wavelet coefficient maps, illustrating the wavelet-based radiomic information captures more spatial heterogeneity information (higher entropy) from the tumor compared to the Ktrans. As shown in Figure 2, as the wavelet coefficient increases from a lower to higher number, the decomposed frequency of the signal deceases from higher to lower and less details are captured by the analysis. Table 1D shows that the average value of the tumor entropy in the four wavelet coefficient maps and their Ktrans increases after the treatment. From the information theory perspective, these findings indicate that treatment increases the level of information of the tumor. Thus, after radiation, the heterogeneity level in the tumor increases.Conclusion
This pilot study confirmed that wavelet-based radiomic analysis is an effective approach to decompose tumor imaging information, as a function of frequency demonstrating potential to provide comprehensive information directly from images without the need for pharmacokinetic modeling and related complex analyses. This study also demonstrated a connection between radiomics and spatial heterogeneity of the tumor, which can be linked to tumor aggressiveness. As such, this work represents an important first step toward potentially connecting radiomics with underlying biological mechanisms.Acknowledgements
This work was supported in part by a grant from Varian Medical Systems (Palo Alto, CA).References
1.Reardon, D.A. and P.Y. Wen, Glioma in 2014: unravelling tumour heterogeneity-implications for therapy. Nat Rev Clin Oncol, 2015. 12(2): p. 69-70.
2.Sala, E., et al., Unravelling tumour heterogeneity using next-generation imaging: radiomics, radiogenomics, and habitat imaging. Clin Radiol, 2017. 72(1): p. 3-10.
3.Keller, L. and K. Pantel, Unravelling tumour heterogeneity by single-cell profiling of circulating tumour cells. Nat Rev Cancer, 2019. 19(10): p. 553-567.
4.Goel, S., et al., Normalization of the vasculature for treatment of cancer and other diseases. Physiol Rev, 2011. 91(3): p. 1071-121.
5.Horsman, M.R. and P. Vaupel, Pathophysiological Basis for the Formation of the Tumor Microenvironment. Front Oncol, 2016. 6: p. 66.
6.Aerts, H.J., et al., Decoding tumour phenotype by noninvasive imaging using a quantitative radiomics approach. Nat Commun, 2014. 5: p. 4006.
7.Gillies, R.J., P.E. Kinahan, and H. Hricak, Radiomics: Images Are More than Pictures, They Are Data. Radiology, 2016. 278(2): p. 563-77.
8.Lambin, P., et al., Radiomics: extracting more information from medical images using advanced feature analysis. Eur J Cancer, 2012. 48(4): p. 441-6.
9.Yip, S.S. and H.J. Aerts, Applications and limitations of radiomics. Phys Med Biol, 2016. 61(13): p. R150-66.
10.Bagher-Ebadian, H., et al., Model selection for DCE-T1 studies in glioblastoma. Magn Reson Med, 2012. 68(1): p. 241-51.
11.Ewing, J.R. and H. Bagher-Ebadian, Model selection in measures of vascular parameters using dynamic contrast-enhanced MRI: experimental and clinical applications. NMR Biomed, 2013. 26(8): p. 1028-41.
Figures