2746
T2 Relaxometry in the Prediction of Progression-Free Survival in Patients with Primary Glioblastoma: Whole Brain and Deep Learning Approach1Dept. of Radiology, Na Homolce Hospital, Prague, Czech Republic
Synopsis
Glioblastoma (GBM) is the most common and aggressive primary brain tumor. Any methods that may improve confirmation or early detection of progression are highly desirable. T2 relaxometry shows great promise in the monitoring of GBM patients following complex therapy. We found WB metrics, such as median 1/T2, correlated with PFS and were able to distinguish progression from pseudo-progression. A deep neural network trained on automatically segmented 1/T2 data achieved an F1 accuracy of 85% in classifying progression with a threshold of 18 months.
INTRODUCTION
Glioblastoma (GBM) is the most common and aggressive primary brain tumour. Patients are typically treated by surgical resection, followed by chemo- and radiotherapy. MRI follow up of these patients is a routine part of radiological practice, and serves to detect or confirm disease progression. Pseudo-progression following complex treatment is not uncommon and complicates follow up. Thus any methods that may improve confirmation or early detection of progression are highly desirable. We aimed to evaluate T2 relaxation times in the follow up of these patients.METHODS
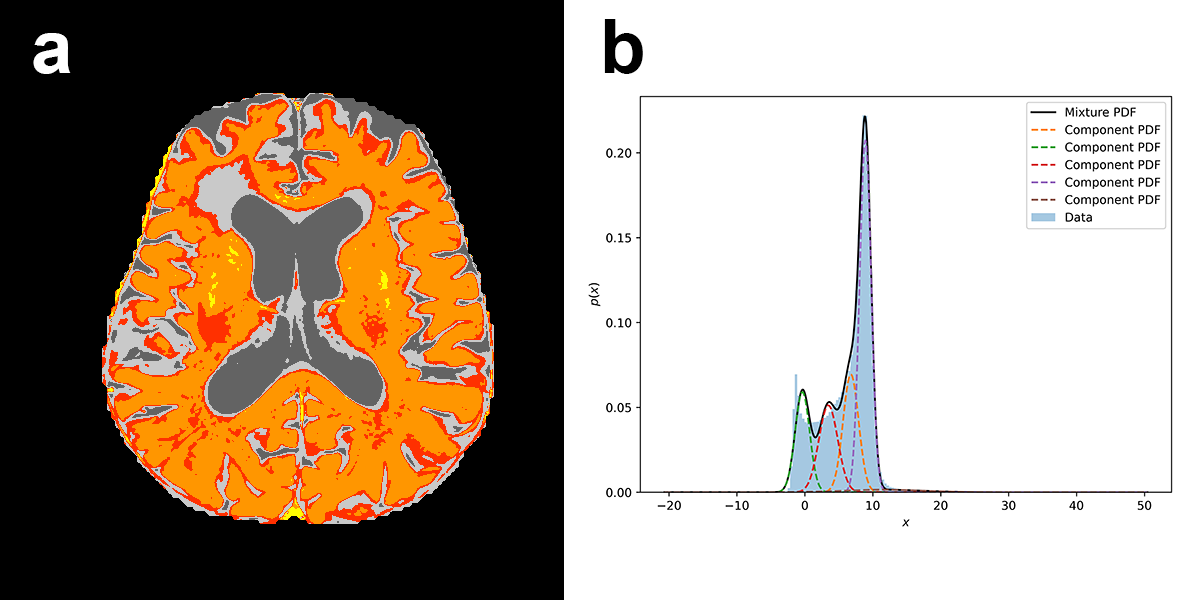
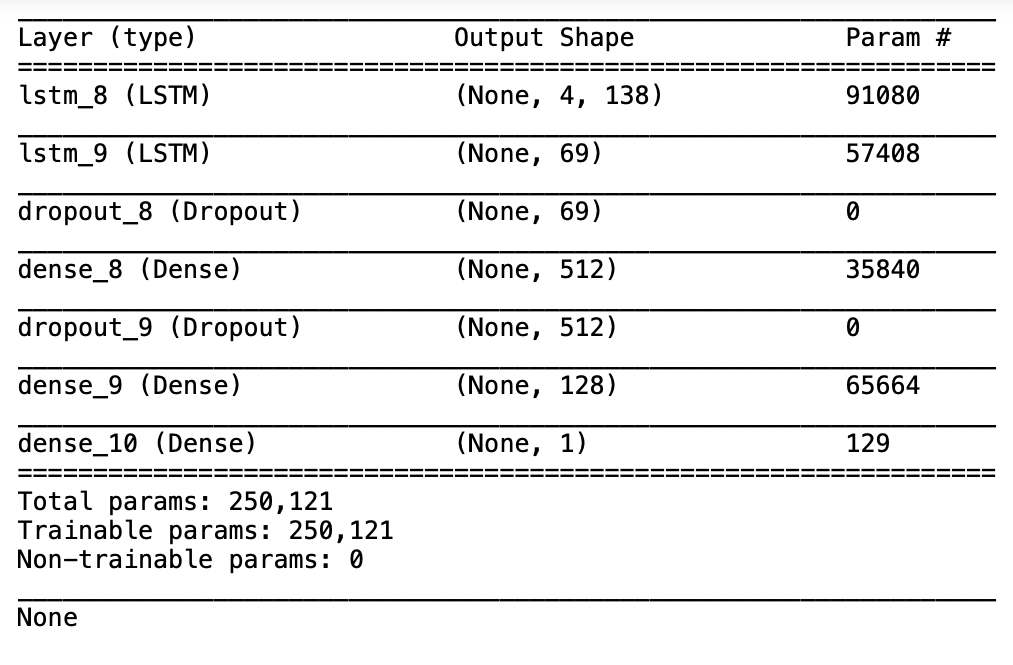
In this partially retrospective study, we identified 139 patients with non-recurrent GBM followed by MRI at our institution roughly every 2 months after complex treatment, for potential inclusion. Of these patients, 50 were selected based on inclusion criteria (>180 days progression-free survival [PFS] as determined by RANO criteria1, ≥3 MRI examinations in the progression-free interval [same scanner and protocol]). All data used were prior to progression. All subjects underwent a standard diagnostic imaging protocol, which included a dual echo fast spin echo sequence, producing PD and T2 weighted images. Imaging was performed at 3 field strengths (15 subjects at 3T, 21 at 1.5T, 14 at 1T). T2 relaxation rates (1/T2) were calculated on a voxel-wise basis from PD and T2 images assuming mono-exponential decay; preliminary comparison with CPMG data showed very high correlation. Brain extraction was performed on the T2-weighted images using HD-bet2 and the masks applied to 1/T2 volumes. Whole-brain (WB) values were extracted from each volume including skewness, kurtosis, mean, median, 15 and 85 percentile histogram values and variance. We additionally segmented the 1/T2 volumes using a 5 compartment Gaussian mixture model in Python v3.8.2 using the sklearn package, and recorded the mean, variance and percent of voxels for each component (Figure 1). Finally, to evaluate predictive potential with respect to PFS, we used a deep long short-term memory (LSTM) model (Figure 2) using tensorflow v2.3.1, over 4 timesteps. Twenty subjects were included in the predictive model, as the inclusion criteria were more strict (documented progression, ≤120 days between all MRIs [mean 43.6 days], ≥4 progression-free MRIs). Two neural network models were tested: a regression model (days to progression) and a classification model (±18 months PFS; models only differed in output layer). Both models were run 10 times including train-test split; mean results are presented.RESULTS
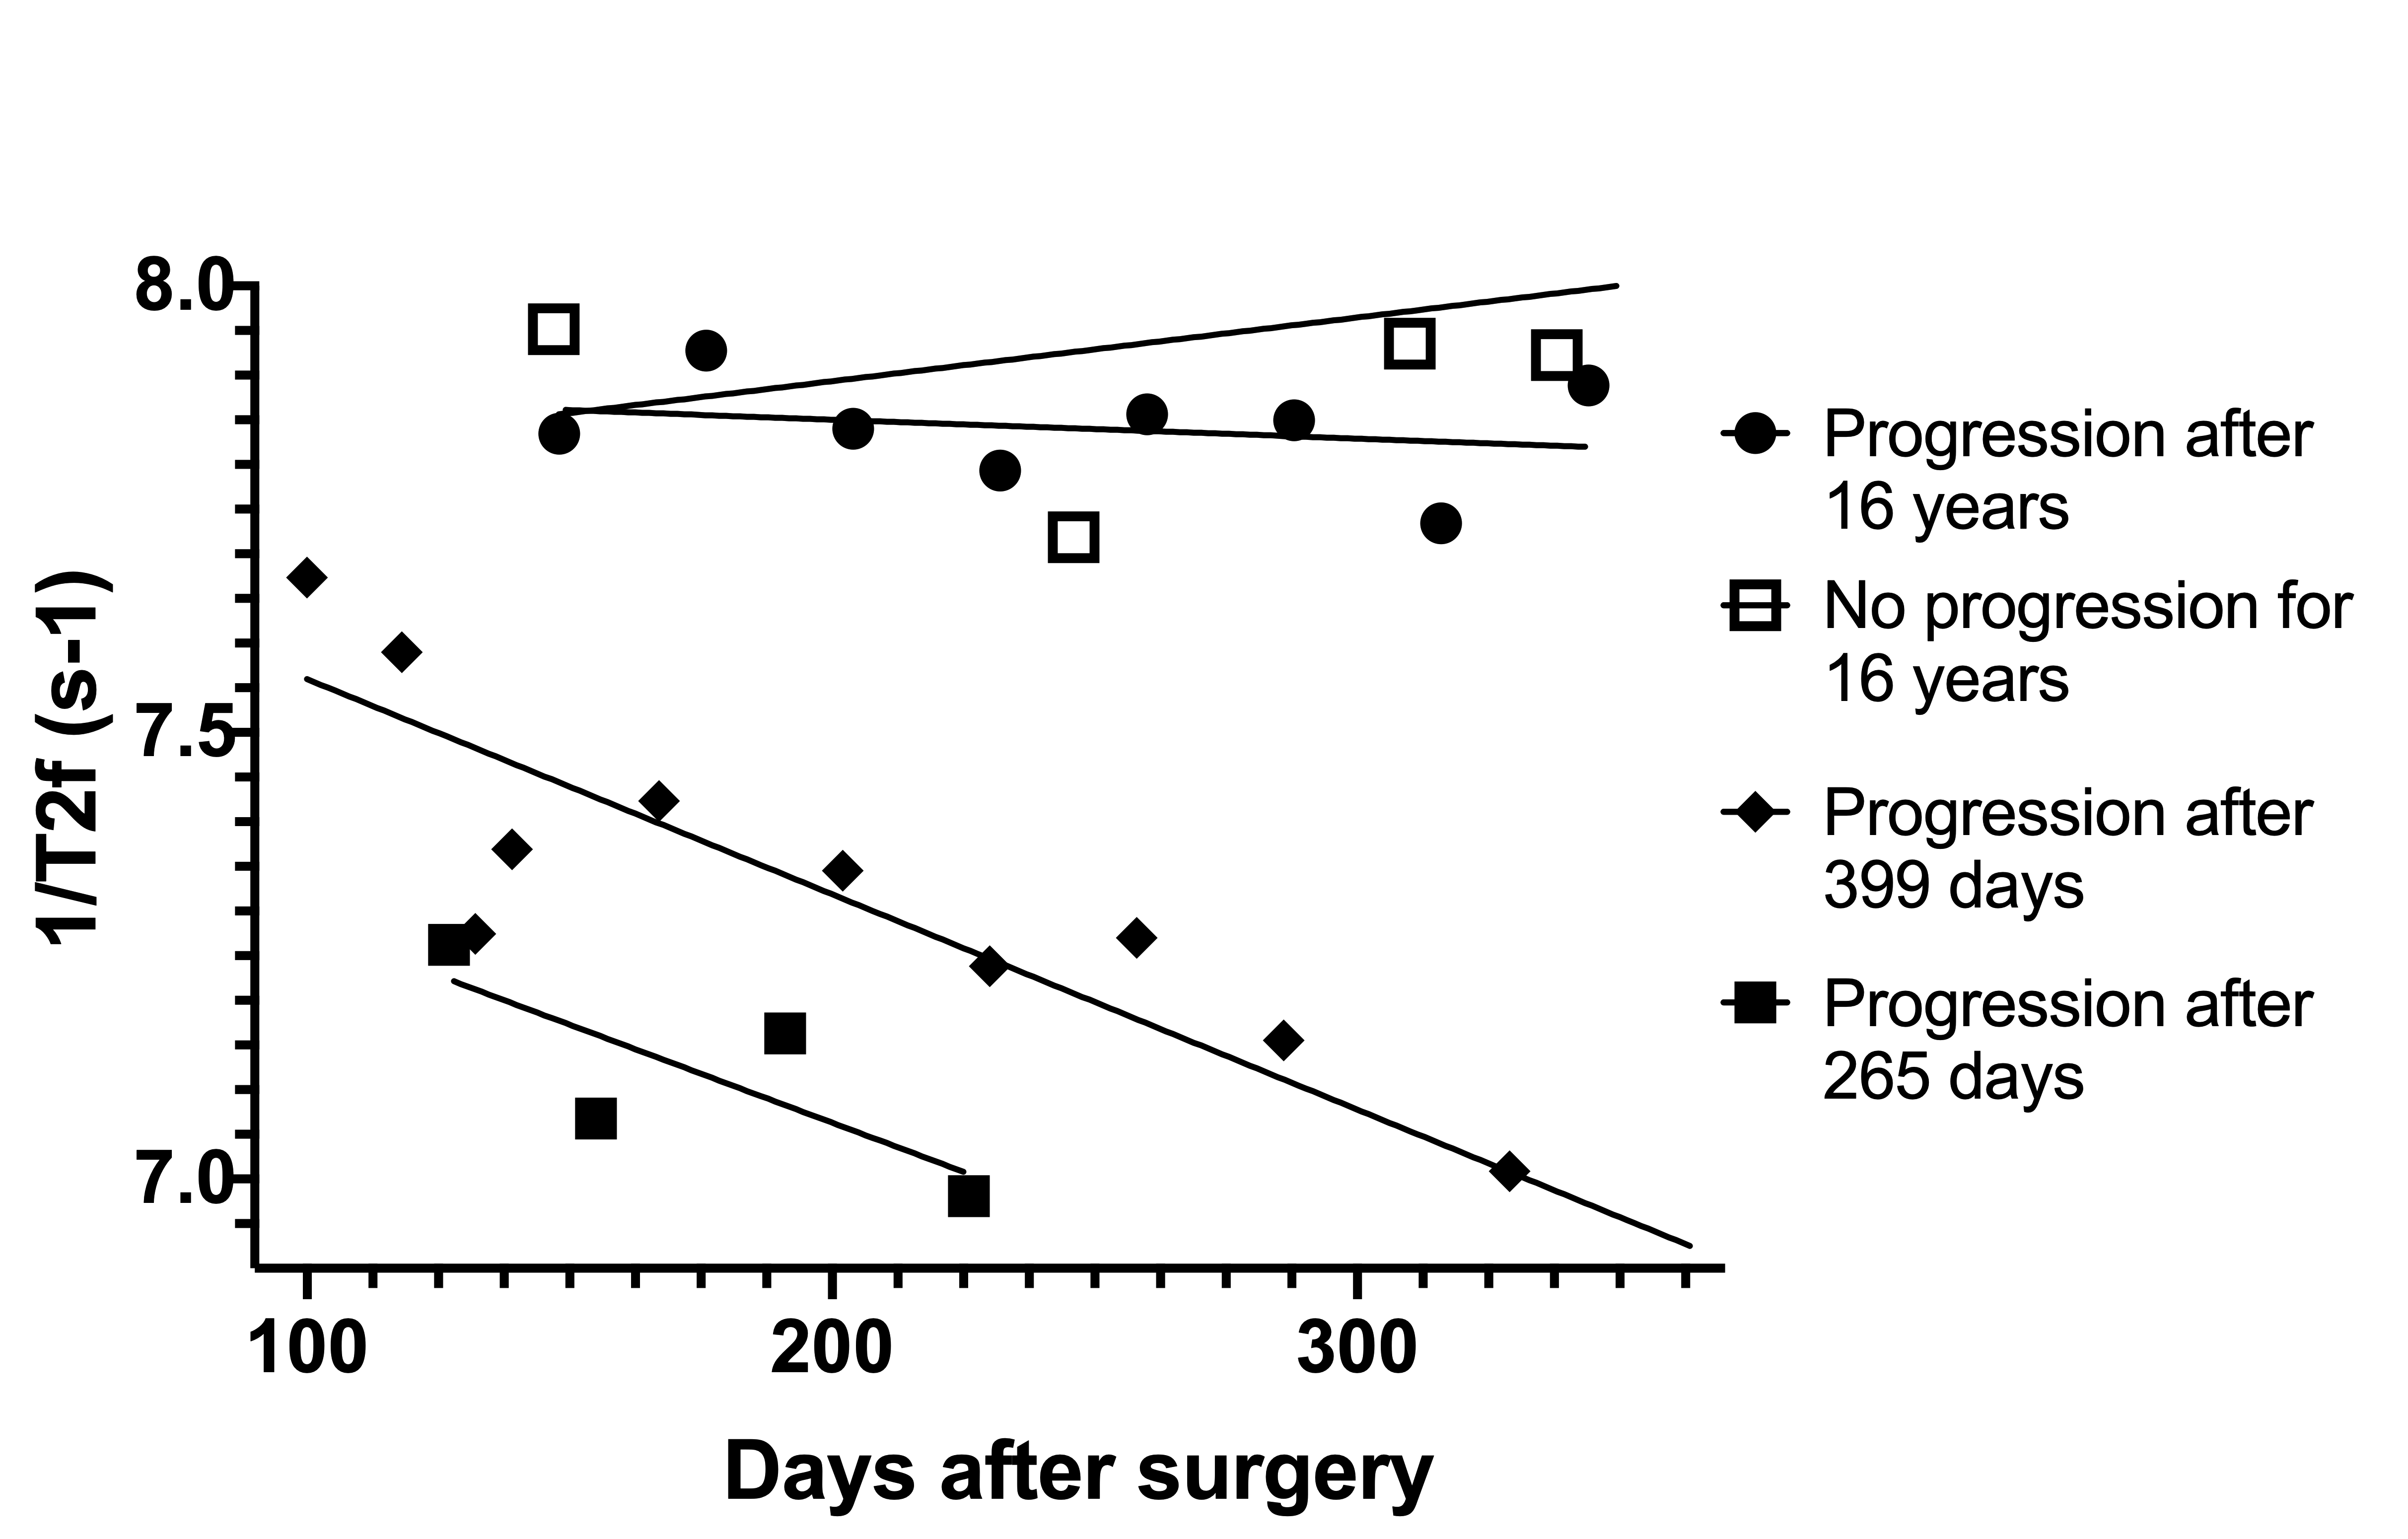
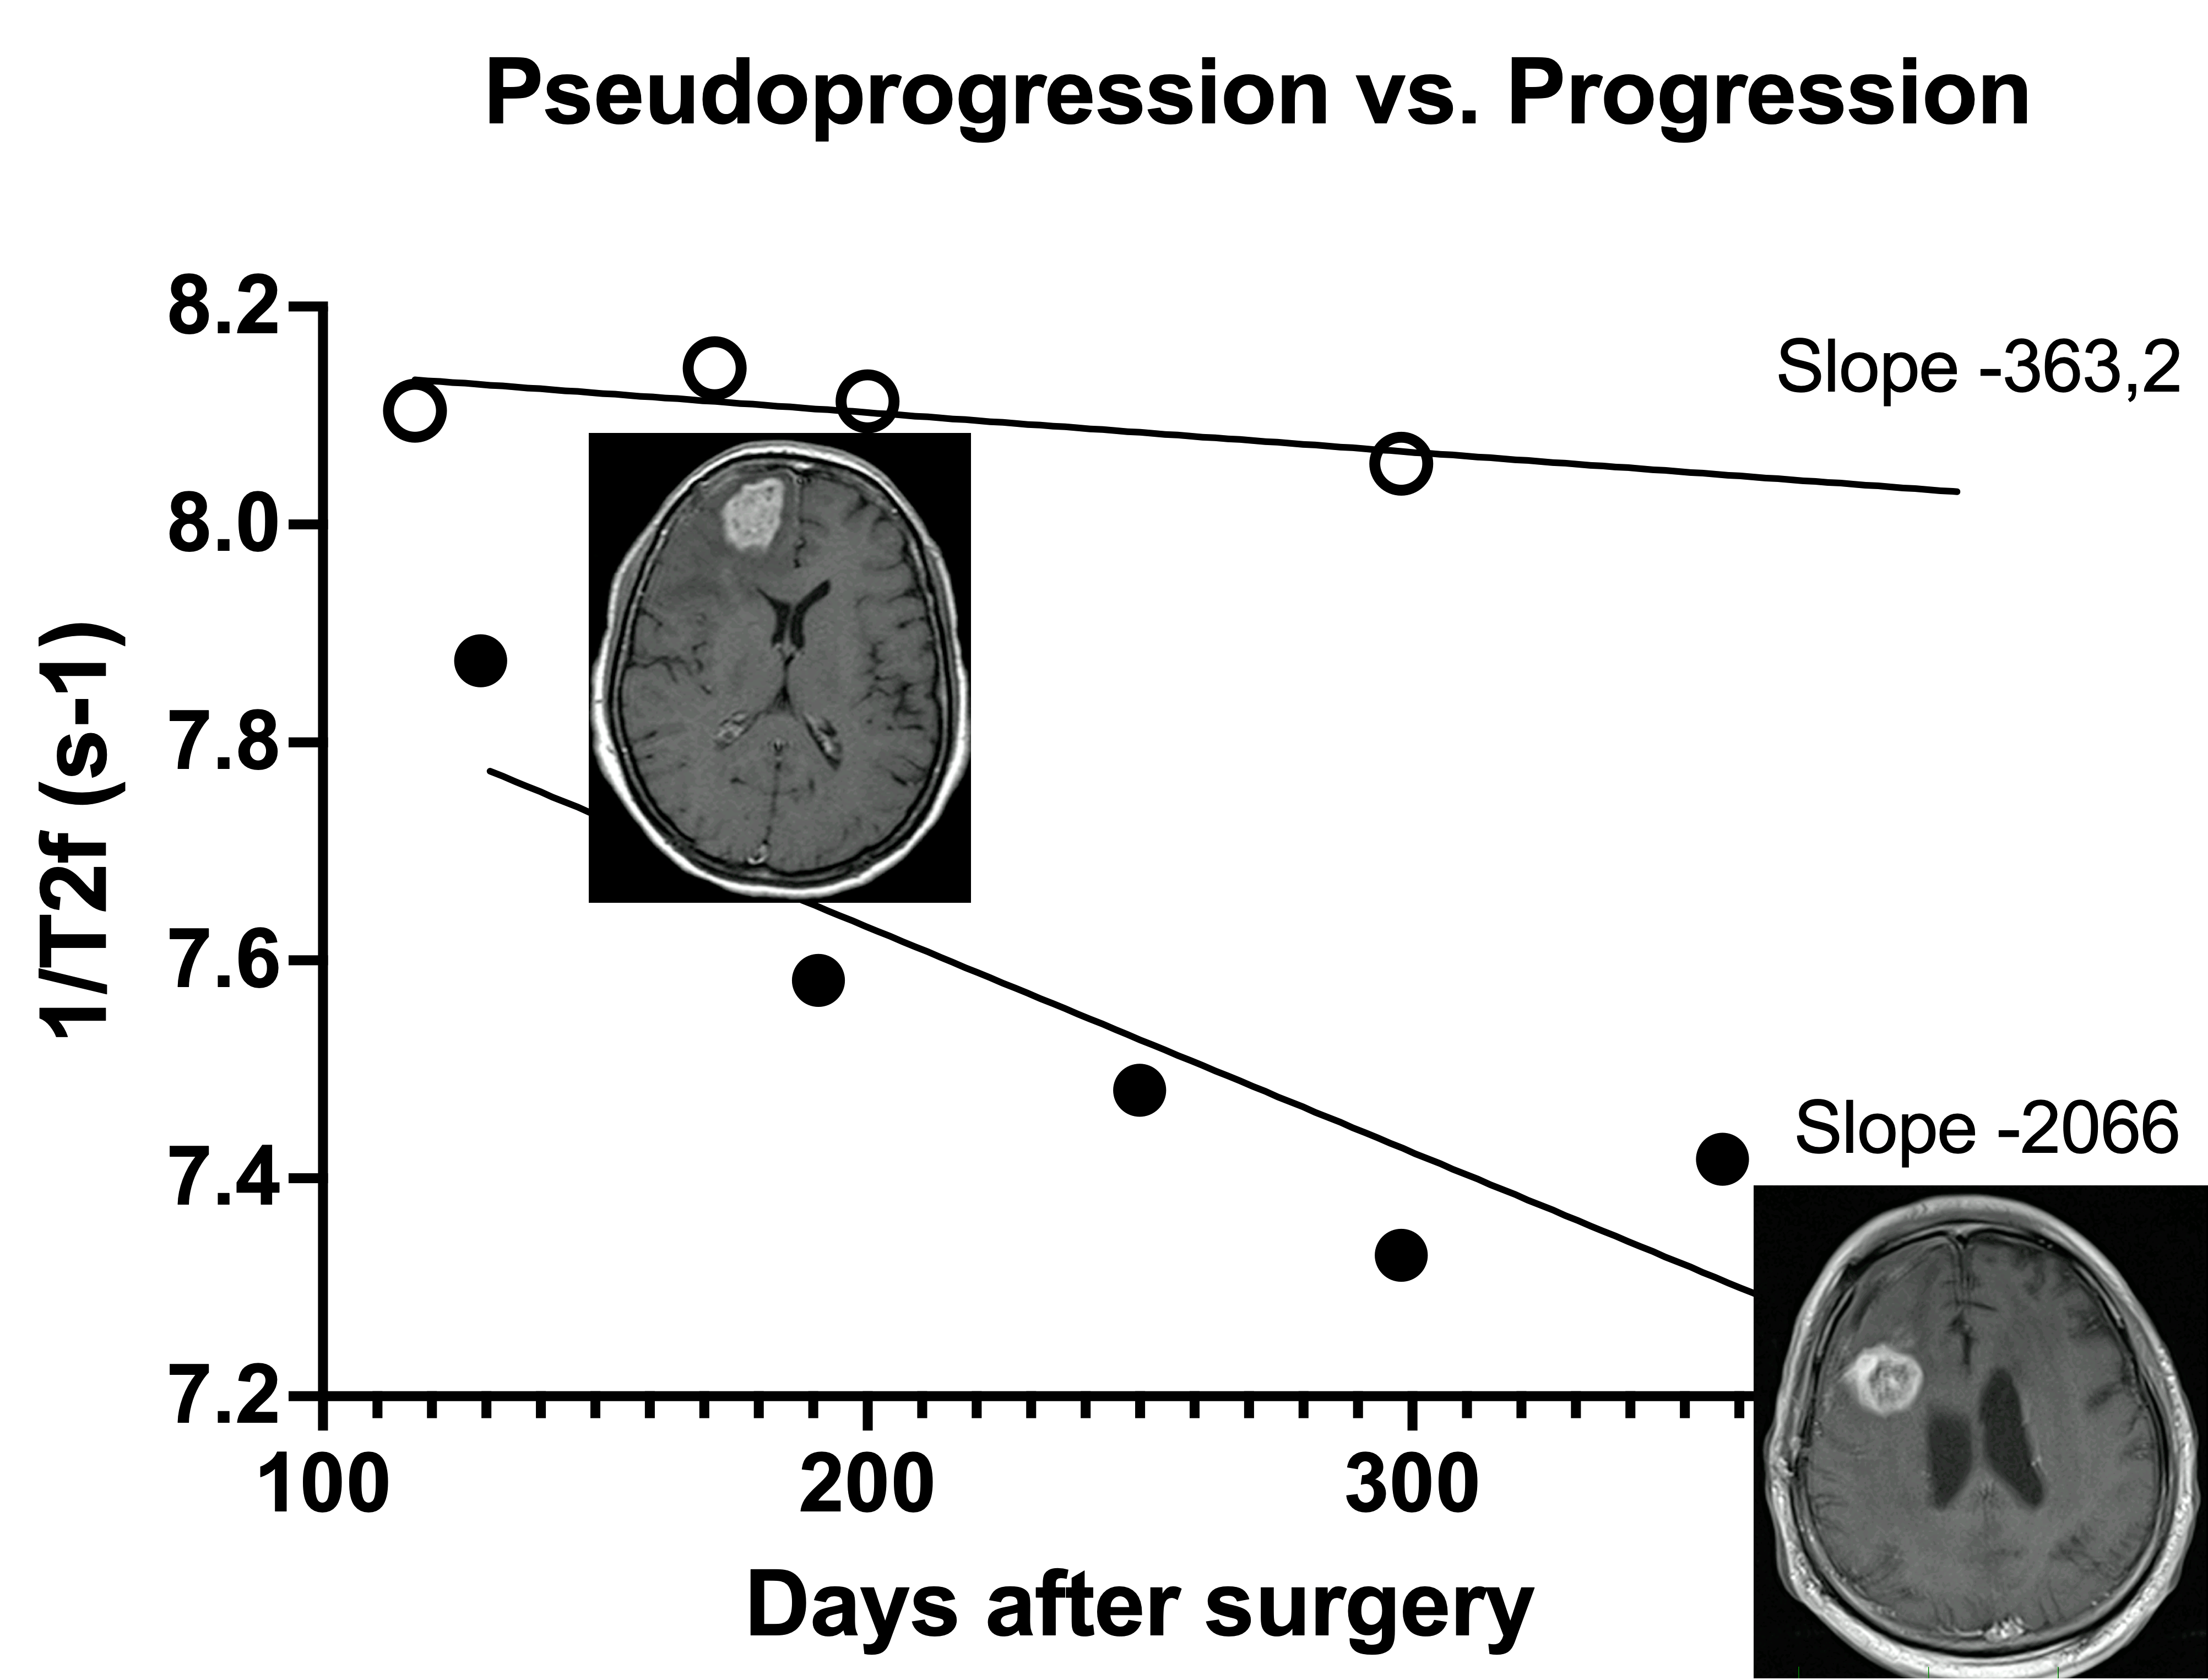
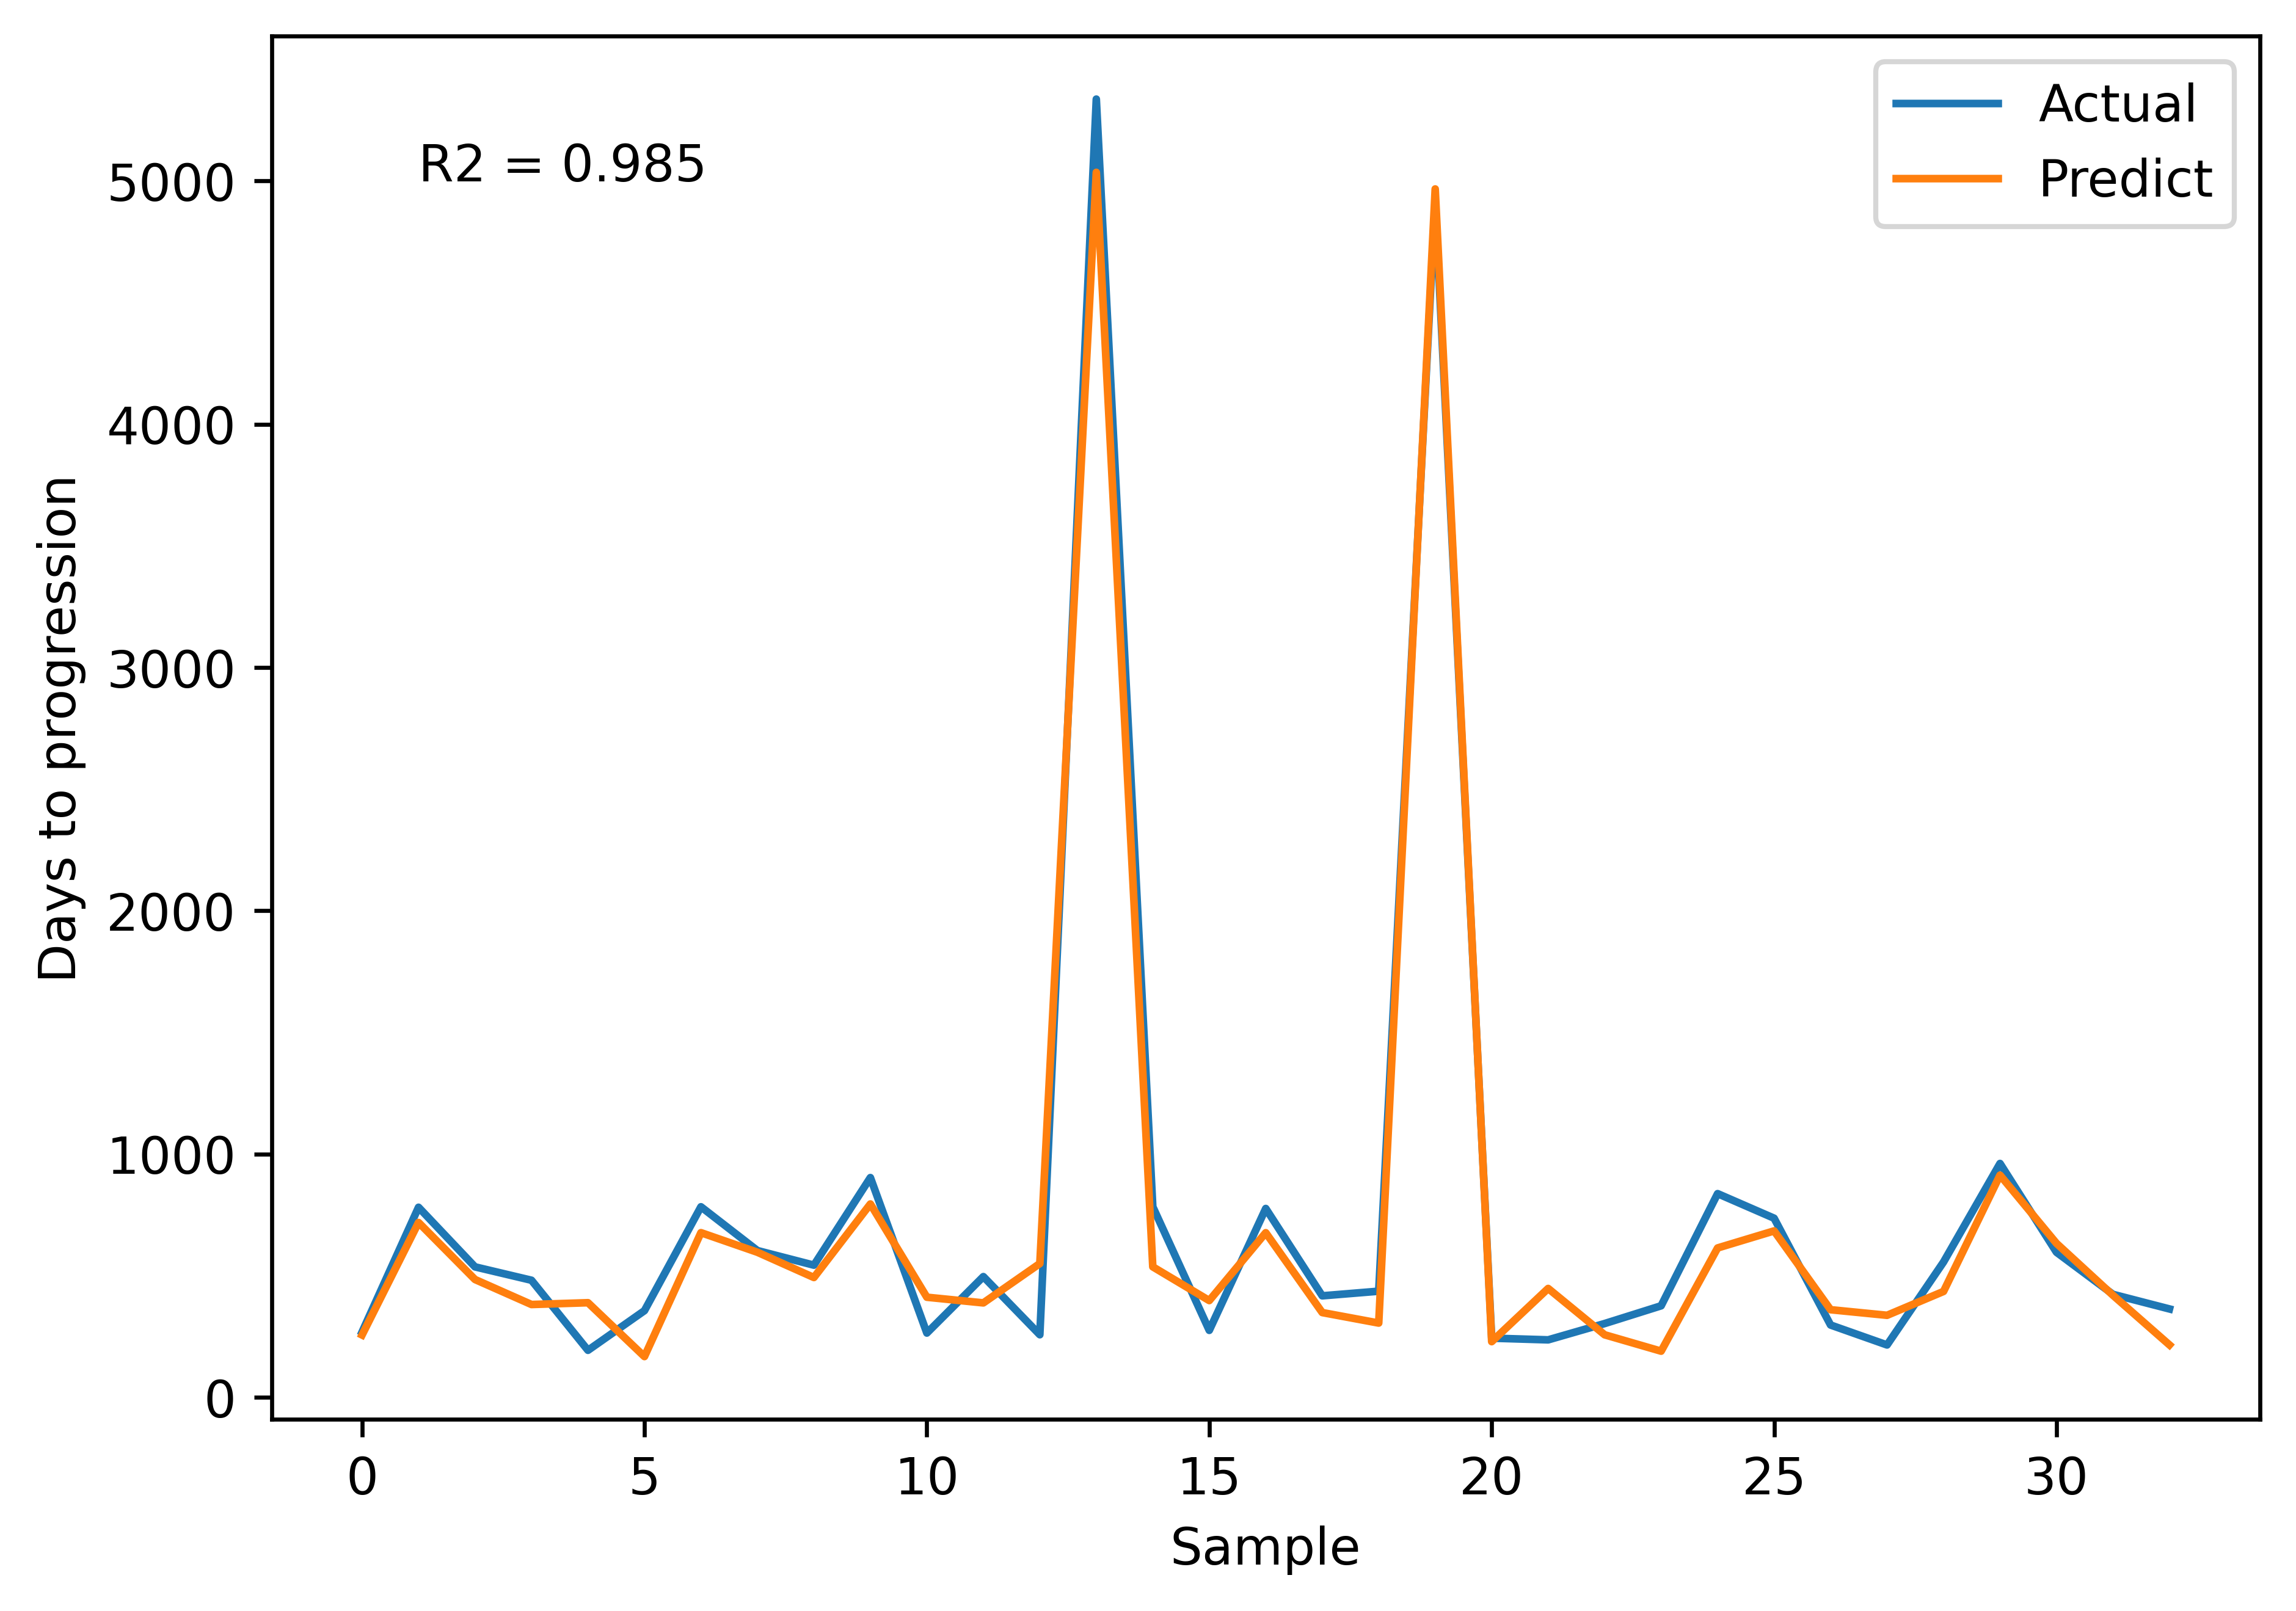
We found WB median 1/T2f correlated with PFS, as values appeared to decrease with otherwise undetectable disease progression (Figure 3). WB median 1/T2 linear regression slopes also appeared to differ in progression vs. pseudo-progression (Figure 4). Furthermore, WB median 1/T2 linear regression slopes in all patients followed an approximately logarithmic distribution with respect to PFS at each field strength. The deep LSTM regression model achieved an R2 of 97% (Figure 5). Based on regression results and structure of the data (class balance), a classification cut-off of 548 days (18 months) PFS was chosen. The deep LSTM classification model achieved a mean macro precision of 86%, recall 85% and F1 accuracy of 85%.DISCUSSION
GBM recurrence is nearly universal and the monitoring of patients following complex treatment for GBM is a routine part of clinical radiological practice. Methods enabling earlier detection or confirmation of GBM progression on MRI are highly desirable, as this may lead to earlier intervention and improved patient outcomes. GBM is deeply infiltrative and typically affects a large volume of the brain, beyond what can be appreciated macroscopically and on standard imaging. Thus it is not entirely surprising that simple WB measurements, such as median 1/T2, may reveal otherwise undetectable progression. The advantage of WB measurement is clinical applicability, as clinicians may be reluctant to embrace more complex methods in routine practice. We found very intriguing results with WB median 1/T2 measurements in distinguishing progression from pseudo-progression, and in suggesting progression despite otherwise unremarkable imaging. To advance our study further, we explored a more complex predictive model, using a fully-automated segmentation method followed by deep learning, with very promising results. The present results may find utility in the monitoring of GBM patients and may be advantageous to include in multimodal predictive models.CONCLUSION
T2 relaxometry shows great promise in the monitoring of GBM patients following complex therapy. We found WB metrics, such as median 1/T2, correlated with PFS and were able to distinguish progression from pseudo-progression. A deep neural network trained on automatically segmented 1/T2 data achieved an F1 accuracy of 85% in classifying progression with a threshold of 18 months.Acknowledgements
No acknowledgement found.References
1. Wen PY, Macdonald DR, Reardon DA, et al. Updated Response Assessment Criteria for High-Grade Gliomas: Response Assessment in Neuro-Oncology Working Group. J. Clin. Oncol. 2010;28(11):1963-72. RANO
2. Isensee F, Schell M, Pflueger I, et al. Automated brain extraction of multi-sequence MRI using artificial neural networks. Hum Brain Mapp. 2019;40(17):4952–4964.
Figures