2745
A Deep Learning Approach for Automated Volume Delineation on Daily MRI Scans in Glioblastoma Patients1Radiation Oncology, University of Miami Sylvester Comprehensive Cancer Center, Miami, FL, United States, 2University of Miami Miller School of Medicine, Miami, FL, United States, 3West Physics, Atlanta, GA, United States, 4Department of Earth, Ocean, and Atmospheric Sciences, Florida State University, Tallahassee, FL, United States
Synopsis
Identifying early progressors following treatment for Glioblastoma (GBM) is paramount in GBM management. MRI-RT platforms provide opportunity for daily MRI of patients. We identified early changes in tumor volume typically starting week 3 or 4 of treatment. We hypothesize tumor volume kinetics are associated with outcome and allow for adapting treatment. We develop a deep learning solution for automatic volume delineation on daily scans, allowing real time monitoring of tumor changes and reducing time burden of segmentation. We obtained DSC for tumor lesion and resection cavity on training and test datasets (mean±standard deviation) 0.87±0.128 and 0.9±0.122; 0.74±0.233 and 0.8±0.277, respectively.
Introduction
Identifying patients who progress early following treatment for Glioblastoma (GBM) is of paramount importance in management of GBM. MRI following the initial six-week treatment period reveals gadolinium-enhanced volume increase in up to 49% of patients1. In approximately one-third of these patients the contrast uptake is a result of progressive tumor growth and in the remaining two-thirds, it is due to therapy changes termed pseudoprogression. True progression is characterized by continuous tumor growth despite treatment with a poor median survival ~10 months. Early differentiation of true and pseudoprogression would enable therapy modification and prevent unnecessary surgeries2. MRI-RT platforms, combining MRI and radiotherapy (RT), are rapidly becoming available, providing the opportunity to acquire daily MRI for radiotherapy patients3,4. GBM patients undergo MRI-guided radiotherapy in 30 fractions over 6 weeks with concurrent temozolomide. In a pilot project, we identified early changes in tumor volume typically starting during week 3 or 4 of treatment. We hypothesize that tumor volume kinetics during treatment are associated with treatment outcome and allow for adapting radiotherapy treatment. To reduce time burden of tumor segmentation, our aim is to develop a deep learning (DL) solution for automatic volume delineation on daily scans from a hybrid MRI-RT platform with the intent to allow for monitoring of tumor changes.Materials and Methods
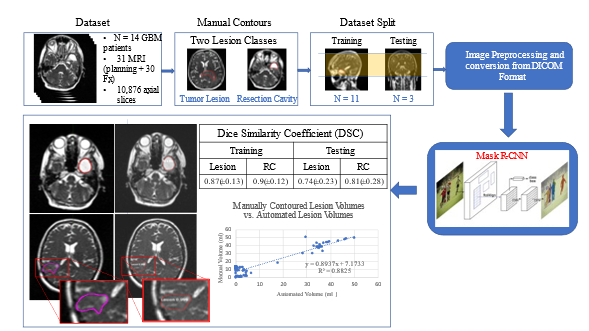
The MRIdian system (ViewRay, Mountain View, USA) MRI-RT system is equipped with a 0.35 T MRI (Siemens Avanto, version syngo MR B17, IDEA version VB19, Siemens Medical Solutions, Erlangen, Germany). The system includes a balanced steady-state free precession (bSSFP) pulse sequence that results in a mixed composition weighted by T1 and T2. Images were acquired with these parameters: TE/TR = 1.92 ms/3.84 ms, flip angle = 60º, acquisition matrix = 266 x 288 x 266, voxel size 1.5 mm x 1.5 mm x 1.5 mm (3D-acquisition), bandwidth 532 Hz/Px, gradient mode: fast, and acquisition time = 2 minutes and 8 seconds. For the DL study, 14 patients with biopsy, subtotal resection, or gross total resection of GBM were used as combined training and testing cohort. Total MRI data for each patient consists of one planning scan and 30 daily bSSFP scans for each fraction of RT totaling 31 imaging studies per patient. Each study was manually contoured for tumor lesion (TL) with/without surrounding edema and resection cavity (RC). For the deep learning architecture, we selected Mask-RCNN5. Mask-RCNN is pre-trained on a large dataset of images (Imagenet6) which allows for effective transfer learning on significantly smaller datasets. It is also generates masks for each segmentation created in-line with classification. 11 patients were used as training set (n = 8,505 images) with the remaining 3 patients used as test dataset. The resultant network was used to create DL-generated masks, converted into 3D volumes and compared to ground-truth manual contours via Dice Similarity Coefficient (DSC). The correlation between DL and manually contoured volumes was examined with Pearson Correlation Coefficient (r).Results
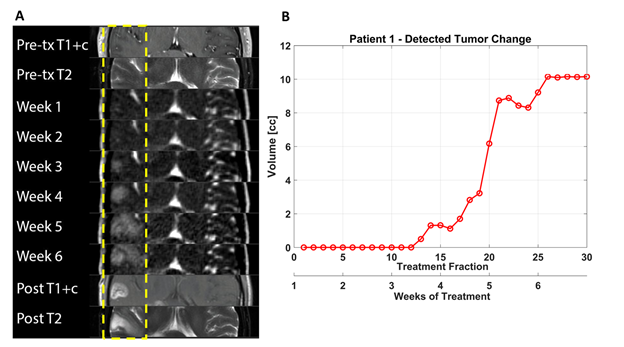
In Figure 1 tumor volume kinetics of a GBM patient are presented. The multifocal tumor in the right temporal lobe after biopsy of a discrete lesion about 1 cm inferior to the axial slice is shown in Figure 1A. A tiny (~2 mm) area of equivocal T2 change was observed as shown, and this area was included in the 60 Gy treatment volume. Little change was observed in this area until about fraction 18 (late week 4), at which time rapid growth was seen until fraction 26 (week 6) when the size plateaued. The observed findings during treatment were consistent with one-month post treatment diagnostic imaging (Figure 1A, bottom two panels).
The DL workflow and summary is presented in Figure 2. The DSC results for TL and RC on the training and test datasets (mean±standard deviation) were 0.87±0.128 and 0.9±0.122; 0.74±0.233 and 0.8±0.277, respectively. Mask-RCNN achieved a DSC greater than 0.8 in 2 out of the 3 test patients. In the remaining case, the network achieved less than 0.8, indicating that while successful in classifying on TL and RC, our network was not yet well-generalized with current training data available. The DL volumes correlated significantly (r = 0.9) with the manual volumes across the entire test dataset as shown in Figure 2.
Discussion
Common implementations of DL networks strive to use the largest amount of available data possible to obtain well-generalized models that can most accurately classify the subjects presented to them. Utilization of a network that is pre-trained on millions of images via the power of transfer learning is feasible to achieve reasonable results on even a small number of examples. Another reason for the overall good DL performance is that the MR data were acquired on the same instrument with the same sequences.Conclusion
Segmentation of brain lesions is both complex and time consuming, with significant impacts on research and clinical throughput as it must be performed for every scan on every patient. We have shown the ability of Mask R-CNN to produce automated segmentations for brain tumors with sparse training data. As more patients receive MRI-RT treatment, the network will improve both in accuracy and generalizability. DL in RT research improves feasibility of visualizing tumor kinetic trends and performing feature-based analysis in real time.Acknowledgements
Research reported in this work was supported by the National Cancer Institute of the National Institutes of Health under Award Number P30CA240139, K12CA226330 and U01CA239141. The content is solely the responsibility of the authors and does not necessarily represent the official views of the National Institutes of Health.References
1. Brandes AA, Franceschi E, Tosoni A, et al. MGMT Promoter Methylation Status Can Predict the Incidence and Outcome of Pseudoprogression After Concomitant Radiochemotherapy in Newly Diagnosed Glioblastoma Patients. Journal of Clinical Oncology. 2008;26(13):2192-2197.
2. Juratli TA, Engellandt K, Lautenschlaeger T, et al. Is there pseudoprogression in secondary glioblastomas? Int J Radiat Oncol Biol Phys. 2013;87(5):1094-1099.
3. Mehta S, Gajjar SR, Padgett KR, et al. Daily Tracking of Glioblastoma Resection Cavity, Cerebral Edema, and Tumor Volume with MRI-Guided Radiation Therapy. Cureus. 2018;10(3):e2346.
4. Mutic S, Dempsey JF. The ViewRay system: magnetic resonance-guided and controlled radiotherapy. Semin Radiat Oncol. 2014;24(3):196-199.
5. He K, Gkioxari G, Dollar P, Girshick R. Mask R-CNN. IEEE Trans Pattern Anal Mach Intell. 2020;42(2):386-397.
6. Deng, J. et al., 2009. Imagenet: A large-scale hierarchical image database. In 2009 IEEE conference on computer vision and pattern recognition. pp. 248–255.
Figures