2743
Tissue-level probabilistic mapping of treatment-induced effects in recurrent glioblastoma1Radiology and Biomedical Imaging, UCSF, San Francisco, CA, United States, 2Center for Intelligent Imaging, UCSF, San Francisco, CA, United States, 3Graduate Group in Bioengineering, UCSF - UC Berkeley, San Francisco, CA, United States, 4Brain Tumor Research Center, UCSF, San Fransisco, CA, United States, 5Neurological Surgery, UCSF, San Francisco, CA, United States
Synopsis
Treatment-induced effects can mimic tumor recurrence and pose a challenge to accurately assessing treatment response. We aim to provide a machine learning framework and identify important imaging features for discriminating treatment-induced injury from recurrent glioblastoma at biopsy level resolution. Our best model performs with a mean AUC of .77+/-0.11 across 4 fold cross-validation of 108 tissue samples. rCBV, choline-to-NAA index (CNI), and normalized lipid levels were the top three most import features in distinguishing treatment effects from recurrent tumor.
Introduction
Discrimination of treatment-induced injury from true recurrent tumor in patients who received prior radiation therapy and temozolomide for a high-grade glioma is an ongoing challenge [1,2] and critical task in determining subsequent treatment. Despite the success of previous studies in applying machine learning (ML) algorithms to solve this problem on a patient level basis [3,4,5], the majority of these tumors are heterogeneous, containing a mixture of true recurrence and treatment-induced injury within the same lesion. This prevents an accurate spatial characterization of recurrent tumor and treatment effects, limiting its utility in the clinic. In order to address these issues, we aim to develop a tool for regional probabilistic mapping of treatment effect and tumor recurrence using biopsied tissue samples with known coordinates on imaging as our ground truth training data. Formulated as a spatial classification task, we compare different individual and ensembled ML classifiers to assess their predictive power and determine the most influential metrics for predicting treatment effect on a tissue level.Methods
Data acquisition: Pre-surgical multi-parametric MR images from anatomical, diffusion-weighted, perfusion-weighted, and MR spectroscopic imaging (MRSI) from 55 patients with high grade glioma were collected on a 3T scanner (GE Healthcare Technologies) at the time of suspected recurrence. Pre- and post- gadolinium enhanced 3D T1-weighted images, T2 FSE, T2 FLAIR, diffusion (6 or 24 directions, b=1000s/mm2), Dynamic Susceptibility Contrast perfusion (TR/TE/flip-angle=1250-1500/35-54 ms/30°-35°), and lactate-edited 3D PRESS 1H-MRSI were acquired. During surgery, 108 tissue samples were removed from these patients and their spatial coordinates on imaging were recorded before evaluated by a board-certified pathologist. Of these samples, 87 were confirmed to be recurrent glioma, while 21 exhibited treatment-induced effects.Image Processing: Following alignment to the post-contrast T1-weighted image, spherical 5mm ROIs were extracted from each image surrounding the biopsy location. Anatomical (T1c, T1, T2, and T2 FLAIR) and diffusion images (FA, ADC, radial diffusivity, and primary eigenvalues) were normalized to the mode of normal-appearing white matter (NAWM) and mean values of each parameter were extracted from tissue sample ROIs. From perfusion, rCBV values were calculated from a weighted average of the dynamic curves proportional to their overlap with the ROI [6]. To generate a single spectrum centered at the location of each tissue sample, 3D spectral arrays were first shifted in k-space to reconstruct a spectral voxel on the center coordinates of each tissue sample location [7]. Peak-heights of lactate, lipid, choline, creatine, and NAA values were normalized to the median of NAWM and the choline-to-NAA index (CNI) was calculated. 15 multi-parametric anatomical, physiological, and metabolic imaging features were extracted in total (Figure 1) and used as input to our ML models.
Modeling: The data was split into four folds, stratifying by patient, to prevent data leakage of samples from a single patient being in both the training and validation cohorts. Each fold was additionally stratified by outcome to ensure even proportions of samples reflecting treatment effect across all folds. The training data in each fold was resampled using ADASYN with five nearest neighbors (Figure 2). A grid search was performed for each of the models to determine the best hyper-parameter configuration optimizing for ROC AUC. Individual gaussian process, support vector, and random forest classifiers and ensembled approaches employing either soft voting or stacking with a final layer of logistic regression were compared. The most frequent top three imaging features of the best performing model were computed by permutation feature importance with 100 repeats at each fold. Decision boundaries of models fit on pairs of these features were compared to examine model confidence and separability based on further stratification by whether the tissue sample came from the contrast-enhancing or nonenhancing lesion, which have previously been reported to contain different imaging signatures [7].
Results and Discussion
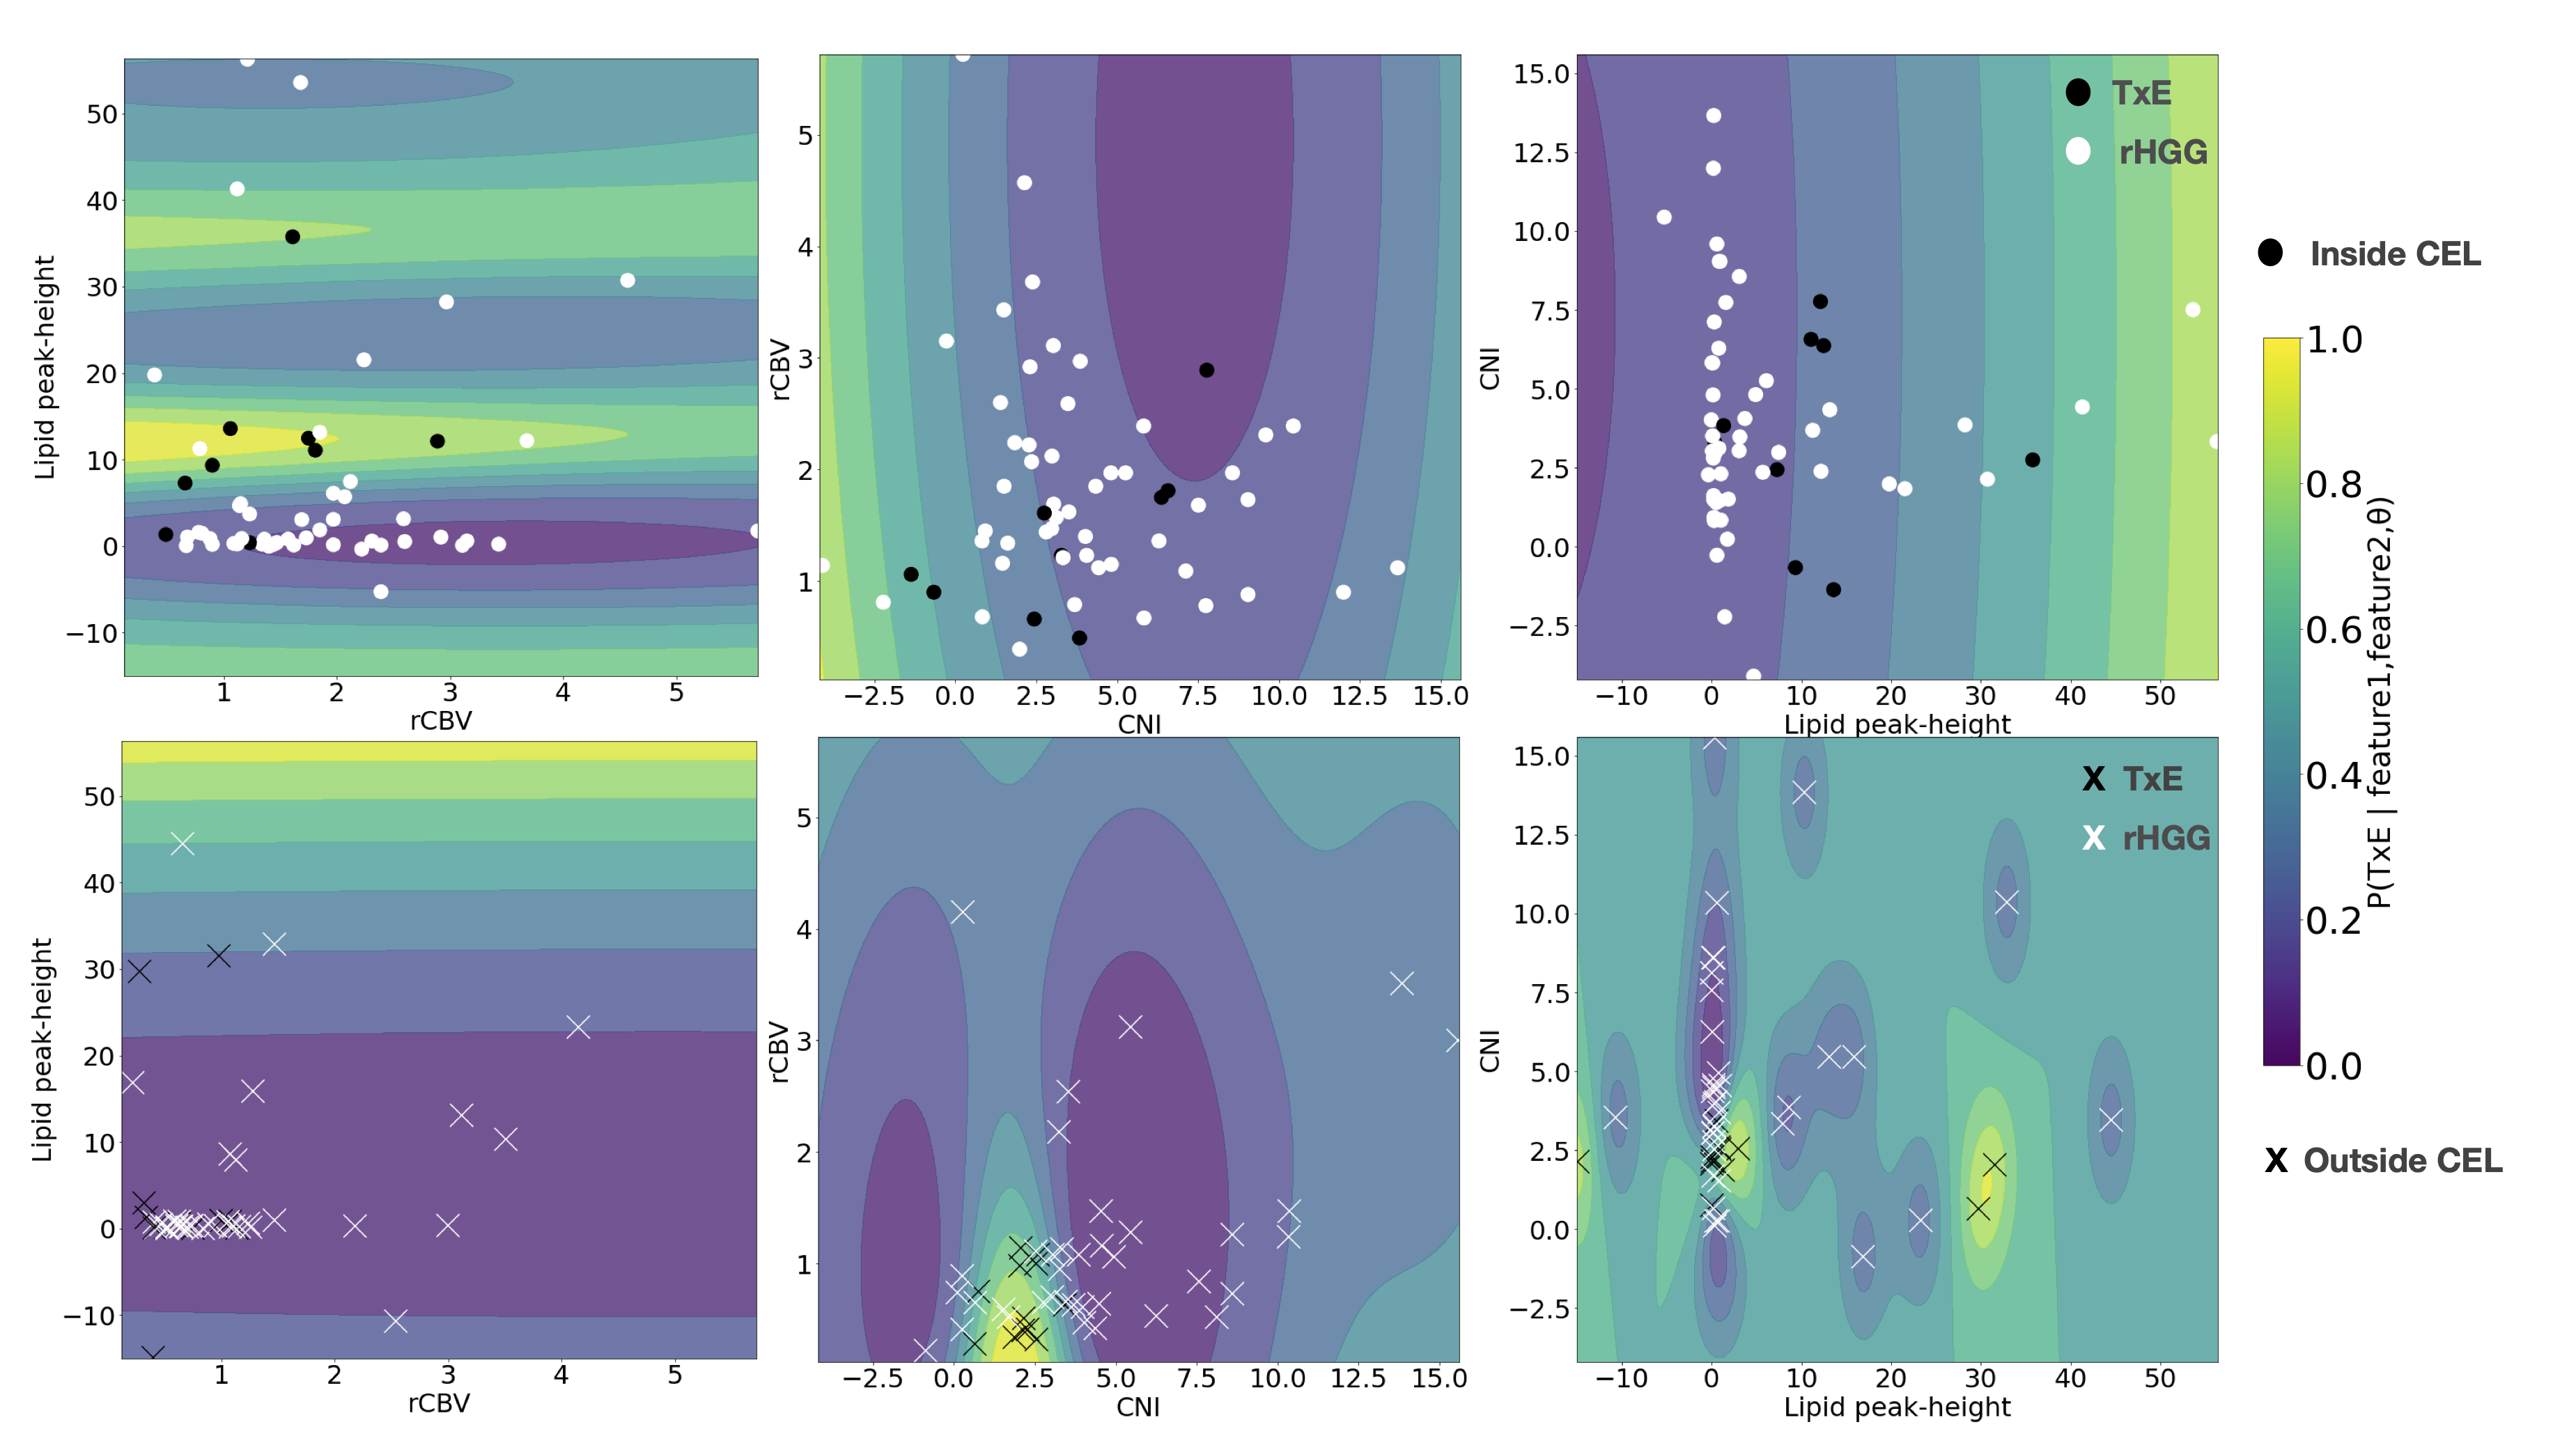
Figure 3 shows different imaging features for a representative treatment effect and recurrent tumor tissue sample. The ROC curves and AUC values for each fold and mean across folds for each model is shown in Figure 4. The best performing model was the gaussian process classifier with a radial basis function kernel that achieved a mean AUC of .77+/-.11. The variance of all of our predictors remained relatively high due to the low performance of a single fold (average AUC excluding this fold was .83). We expect that adding our remaining samples with all imaging parameters once we obtain pathological confirmation will help improve this problem. The top three most important features were determined to be rCBV, lipid, and CNI, which are consistent with previous findings [7,8,9]. Although increased lipid concentration usually indicates necrosis, it can be indicative of proliferation [10] in areas of elevated choline or CNI. Figure 5 shows the decision boundaries of our model stratified by whether or not the tissue sample was contrast enhancing. It appears that the model finds a better fit for the samples outside of the CEL than within, where a single separable cluster along rCBV and CNI was observed. Future analysis will address this by incorporating more samples into training and additionally utilizing data driven deep learning approaches using the entire ROI surrounding the biopsy location as input instead of single values.Acknowledgements
NIH-NCI grant P01CA118816References
[1] Abbasi AW et. al. “Incidence of Tumour Progression and Pseudoprogression in High-Grade Gliomas: A Systematic Review and Meta-Analysis.” Clinical Neuroradiology, U.S. National Library of Medicine, Sept. 2018.
[2] EM, Delgado-López PD, Riñones-Mena E, Corrales-García. “Treatment-Related Changes in Glioblastoma: A Review on the Controversies in Response Assessment Criteria and the Concepts of True Progression, Pseudoprogression, Pseudoresponse and Radionecrosis.” Clinical & Translational Oncology : Official Publication of the Federation of Spanish Oncology Societies and of the National Cancer Institute of Mexico, U.S. National Library of Medicine, Aug. 2018.
[3] Lee, Joonsang, et al. “Discriminating Pseudoprogression and True Progression in Diffuse Infiltrating Glioma Using Multi-Parametric MRI Data Through Deep Learning.” Nature News, Nature Publishing Group, 23 Nov. 2020.
[4] Akbari H;Rathore S;Bakas S;Nasrallah MP;Shukla G;Mamourian E;Rozycki M;Bagley SJ;Rudie JD;Flanders AE;Dicker AP;Desai AS;O'Rourke DM;Brem S;Lustig R;Mohan S;Wolf RL;Bilello M;Martinez-Lage M;Davatzikos C; “Histopathology-Validated Machine Learning Radiographic Biomarker for Noninvasive Discrimination between True Progression and Pseudo-Progression in Glioblastoma.” Cancer, U.S. National Library of Medicine, June 2020.
[5] Gao, Yang, et al. “Deep Learning Methodology for Differentiating Glioma Recurrence from Radiation Necrosis Using Multimodal Magnetic Resonance Imaging: Algorithm Development and Validation.” JMIR Medical Informatics, JMIR Publications, 17 Nov. 2020.
[6] Lupo JM, Wen Q, Chang SM, et al. Weighted-average model curve preprocessing strategy for quantification of DSC perfusion imaging metrics from image-guided tissue samples in patients with brain tumors. In: Proc. Intl. Soc. Mag. Reson. Med. 23 . ISMRM; 2015:4377.
[7] Cluceru J, Nelson SJ, Wen Q, Phillips JJ, Shai A, Molinaro AM, Alcaide-Leon P, Olson MP, Nair D, LaFontaine M, Chunduru P, Villanueva-Meyer JE, Cha S, Chang SM, Berger MS, Lupo JM. “Recurrent Tumor and Treatment-Induced Effects Have Different MR Signatures in Contrast Enhancing and Non-Enhancing Lesions of High-Grade Gliomas.” Neuro-Oncology, U.S. National Library of Medicine, 2020.
[8] Hu LS, Baxter LC, Smith KA, Feuerstein BG, Karis JP, Eschbacher JM, Coons SW, Nakaji P, Yeh RF, Debbins J, Heiserman JE “Relative Cerebral Blood Volume Values to Differentiate High-Grade Glioma Recurrence from Posttreatment Radiation Effect: Direct Correlation between Image-Guided Tissue Histopathology and Localized Dynamic Susceptibility-Weighted Contrast-Enhanced Perfusion MR Imaging Measurements.” AJNR. American Journal of Neuroradiology, U.S. National Library of Medicine, Dec. 2008.
[9] Barajas, Ramon F., et al. “Differentiation of Recurrent Glioblastoma Multiforme from Radiation Necrosis after External Beam Radiation Therapy with Dynamic Susceptibility-Weighted Contrast-Enhanced Perfusion Mr Imaging.” Radiology, Nov. 2009.
[10] Taïb, Bouchra, et al. “Lipid Accumulation and Oxidation in Glioblastoma Multiforme.” Nature News, Nature Publishing Group, 20 Dec. 2019.
Figures