2741
Advanced multimodal MRI detects premanifest and early-stage alterations in SCA1 and SCA3 with high sensitivity1Center for Magnetic Resonance Research, University of Minnesota, Minneapolis, MN, United States, 2Sorbonne University, Paris, France, 3Johns Hopkins University, Baltimore, MD, United States, 4University of Florida, Gainesville, FL, United States, 5German Center for Neurodegenerative Diseases (DZNE), Bonn, Germany, 6University of Bordeaux, Bordeaux, France, 7Universidad Politécnica de Valencia, Valencia, Spain, 8Massachusetts General Hospital, Charlestown, MA, United States, 9University of Minnesota, Minneapolis, MN, United States, 10University of Michigan, Ann Arbor, MI, United States, 11The Houston Methodist Research Institute, Houston, TX, United States
Synopsis
Spinocerebellar ataxias are rare inherited neurodegenerative diseases that cause degeneration in the cerebellum and brainstem. The multi-site READISCA clinical trial readiness study aims to validate MR biomarkers at early stages of SCA1 and SCA3. SCA gene carriers (including individuals at pre-ataxic and ataxic stage) and matched controls (total N=107) were scanned at 3T to obtain structural and diffusion MRI and MR spectroscopy. Medulla, pons, and cerebellar peduncles were the earliest sites of involvement in both SCAs. Neurochemical and microstructural abnormalities were detected with very high sensitivity (AUC>0.9 in ROC analyses) prior to ataxia onset.
Introduction
Spinocerebellar ataxias (SCAs) are autosomal dominant movement disorders characterized by neurodegeneration in the cerebellum and brainstem. SCA1 is the fastest progressing 1, 2 and SCA3 the most common SCA 3 worldwide. Disease-modifying therapies for SCAs are in the pipeline 4 and animal studies show disease reversibility when therapies are administered in early stages 5. Hence, imaging biomarkers that can detect cerebral and cerebellar abnormalities in the earliest stages of neurodegeneration are needed to help develop therapeutics. Neuroimaging studies have consistently detected morphometric, microstructural, and neurochemical abnormalities in manifest SCA patients 6-12. In addition, preliminary morphometry and MRS studies reported early brain alterations before clinical symptom onset in small samples 9, 10, 13-18, warranting further studies to validate biomarkers in premanifest subjects with larger sample sizes in the clinical trial setting. The READISCA study (Clinical trial readiness for SCA1 and SCA3, https://readisca.org/) enrolls premanifest gene carriers who have no ataxia (premanifest (PM), Scale for the Assessment and Rating of Ataxia [SARA] <3) and early-stage (manifest (M), SARA 3-9) patients and aims to validate biomarkers for early disease stages. In this cross-sectional study, we hypothesized that structural (sMRI), diffusion imaging (dMRI) and MR spectroscopy (MRS) will provide sensitive and specific non-invasive biomarkers for SCA1 & SCA3 for both premanifest and early-stage subjects and their utility in subject selection for future clinical trials.Methods
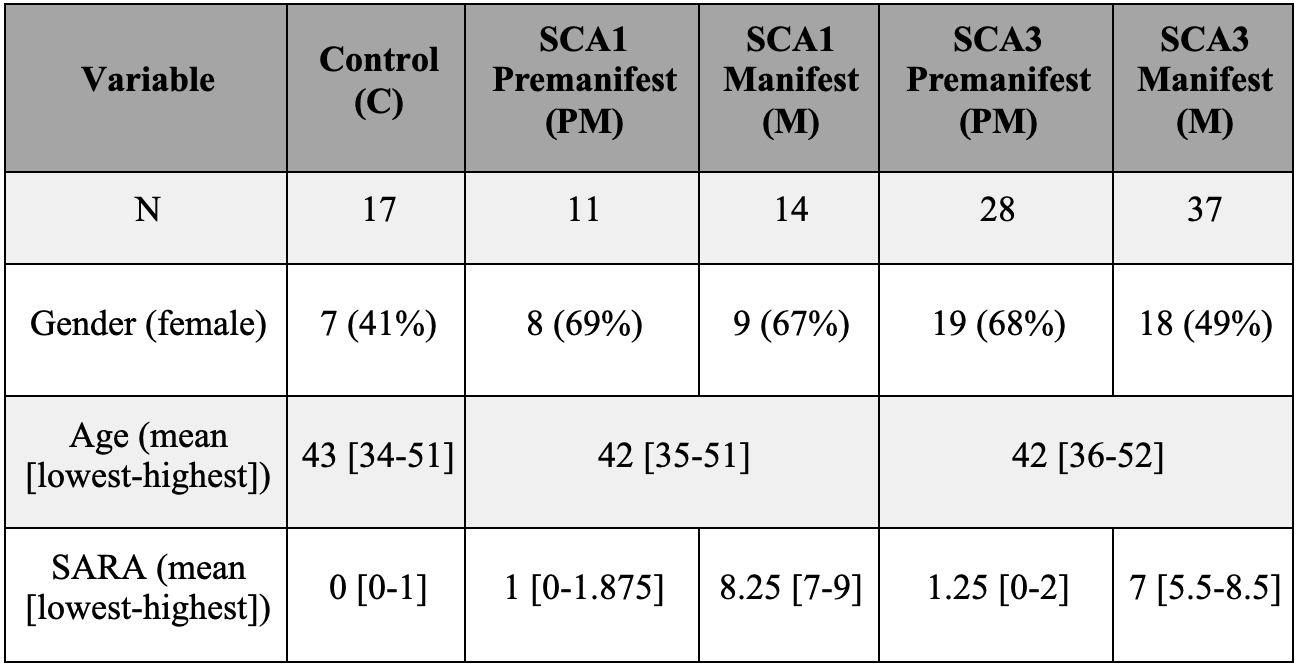
READISCA enrolled 107 study participants (Figure 1) for MRI/MRS at 4 US and 2 European sites. All participants underwent MR measurements at 3T (Siemens). sMRI and dMRI were acquired based on the Human Connectome Protocol (https://www.humanconnectome.org/study-hcp-lifespan-pilot/phase1b-pilot-parameters) and MRS using semi-LASER protocol 19. MR data were analyzed blinded to diagnosis. sMRI were QCed manually 20 and sMRI and dMRI were post-processed using the HCP’s minimal preprocessing tool 21. sMRI and dMRI data underwent gradient-distortion and bias field correction. dMRI was also corrected for susceptibility and eddy-current distortions 22. Single-shot sLASER spectra were corrected for frequency, phase and eddy-current errors using MRspa 23 before averaging. Whole-brain and cerebellar volumetry were obtained using FreeSurfer (version 6.0) 24, 25 and CERES pipelines 26. Fractional anisotropy (FA), axial, radial and mean diffusivity (MD) metrics were calculated using the FSL DTIFIT (FSL version 6.0) from the whole brain white-matter (WM) regions-of-interest (ROI) from the pre-processed diffusion images for each subject in their native space as previously described 10. Spectra were quantified using a simulated basis set in LCModel (6.3.0G). Control, PM and M groups were compared using non-parametrical Kruskal-Wallis test with Dunn adjustment for multiple comparisons. p-values were Holm adjusted for multiple comparisons per MR modality. The MR metrics that showed statistical significance in the group comparisons then underwent pairwise comparison between the PM, M and control groups in SCA1 and SCA3 separately using two-tailed t-tests (a = 0.05) with the R software (version 3.6.2).Results
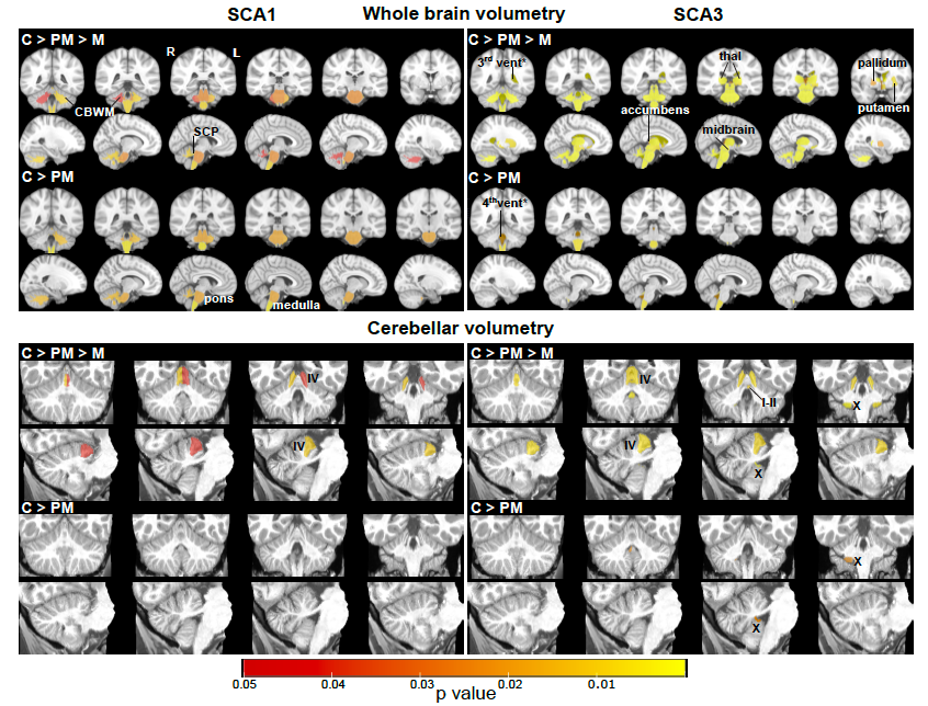
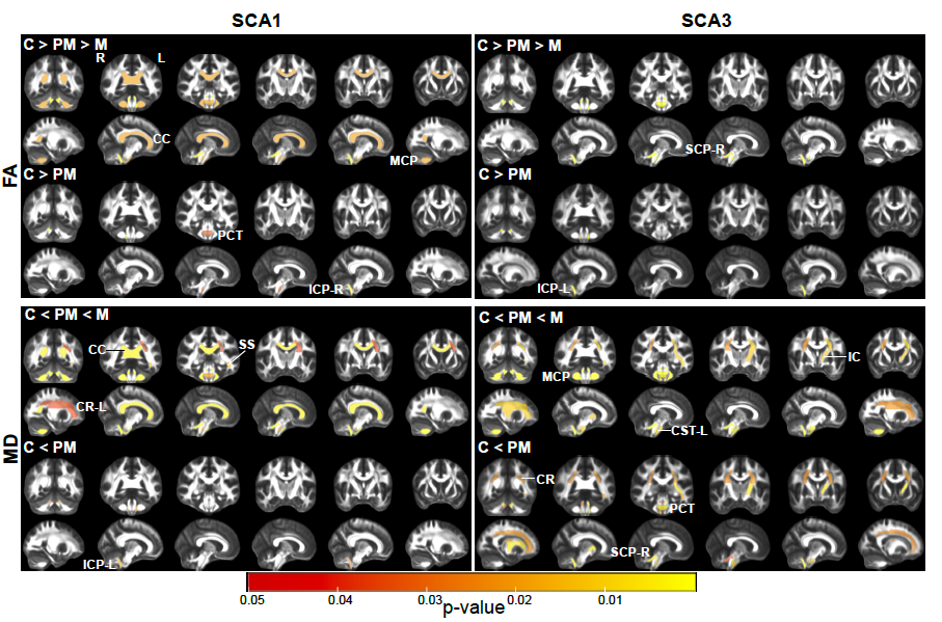
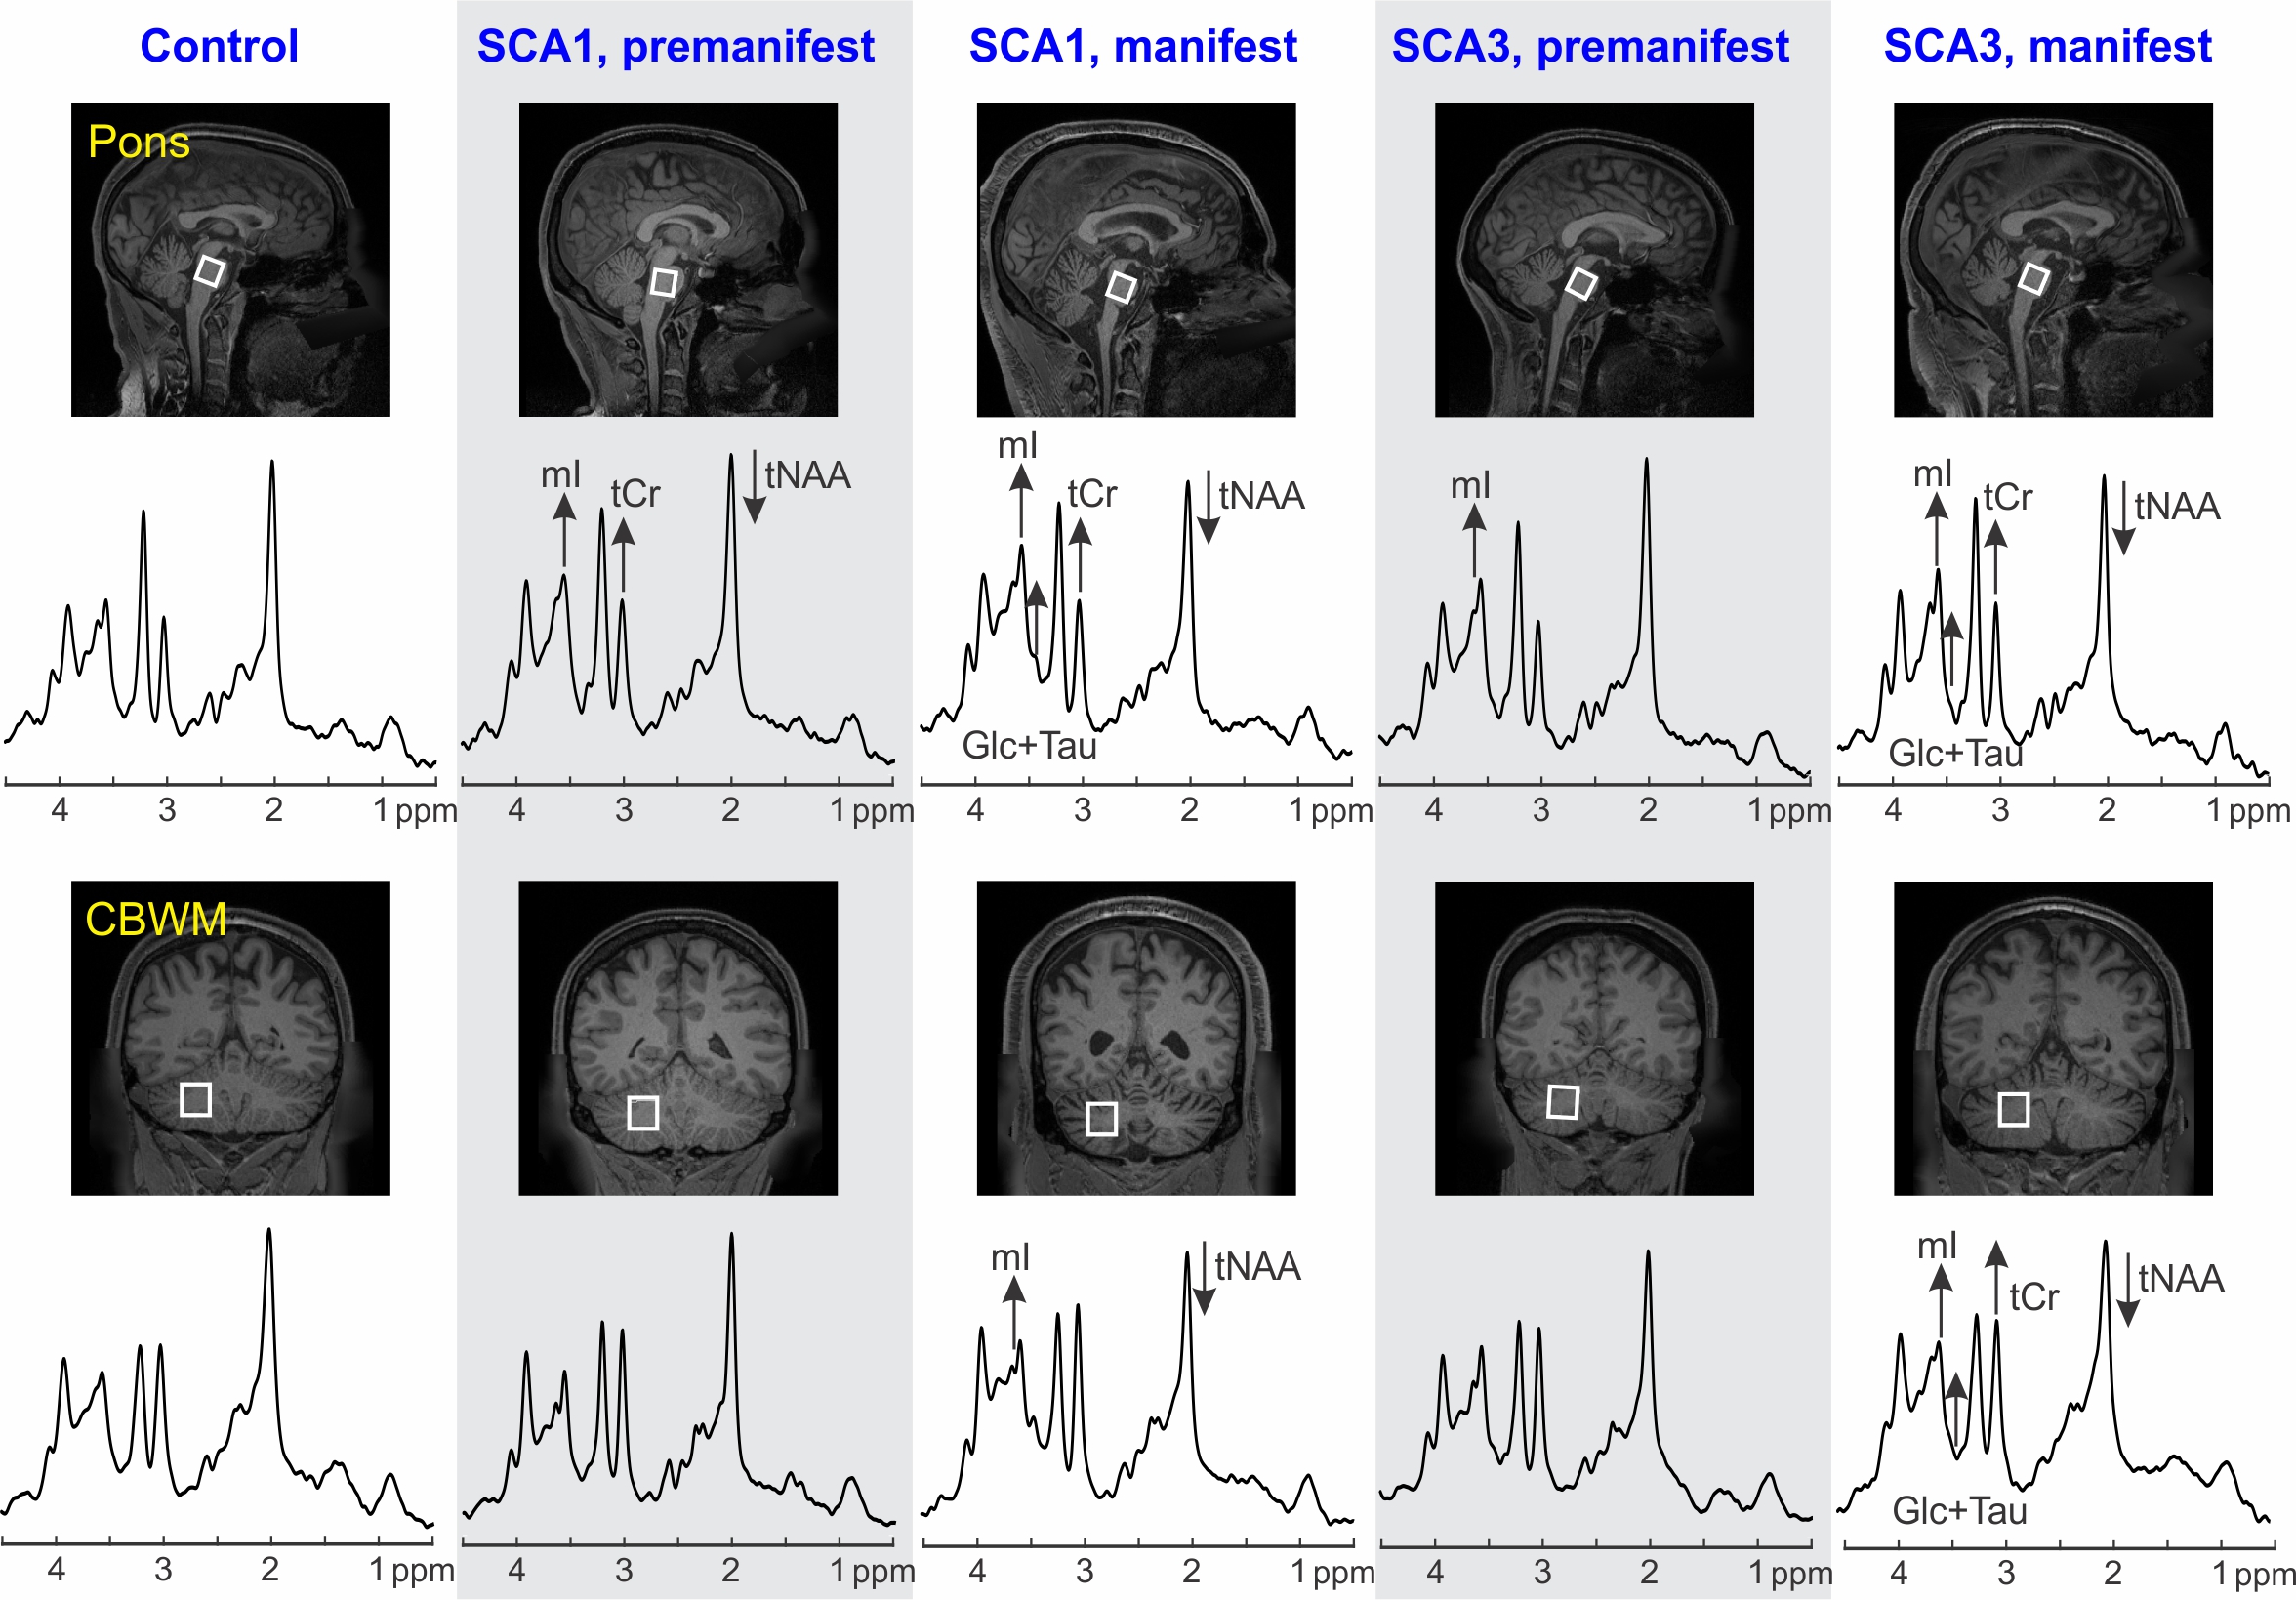
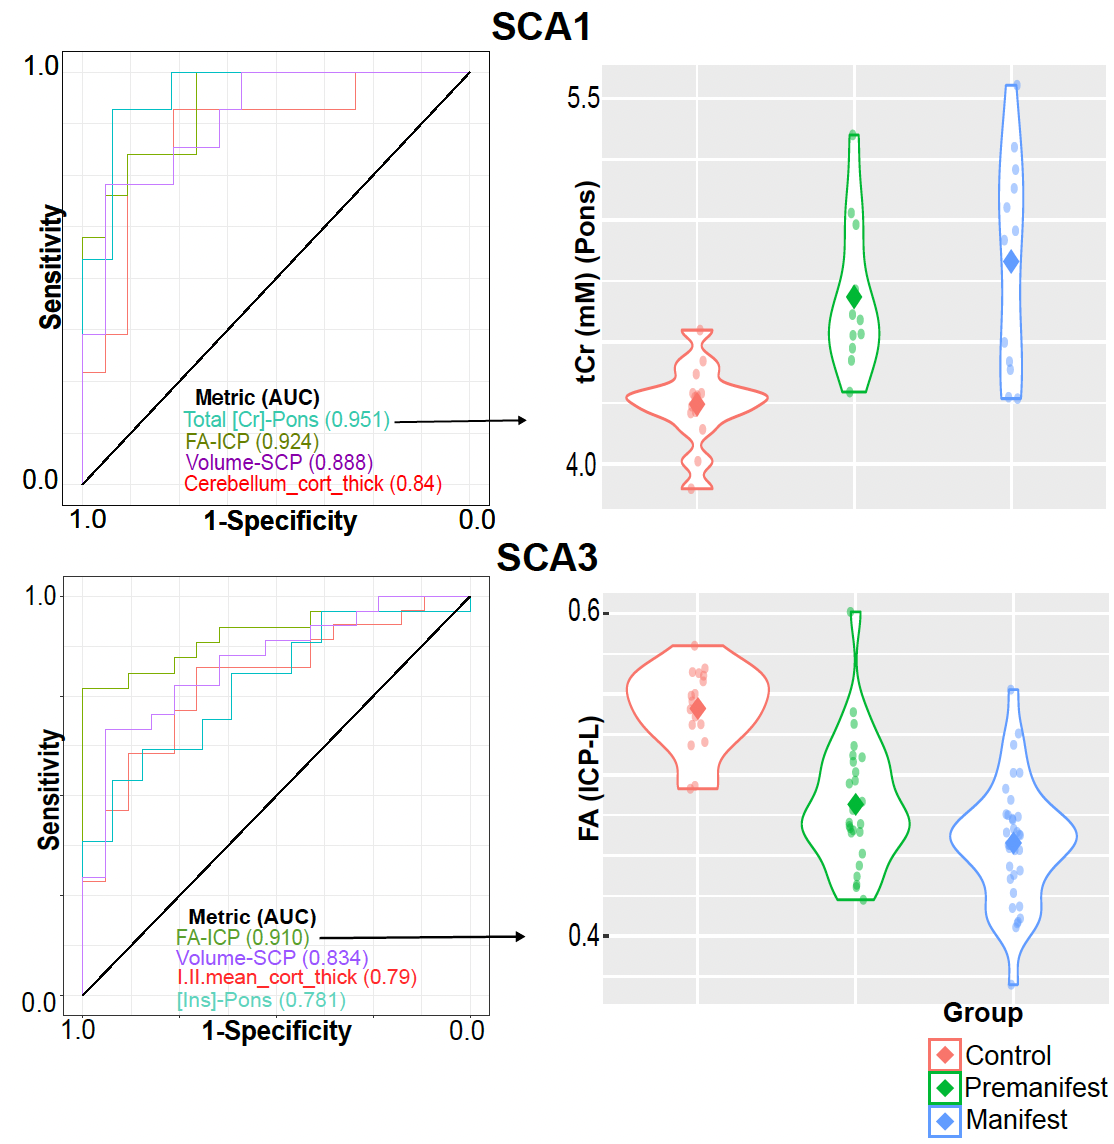
Atrophy in brainstem (pons, medulla), midbrain and cerebellar structures (superior cerebellar peduncle (SCP) and cerebellar white matter(CBWM)), IVth lobule of cerebellum (Figure 2), lower FA and higher diffusivity in the cerebellar peduncles, pons, corona radiata and striatum (Figure 3), lower total N-acetylaspartate (tNAA, neuronal marker), higher myo-inositol (mI, glial marker) and total creatine (tCr) (Figure 4) distinguished manifest SCA1 and SCA3 from controls. Notably, medulla and SCP were atrophied (Figure 2), and inferior cerebellar peduncles (ICP) and pontine crossing tracts showed microstructural abnormalities (Figure 3) at premanifest stage in both SCA1 and SCA3. Consistently, pontine tNAA, mI, and tCr in SCA1 and pontine mI in SCA3 were significantly different from controls at premanifest stage SCAs (Figure 4). Medulla, pons, and cerebellar peduncles are the earliest sites of involvement in both SCAs. Receiver operating characteristics analyses for top metrics from each modality (Figure 5) showed that neurochemical (tCr) and microstructural (FA of ICP) markers have the highest sensitivity (AUC>0.9) to detect abnormalities at the premanifest stage of SCA1 and SCA3, respectively.Discussion
We report substantial overlap in regional atrophy in SCA1 and SCA3 in the brainstem, cerebellar WM and peduncles. Cerebral atrophy (thalamus, pallidum) was only detectable in SCA3, which may have been due to the larger sample size for SCA3 (Figure 1) and conservative type 1 error correction. Both disease groups displayed widespread microstructural differences from controls, although with striking regional differences (corticospinal tract, internal and external capsule abnormalities only in SCA3 and corpus callosum only in SCA1). Neurochemical abnormalities were more prominent in the pons than CBWM in both SCAs. Premanifest volumetric and neurochemical abnormalities in the pons were more prominent in SCA1 than SCA3, despite smaller N, likely predictive of faster disease progression in SCA1 following ataxia onset. On the other hand, several cerebral WM microstructural abnormalities, particularly in diffusivities, were detectable at premanifest stage in SCA3. This pattern of MR abnormalities indicates pathology that moves from medulla to pons to cerebellum (via cerebellar peduncles) and later to cerebrum. Critically, neurochemical, and microstructural metrics detected cerebellar and brainstem abnormalities at premanifest stage with higher sensitivity than morphometric measures. Non-invasive access to such cellular and biochemical changes before neuronal loss is expected to facilitate future clinical trial enrollment of participants at the earliest disease stages, thereby increasing the likelihood of disease reversal by potential therapeutics.Acknowledgements
READISCA investigators, NIH U01 NS104326, NIBIB P41 EB027061, P30 NS076408, 1S10OD017974-01.References
1. Ashizawa, T., et al., Clinical characteristics of patients with spinocerebellar ataxias 1, 2, 3 and 6 in the US; a prospective observational study. Orphanet J Rare Dis, 2013. 8: p. 177.
2. Jacobi, H., et al., The natural history of spinocerebellar ataxia type 1, 2, 3, and 6: a 2-year follow-up study. Neurology, 2011. 77(11): p. 1035-41.
3. Bird, T.D., Hereditary Ataxia Overview, in GeneReviews((R)), M.P. Adam, et al., Editors. 1993: Seattle (WA).
4. Ashizawa, T., G. Oz, and H.L. Paulson, Spinocerebellar ataxias: prospects and challenges for therapy development. Nat Rev Neurol, 2018. 14(10): p. 590-605.
5. Rubinsztein, D.C. and H.T. Orr, Diminishing return for mechanistic therapeutics with neurodegenerative disease duration?: There may be a point in the course of a neurodegenerative condition where therapeutics targeting disease-causing mechanisms are futile. Bioessays, 2016. 38(10): p. 977-80.
6. Schulz, J.B., et al., Visualization, quantification and correlation of brain atrophy with clinical symptoms in spinocerebellar ataxia types 1, 3 and 6. Neuroimage, 2010. 49(1): p. 158-68.
7. Reetz, K., et al., Genotype-specific patterns of atrophy progression are more sensitive than clinical decline in SCA1, SCA3 and SCA6. Brain, 2013. 136(Pt 3): p. 905-17.
8. Adanyeguh, I.M., et al., Autosomal dominant cerebellar ataxias: Imaging biomarkers with high effect sizes. Neuroimage Clin, 2018. 19: p. 858-867.
9. Deelchand, D.K., et al., Sensitivity of Volumetric Magnetic Resonance Imaging and Magnetic Resonance Spectroscopy to Progression of Spinocerebellar Ataxia Type 1. Mov Disord Clin Pract, 2019. 6(7): p. 549-558.
10. Park, Y.W., et al., Assessment of Cerebral and Cerebellar White Matter Microstructure in Spinocerebellar Ataxias 1, 2, 3, and 6 Using Diffusion MRI. Front Neurol, 2020. 11: p. 411.
11. Oz, G., et al., Neurochemical alterations in spinocerebellar ataxia type 1 and their correlations with clinical status. Mov Disord, 2010. 25(9): p. 1253-1261.
12. Oz, G., et al., Distinct neurochemical profiles of spinocerebellar ataxias 1, 2, 6, and cerebellar multiple system atrophy. Cerebellum, 2011. 10(2): p. 208-17.
13. Rezende, T.J.R., et al., Structural signature of SCA3: From presymptomatic to late disease stages. Ann Neurol, 2018. 84(3): p. 401-408.
14. Nigri, A., et al., Spinocerebellar Ataxia Type 1: One-Year Longitudinal Study to Identify Clinical and MRI Measures of Disease Progression in Patients and Presymptomatic Carriers. Cerebellum, 2021.
15. Faber, J., et al., Regional Brain and Spinal Cord Volume Loss in Spinocerebellar Ataxia Type 3. Mov Disord, 2021. 36(10): p. 2273-2281.
16. Joers, J.M., et al., Neurochemical abnormalities in premanifest and early spinocerebellar ataxias. Ann Neurol, 2018. 83(4): p. 816-829.
17. Oz, G., et al., Noninvasive detection of presymptomatic and progressive neurodegeneration in a mouse model of spinocerebellar ataxia type 1. J Neurosci, 2010. 30(10): p. 3831-8.
18. Emir, U.E., et al., Non-invasive detection of neurochemical changes prior to overt pathology in a mouse model of spinocerebellar ataxia type 1. J Neurochem, 2013. 127(5): p. 660-668.
19. Deelchand, D.K., et al., Prospective motion and B0 shim correction for MR spectroscopy in human brain at 7T. Magn Reson Med, 2019. 82(6): p. 1984-1992.
20. Backhausen, L.L., et al., Quality Control of Structural MRI Images Applied Using FreeSurfer-A Hands-On Workflow to Rate Motion Artifacts. Front Neurosci, 2016. 10: p. 558.
21. Glasser, M.F., et al., The minimal preprocessing pipelines for the Human Connectome Project. Neuroimage, 2013. 80: p. 105-24.
22. Bastiani, M., et al., Automated processing pipeline for neonatal diffusion MRI in the developing Human Connectome Project. Neuroimage, 2019. 185: p. 750-763.
23. Deelchand, D.K., MRspa: Magnetic Resonance signal processing and analysis. 2016, https://www.cmrr.umn.edu/downloads/mrspa/: Minneapolis, Minnesota, U.S.A.
24. Fischl, B., et al., Sequence-independent segmentation of magnetic resonance images. Neuroimage, 2004. 23 Suppl 1: p. S69-84.
25. Iglesias, J.E., et al., Bayesian segmentation of brainstem structures in MRI. Neuroimage, 2015. 113: p. 184-95.
26. Romero, J.E., et al., CERES: A new cerebellum lobule segmentation method. Neuroimage, 2017. 147: p. 916-924.
Figures