2740
Evaluating the feasibility of quantifying longitudinal microstructural changes in mild traumatic brain injury (mTBI) with MAP-MRI1Clinical Center, NIH, Bethesda, MD, United States, 2Drexel University College of Medicine, Philadelphia, PA, United States, 3NICHD, NIH, Bethesda, MD, United States, 4Henry M Jackson Foundation for the Advancement of Military Medicine, Bethesda, MD, United States, 5Global Research, General Electric, Niskayuna, NY, United States
Synopsis
Mean Apparent Propagator (MAP) MRI, an expansion of diffusion tensor imaging (DTI), explicitly measures the distribution of net 3D displacements of diffusing water molecules, providing better delineation of crossing white matter fiber tracts. This characteristic may be useful in characterizing unseen microstructural damage in patients with mild traumatic brain injuries whose clinical imaging scans are otherwise normal. An image processing pipeline for using mean apparent propagator (MAP) MRI to analyze diffusion weighted images in mTBI patients has been validated in healthy controls and shown to generate reliable data for patient brain scans.
Introduction
Conventional diffusion tensor imaging (DTI) is a promising method for evaluating traumatic brain injury (TBI), but DTI-derived parameters have been shown to be inconsistently correlated with clinical symptoms/course, especially in mild cases1. DTI uses a Gaussian model to quantify the diffusion of water molecules in the brain, which does not specifically describe restricted diffusion processes due to microstructural features such as cell membranes, organelles, and lipid compartments. Mean Apparent Propagator (MAP) MRI explicitly measures the distribution of net 3D displacements of diffusing water molecules without assuming a Gaussian model2. MAP-MRI provides better delineation of crossing white matter fiber tracts, and has been shown to be feasible in evaluating healthy controls3, Parkinson’s disease4, temporal lobe epilepsy5, brain masses6, and ischemic stroke7. Mild TBI (mTBI) has been difficult to characterize with structural imaging due to variations in injury severity, location, and clinical course8. Group analysis can obfuscate significant changes on an individual level; the clinical and scientific utility of brain imaging lies in longitudinal comparison9. We aim to develop a robust pipeline by which MAP-MRI parameters can be calculated and analyzed in patients with mTBI to describe the evolution of microstructural brain injury compared to their clinical symptoms, setting the stage to evaluate the potential clinical utility of MAP-MRI parameters to characterize healthy and injured states of the brain.Methods
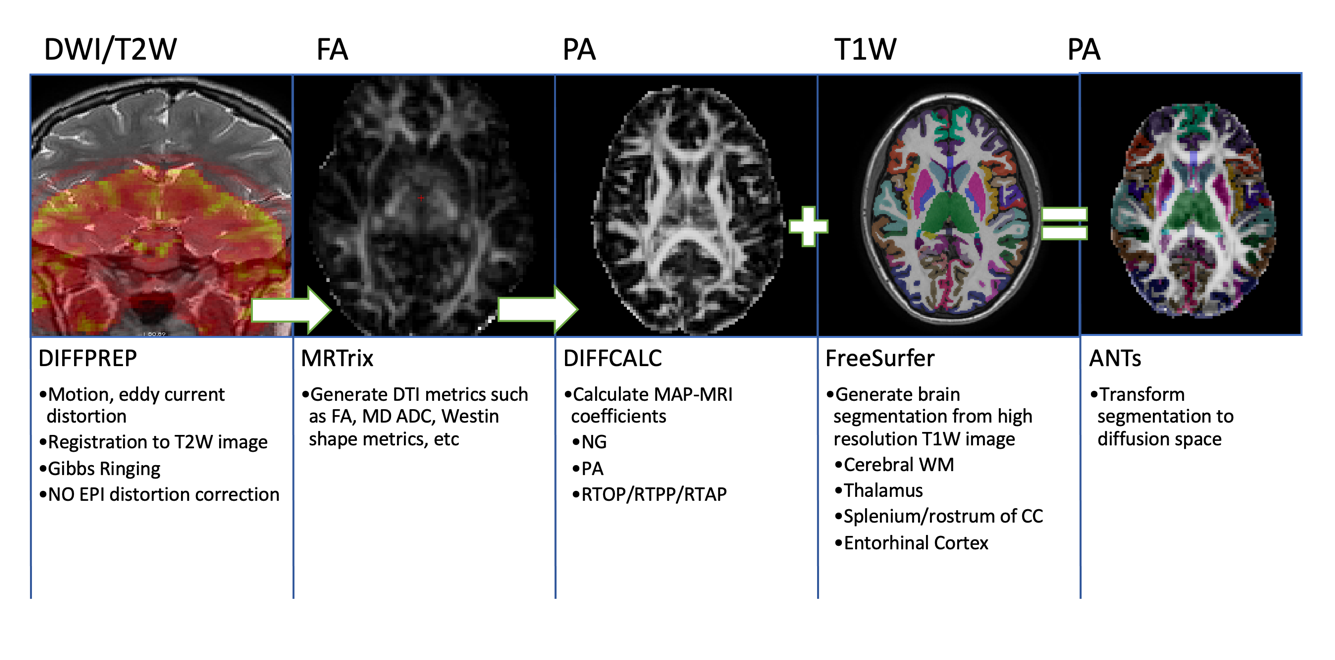
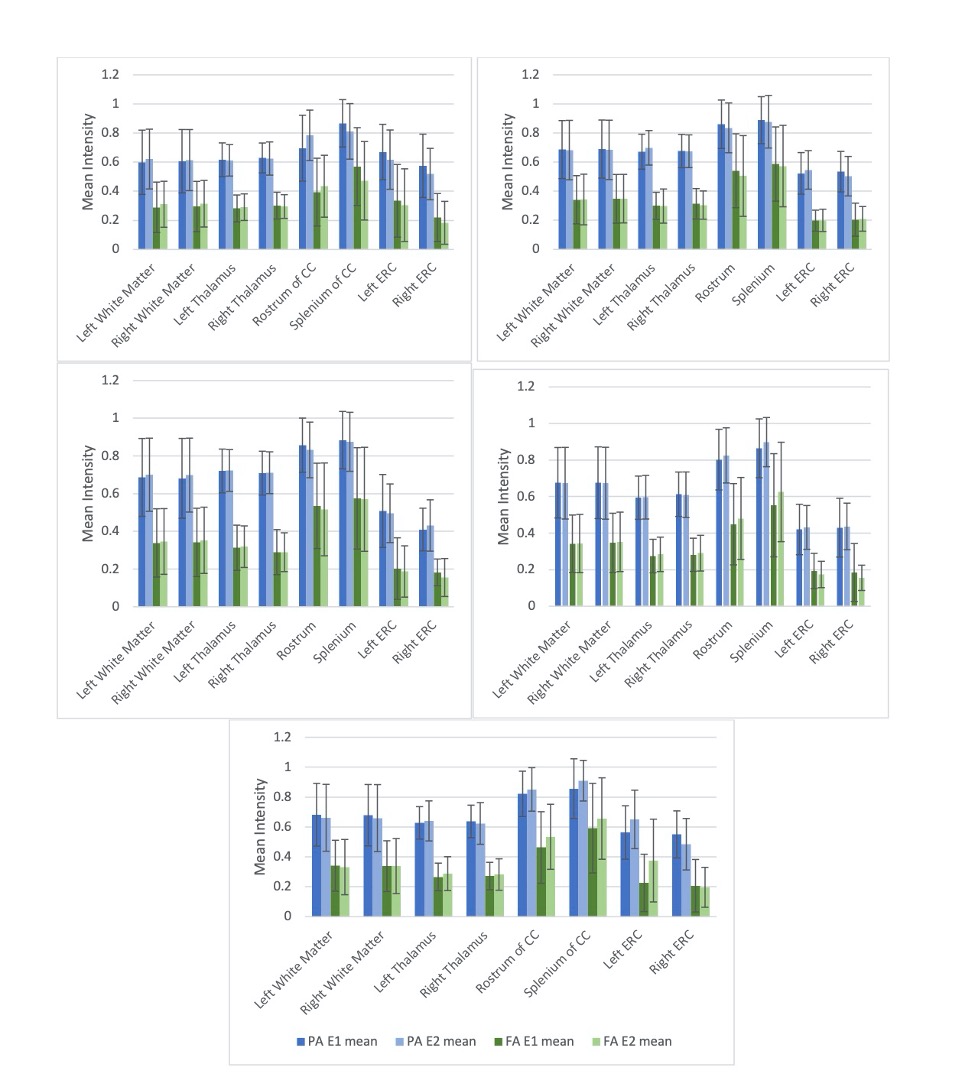
Patients were recruited between age between 15-50 years and a clinical diagnosis of mTBI with Glasgow Coma Scale (GCS) ≥ 13. mTBI was defined as a low-velocity injury that results in clinical symptoms. Patients were enrolled at either Encounter 1 (E1), within 72 h, or Encounter 2 (E2), 5–10 days post-trauma. They returned for a maximum of 4 encounters over 3 months. Encounter 3 (E3) occurred at 15–29 days and Encounter 4 (E4) at 83–97 days. MR images were collected on 3T GE Signa MR750 scanners with a 32-channel brain radiofrequency coil (Nova Medical) from 2014-2015. Images acquired included sagittal MP-RAGE 3D T1 (matrix: 284x284x180, FOV = 25.6cm, slice thickness = 0.9mm, flip angle = 8 degrees, TR/TE/TI = 8.1ms/3.3ms/1100ms, scan time = 4:33); sagittal 3D T2 FLAIR (matrix: 256x256x164, FOV = 25.6cm, slice thickness = 1.0mm, ETL = 200, TE/TR = 119ms/6800ms, scan time = 5:50) ; axial diffusion MRI (single spin echo, matrix: 96x96x21, FOV= 24cm, slice thickness = 2.5mm, flip angle = 90 degrees, TR/TE = 2,600ms/~77ms 140 directions distributed on three shells-25,40,75 directions per shell-with b-values 800,1200,2800 mm2/s with 7 interspersed T2 volumes, scan time = 6:56);Controls underwent neurological assessments and MR imaging at initial and follow-up visits between 7-90 days, with an average of 3 weeks between the initial and follow up encounters. A subset of available healthy control images was then selected to validate the pipeline, consisting of 5 separate individuals, each with scans corresponding to the initial and follow up visit. Diffusion weighted images (DWI) were registered to the corresponding T2W (B0) image and corrected for motion/eddy current distortion10 and skull-stripped11. MAP-MRI and DTI parameters were calculated from the corrected DWI data. Segmentation and cortical parcellation maps were generated on the T1W MP-RAGE scan12 and registered to the diffusion image space13. The entire image processing and analysis pipeline is depicted in Figure 1. ROI analysis for the segments of interest were performed with Matlab. Test-retest variability was compared for propagator anisotropy (PA) and fractional anisotropy (FA) in three regions of the brain: cerebral white matter (WM), thalamus, the rostrum/splenium of the corpus callosum, and the entorhinal cortex.Longitudinal analysis at the timepoints described was also performed for the areas listed above for a representative patient and matched control.
Results
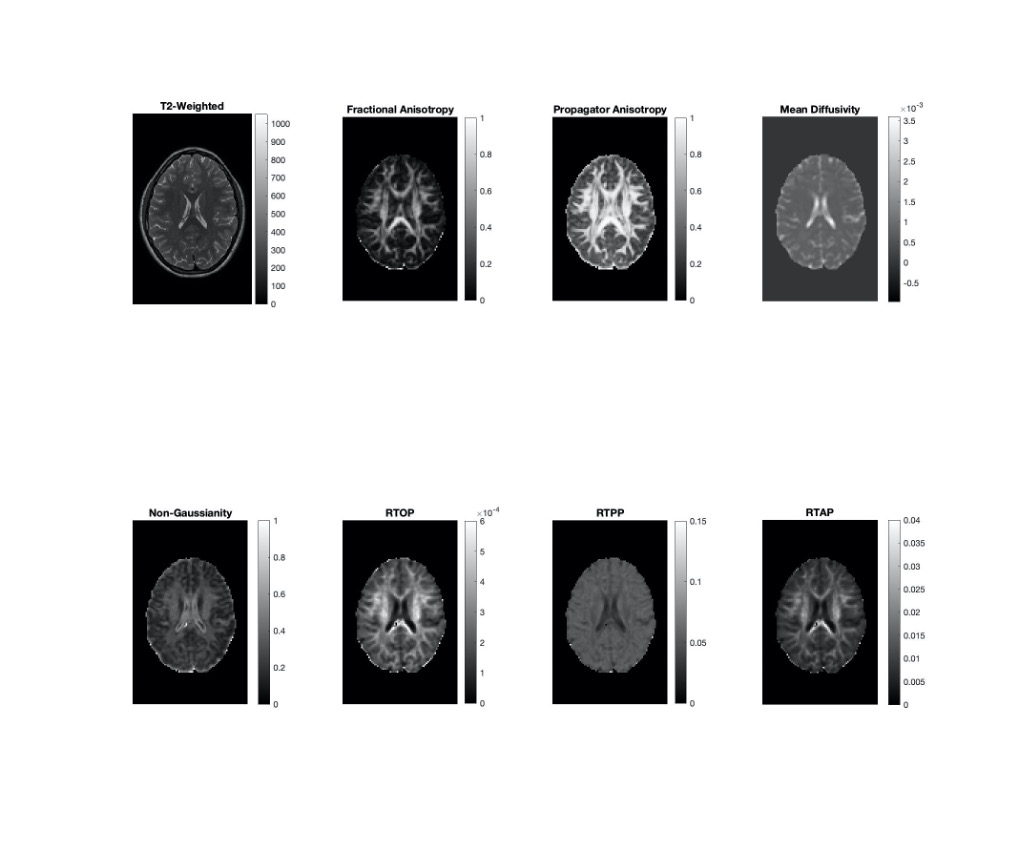
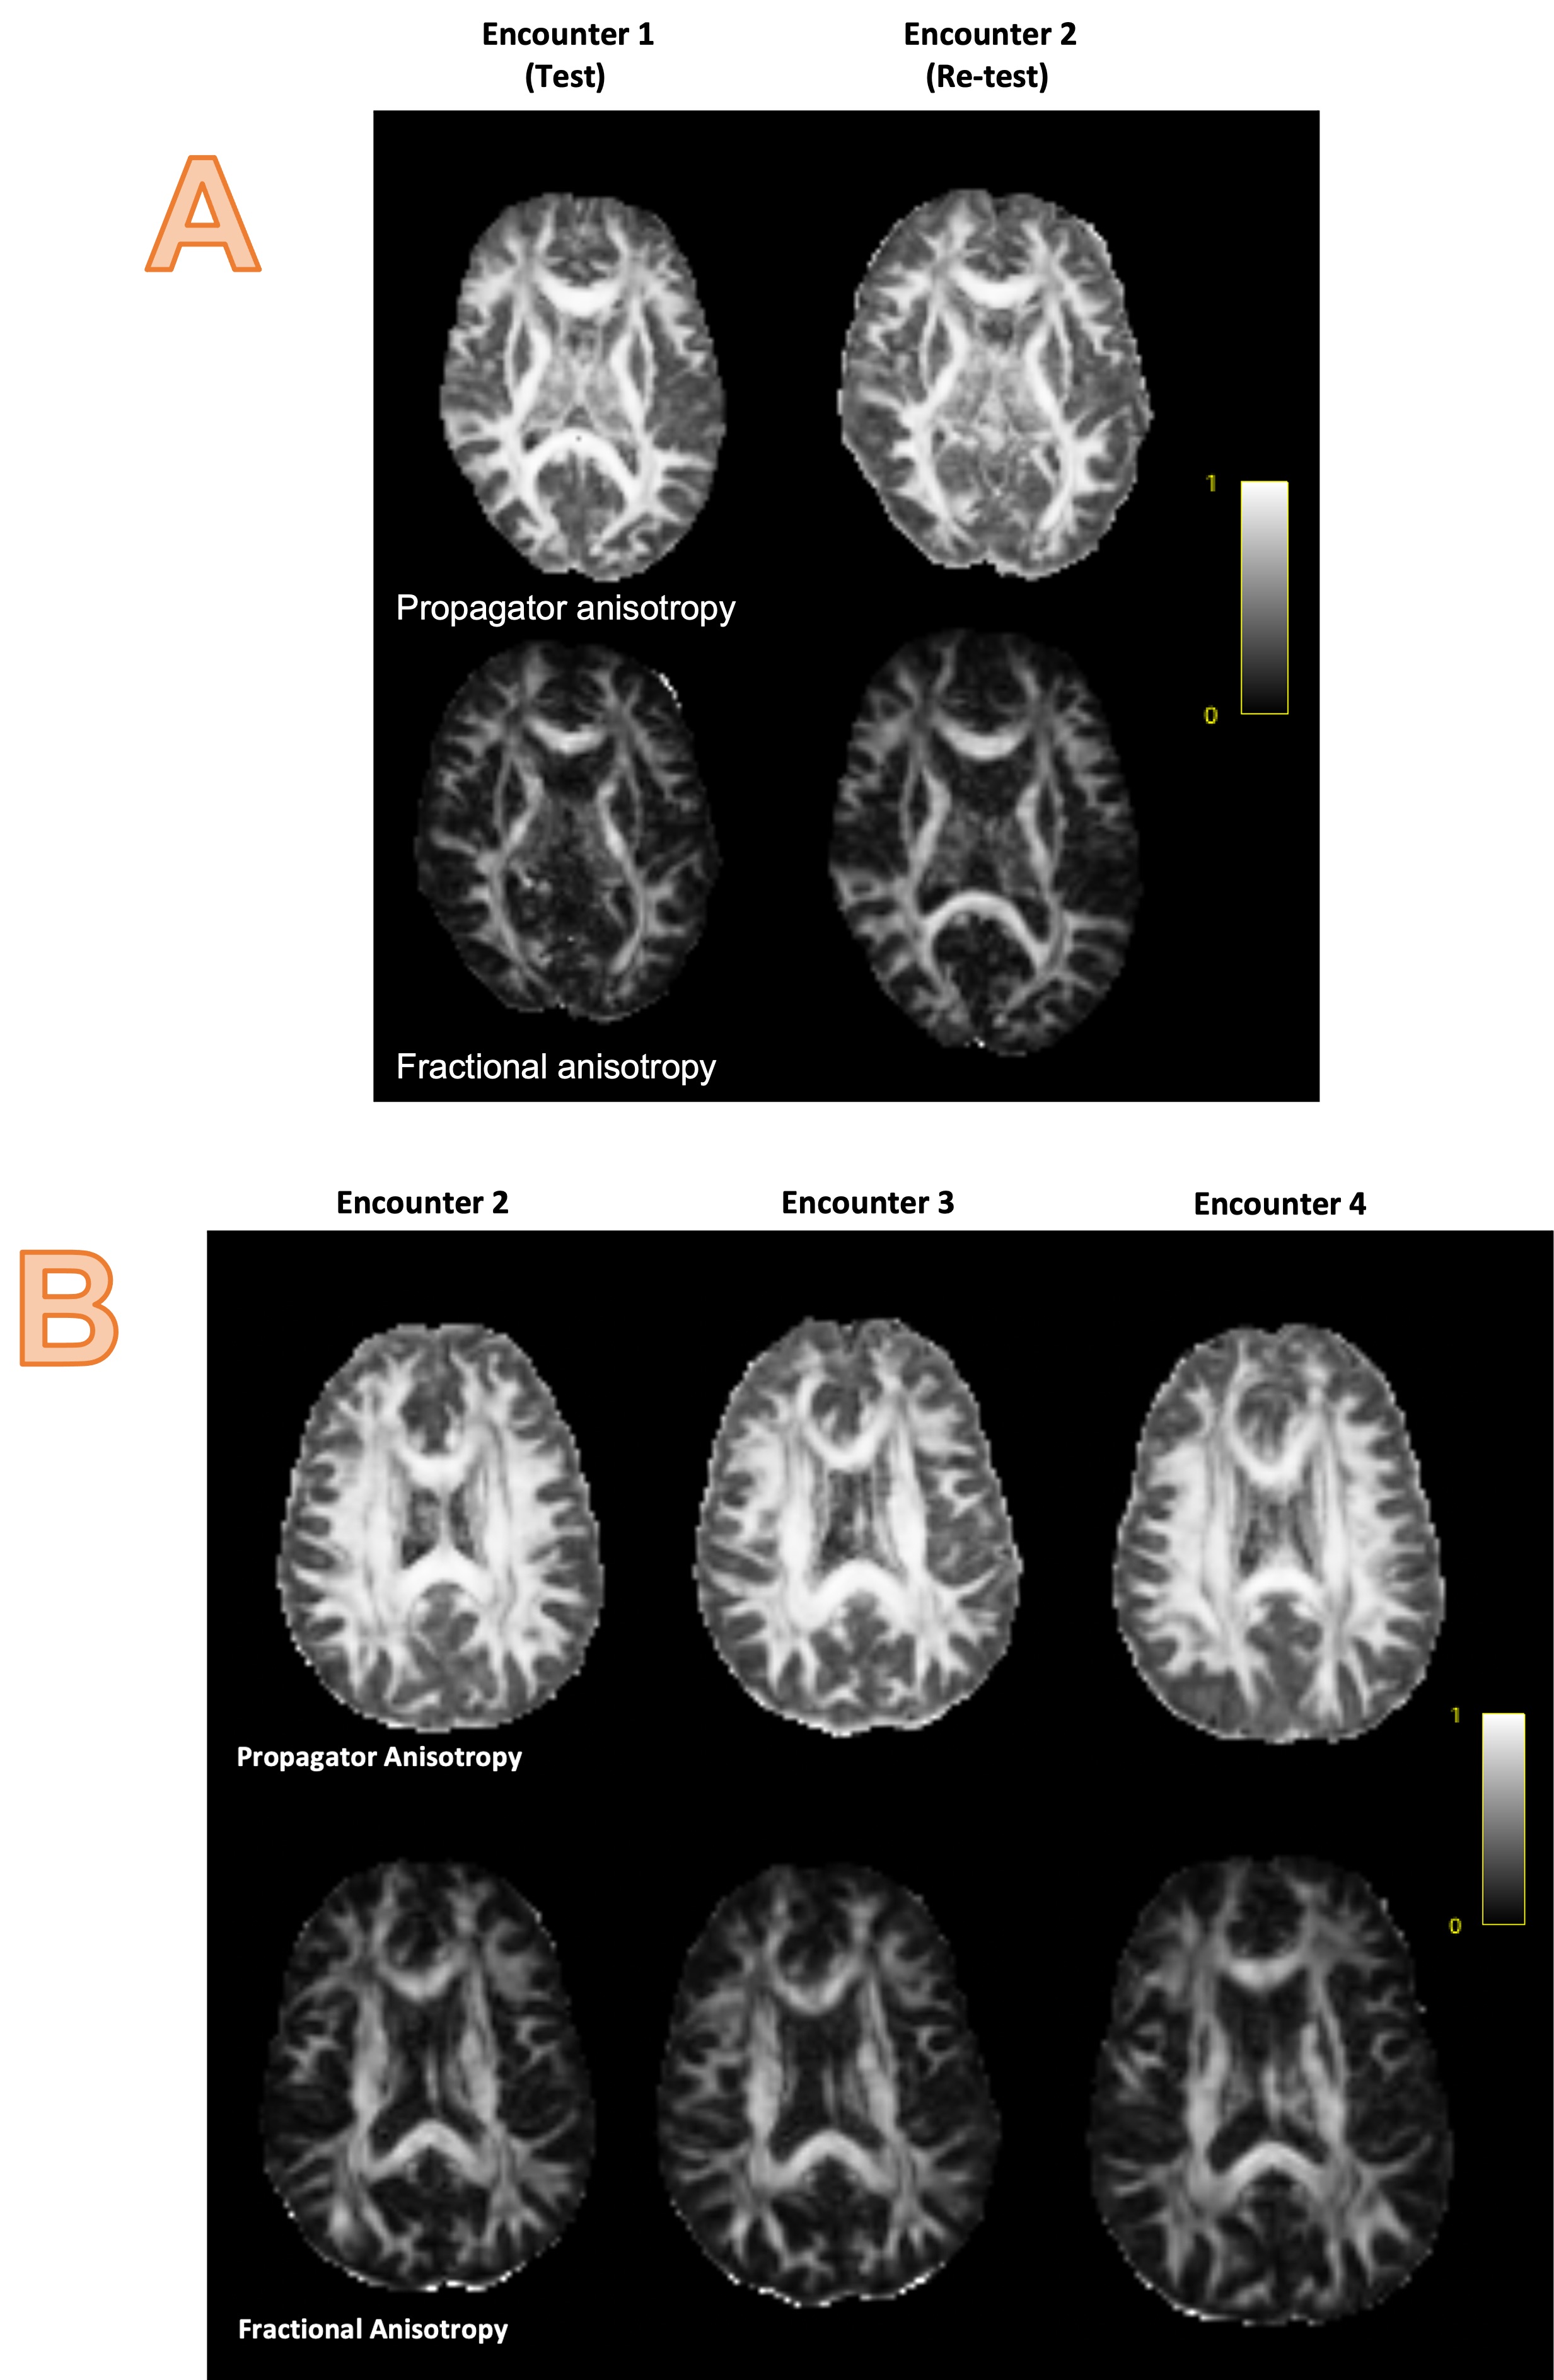
Representative MAP-MRI images from one healthy control as compared to their DTI counterparts are shown in Figure 2. Repeat scans of healthy controls showed minimal variability between E1 and E2 in the MAP-MRI PA image, comparable to the corresponding DTI FA image in cerebral white matter, thalamus, and entorhinal cortex (Figure 3). The PA images showed decreased variability in the rostrum/splenium of the corpus callosum as compared to the FA. In Figure 4, scans from a mTBI patient (who was not fully recovered by the end of the study) at encounters 2, 3, and 4 are shown alongside those from a matched control.Discussion/Conclusions
The MAP-MRI images of healthy controls show improved contrast between grey and white matter areas, as well as increased delineation of WM tracts, when compared to their DTI counterparts. This pipeline was shown to perform well on externally acquired data, with test-retest variability comparable or improved upon from conventional DTI in both subcortical and cortical structures. MAP-MRI is a promising method by which microstructural changes in patients with mTBI can be evaluated, showing improved test-retest variability in WM tracts compared to FA. Improved conspicuity of WM tracts can be used to assess subtle changes in these brain structures over time. With this image and analysis pipeline in place, further work is now needed to analyze longitudinal changes in specific WM tracts and their projections throughout the brain, rather than performing ROI analysis of discrete brain structures. Additionally, MAP-MRI can be used to derive microstructural parameters from many dMRI techniques including DTI and diffusion kurtosis imaging (DKI)14 .Acknowledgements
This work was supported by the Intramural Research Program (IRP) of the Eunice Kennedy Shriver National Institute of Child Health and Human Development and the Clinical Center through the Medical Research Scholar Program, and the CNRM Neuroradiology/Neuropathology Correlation/Integration Core, 309698-4.01-65310, (CNRM-89-9921). The authors would like to thank Dr. Teena Shetty MD, of the Hospital for Special Surgery, for providing the data, and Dr. David Brody MD PhD, for helpful discussions.References
1. Hulkower, M.B., D.B. Poliak, S.B. Rosenbaum, M.E. Zimmerman, and M.L. Lipton. “A Decade of DTI in Traumatic Brain Injury: 10 Years and 100 Articles Later.” American Journal of Neuroradiology 34, no. 11 (November 2013): 2064–74. https://doi.org/10.3174/ajnr.A3395.
2. Özarslan, Evren, Cheng Guan Koay, Timothy M. Shepherd, Michal E. Komlosh, M. Okan İrfanoğlu, Carlo Pierpaoli, and Peter J. Basser. “Mean Apparent Propagator (MAP) MRI: A Novel Diffusion Imaging Method for Mapping Tissue Microstructure.” NeuroImage 78 (September 2013): 16–32. https://doi.org/10.1016/j.neuroimage.2013.04.016.
3. Avram, Alexandru V., Joelle E. Sarlls, Alan S. Barnett, Evren Özarslan, Cibu Thomas, M. Okan Irfanoglu, Elizabeth Hutchinson, Carlo Pierpaoli, and Peter J. Basser. “Clinical Feasibility of Using Mean Apparent Propagator (MAP) MRI to Characterize Brain Tissue Microstructure.” NeuroImage 127 (February 2016): 422–34. https://doi.org/10.1016/j.neuroimage.2015.11.027.
4. Le, Hongbo, Weike Zeng, Huihong Zhang, Jianing Li, Xiaoyan Wu, Mingwei Xie, Xu Yan, et al. “Mean Apparent Propagator MRI Is Better Than Conventional Diffusion Tensor Imaging for the Evaluation of Parkinson’s Disease: A Prospective Pilot Study.” Frontiers in Aging Neuroscience 12 (September 24, 2020): 563595. https://doi.org/10.3389/fnagi.2020.563595.
5. Ma, Keran, Xiaonan Zhang, Huiting Zhang, Xu Yan, Ankang Gao, Chengru Song, Shaoyu Wang, Yajun Lian, and Jingliang Cheng. “Mean Apparent Propagator-MRI: A New Diffusion Model Which Improves Temporal Lobe Epilepsy Lateralization.” European Journal of Radiology 126 (May 2020): 108914. https://doi.org/10.1016/j.ejrad.2020.108914.
6. Mao, Jiaji, Weike Zeng, Qinyuan Zhang, Zehong Yang, Xu Yan, Huiting Zhang, Mengzhu Wang, Guang Yang, Minxiong Zhou, and Jun Shen. “Differentiation between High-Grade Gliomas and Solitary Brain Metastases: A Comparison of Five Diffusion-Weighted MRI Models.” BMC Medical Imaging 20, no. 1 (December 2020): 124. https://doi.org/10.1186/s12880-020-00524-w.
7. Boscolo Galazzo, Ilaria, Lorenza Brusini, Silvia Obertino, Mauro Zucchelli, Cristina Granziera, and Gloria Menegaz. “On the Viability of Diffusion MRI-Based Microstructural Biomarkers in Ischemic Stroke.” Frontiers in Neuroscience 12 (February 21, 2018): 92. https://doi.org/10.3389/fnins.2018.00092.
8. Shetty, Teena, Joseph T. Nguyen, Taylor Cogsil, Apostolos John Tsiouris, Sumit N. Niogi, Esther U. Kim, Aashka Dalal, et al. “Clinical Findings in a Multicenter MRI Study of Mild TBI.” Frontiers in Neurology 9 (October 23, 2018): 836. https://doi.org/10.3389/fneur.2018.00836.
9. Niogi, Sumit N., Neal Luther, Kenneth Kutner, Teena Shetty, Heather J. McCrea, Ronnie Barnes, Leigh Weiss, et al. “Increased Sensitivity to Traumatic Axonal Injury on Postconcussion Diffusion Tensor Imaging Scans in National Football League Players by Using Premorbid Baseline Scans.” Journal of Neurosurgery 133, no. 4 (October 2020): 1063–71. https://doi.org/10.3171/2019.3.JNS181864.
10. Pierpaoli, C. et al. in 18th Scientific Meeting of the International Society for Magnetic Resonance in Medicine. 1597.
11. Jenkinson, Mark, Christian F. Beckmann, Timothy E.J. Behrens, Mark W. Woolrich, and Stephen M. Smith. “FSL.” NeuroImage 62, no. 2 (August 2012): 782–90. https://doi.org/10.1016/j.neuroimage.2011.09.015.
12. Fischl, Bruce. “FreeSurfer.” NeuroImage 62, no. 2 (August 2012): 774–81. https://doi.org/10.1016/j.neuroimage.2012.01.021.
13. Avants, B. B., Tustison, N. & Song, G. Advanced normalization tools (ANTS). Insight j 2, 1-35 (2009).
14. Avram, A. V., Hutchinson, E. & Basser, P. J. in Proceedings of the International Society for Magnetic Resonance in Medicine Vol. 25 3367 (Hawai'i, USA, 2017).
Figures