2739
Diffusion microstructure measurements across the brain and lifespan1Department of Radiology & Medical Imaging, University of Virginia, Charlottesville, VA, United States
Synopsis
Understanding how the brain develops, matures, ages, and declines is one of the fundamental questions facing neuroscience1–3. Recent advances in diffusion microstructure analysis have allowed for detailed descriptions of neuronal change. However, it is essential that findings from these studies are appropriately contextualized to general age-related changes in the brain4,5. This study uses 3-tissue constrained spherical deconvolution (3T-CSD) to examine the relationship between brain diffusion microstructure and chronological age in a number of gross anatomical structures, subcortical gray matter, and cortex while additionally evaluating lateral differences in microstructural measurements. The results should serve as a benchmark for diffusion microstructure studies.
Introduction
Across the human lifespan, the structure of the brain changes dynamically in response to internal and external factors. The brain dramatically increases in size early in life and shows a remarkable decrease in volume in older individuals. It is likely these coarse changes are accompanied by changes in the underlying brain tissue microstructure. 3T-CSD is a promising measurement of diffusion microstructure that can describe 3 tissue signal fraction compartments in a voxel-wise manner: intracellular anisotropically diffusing white matter (ICA), intracellular isotropically diffusing gray matter (ICI), and extracellular isotropically diffusing free water (ECI). Recent studies have used 3T-CSD to explore a number of conditions in development and aging. However, a comprehensive study of how these 3 brain microstructure compartments change across the lifespan has been lacking. This study aims to provide a detailed description of 3T-CSD signal fraction changes throughout the lifespan and across the brain as a reference for future studies.Methods
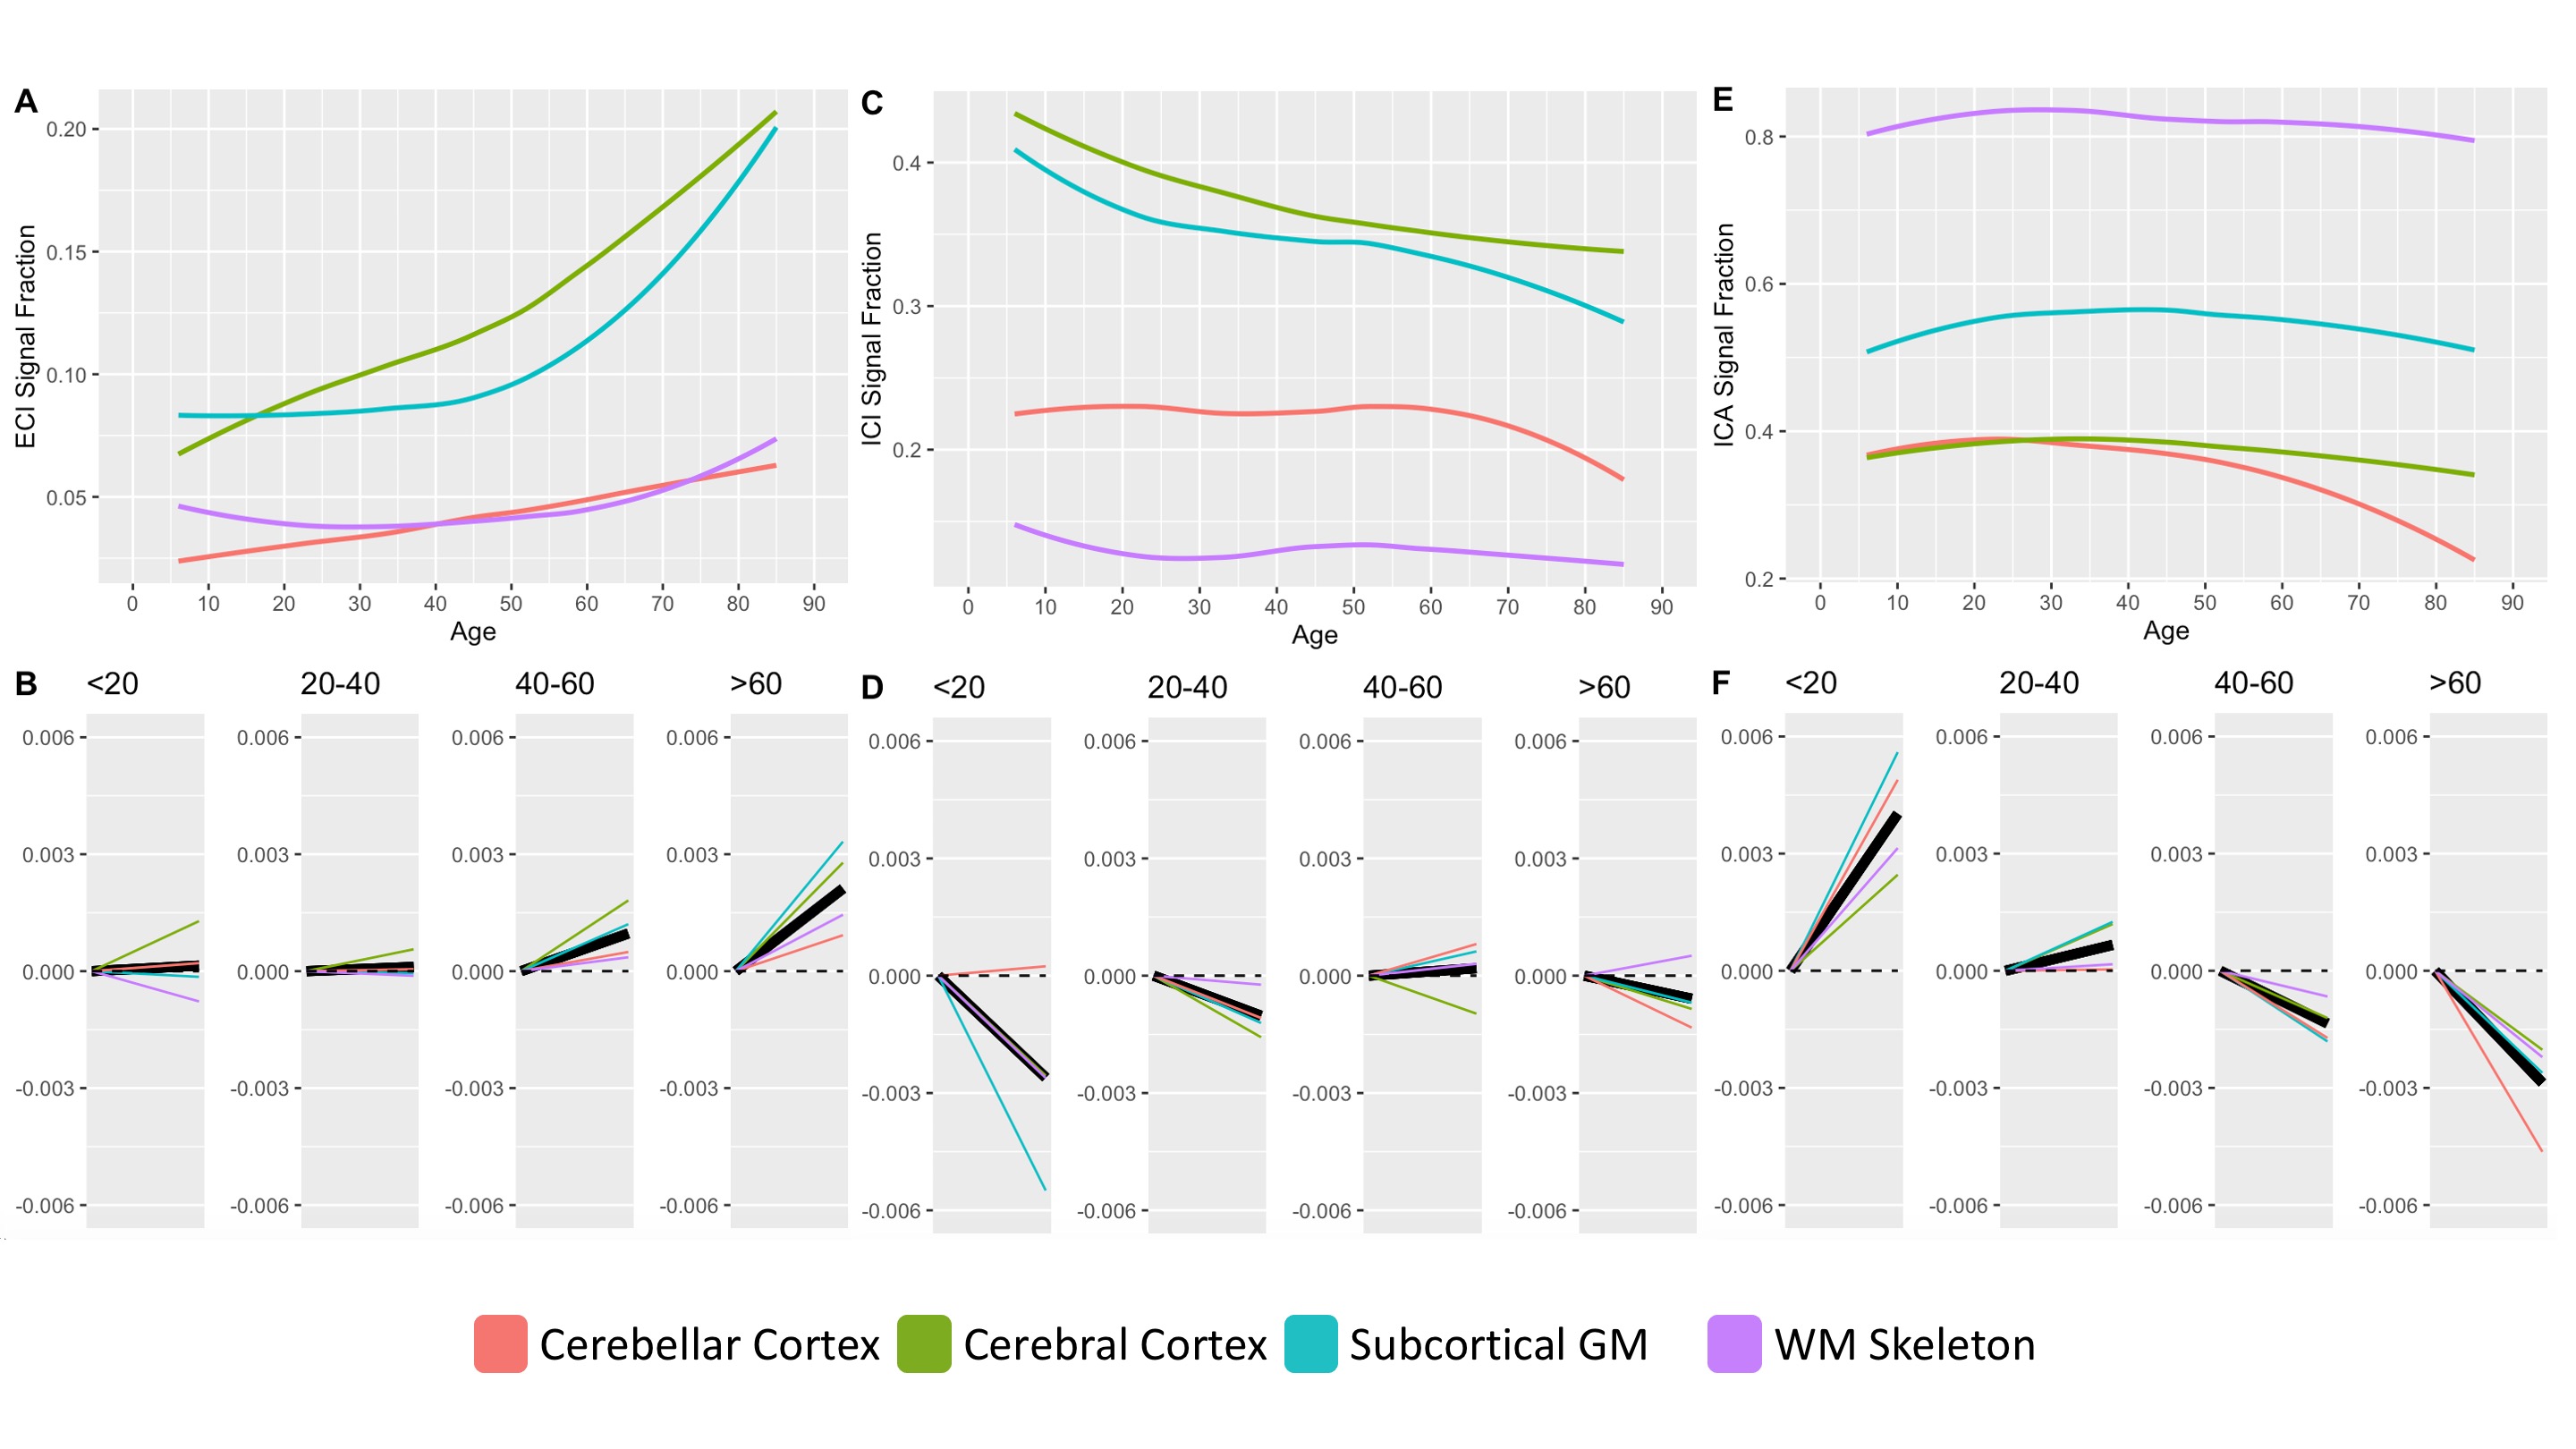
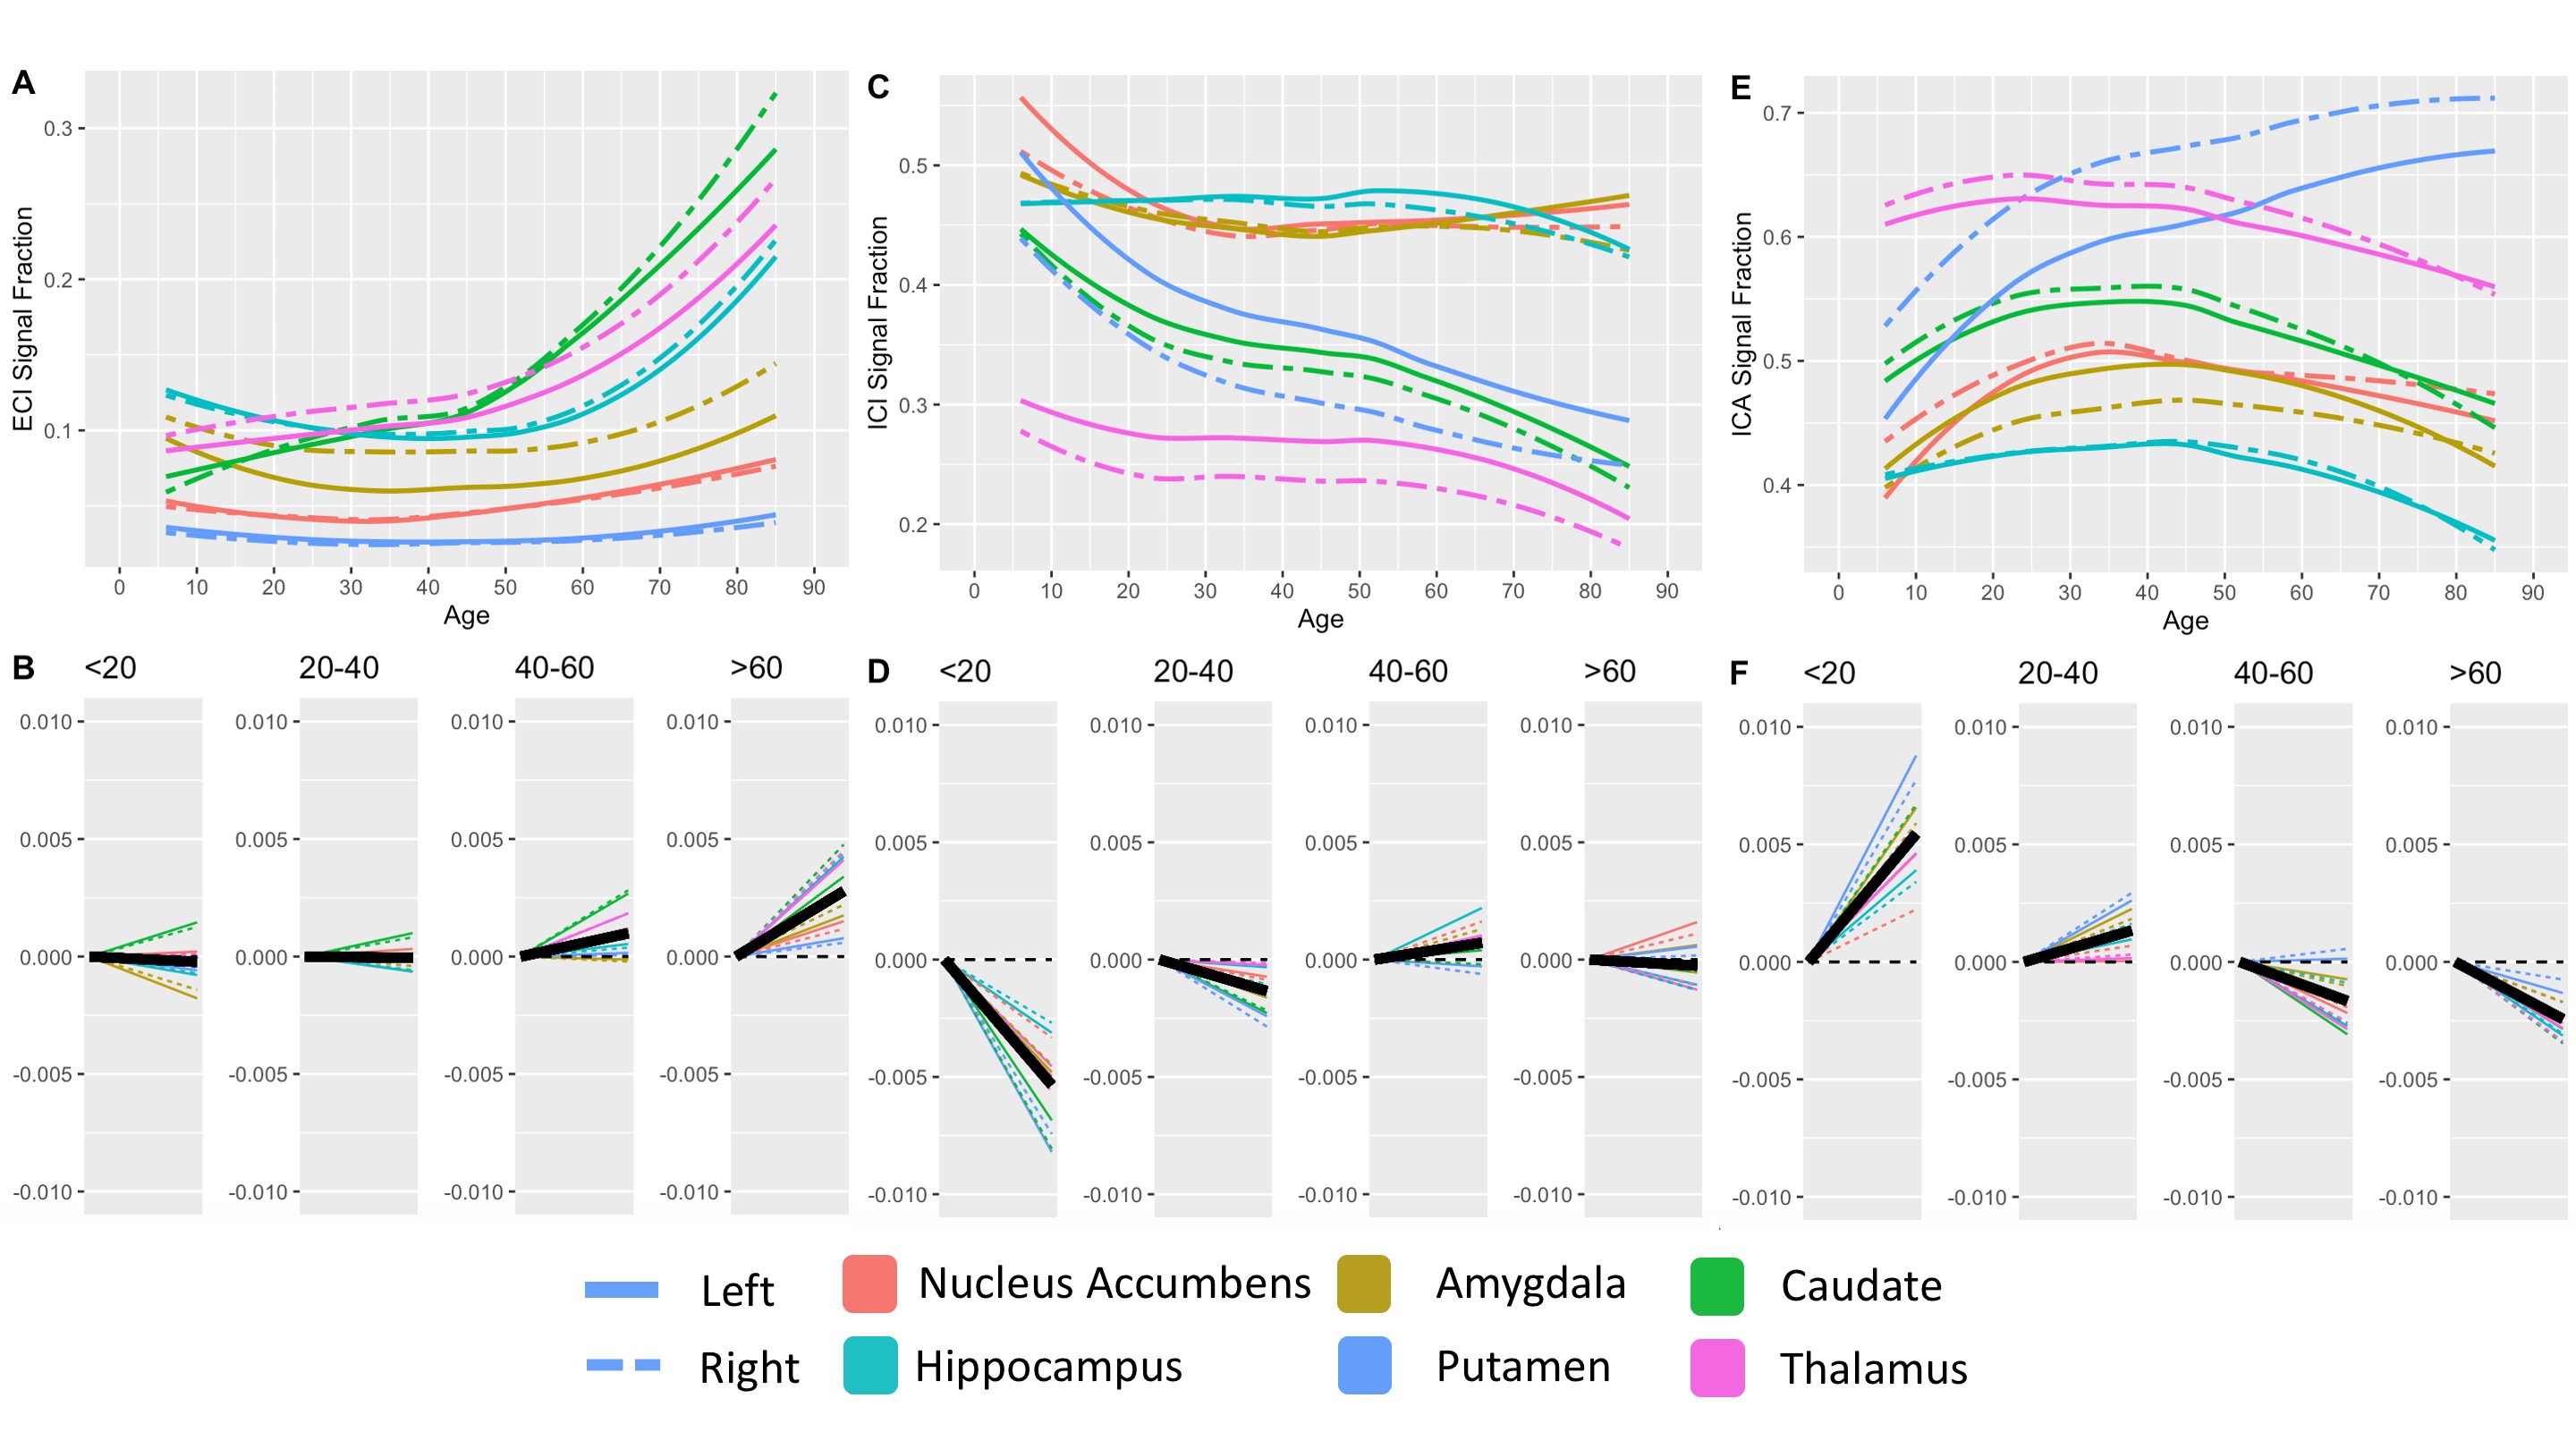
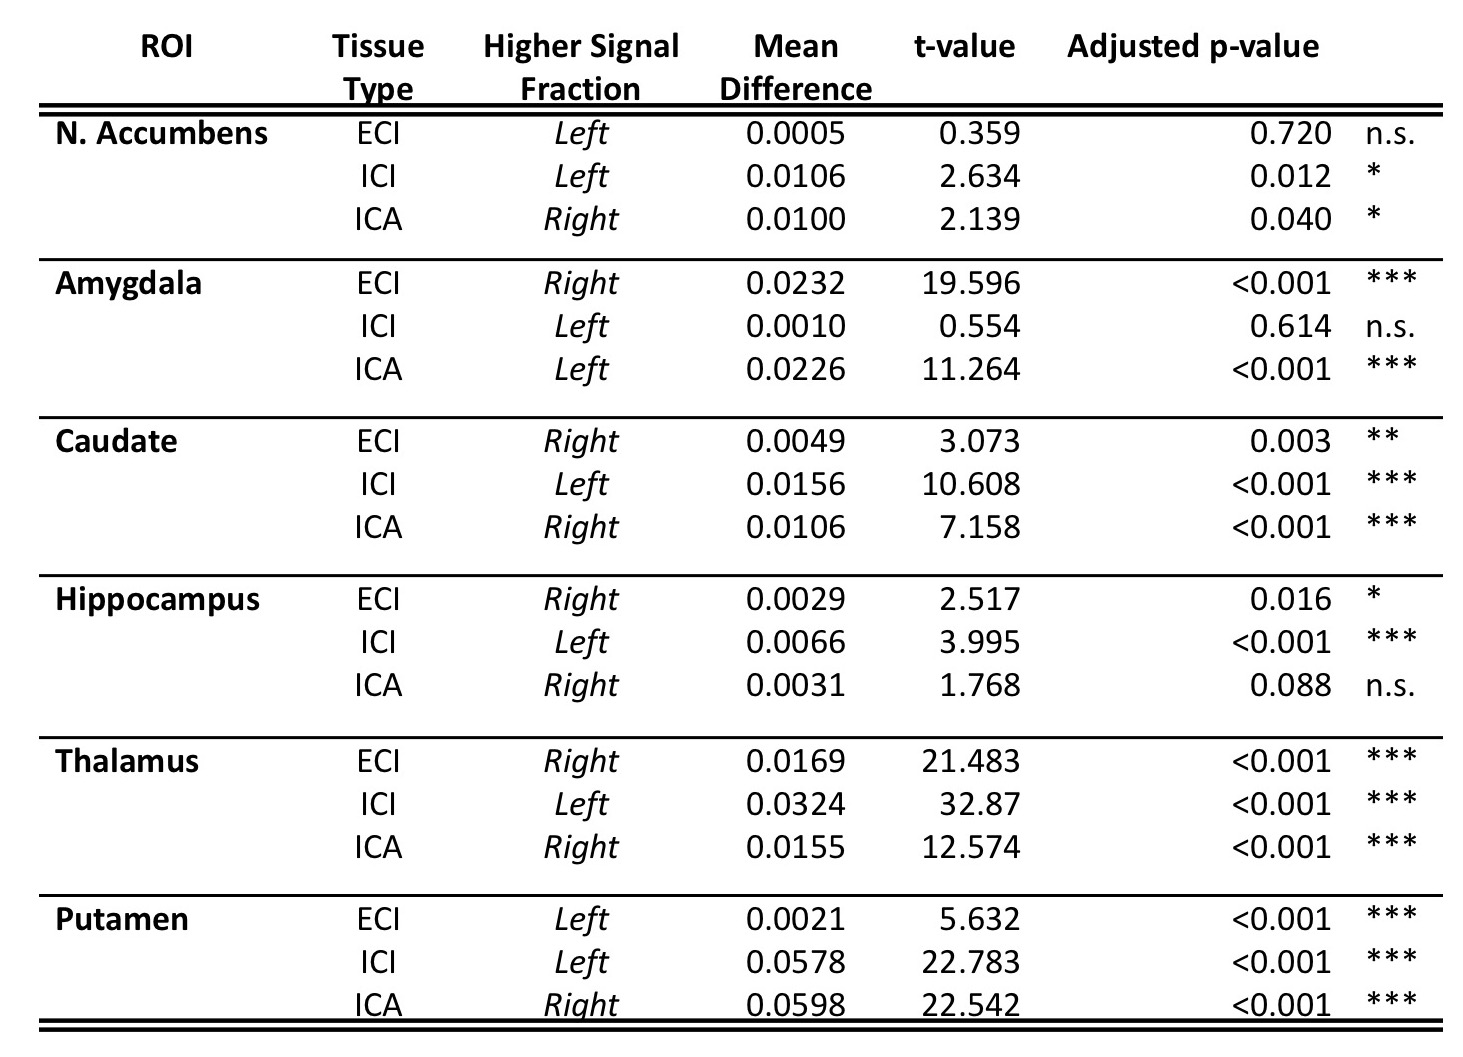
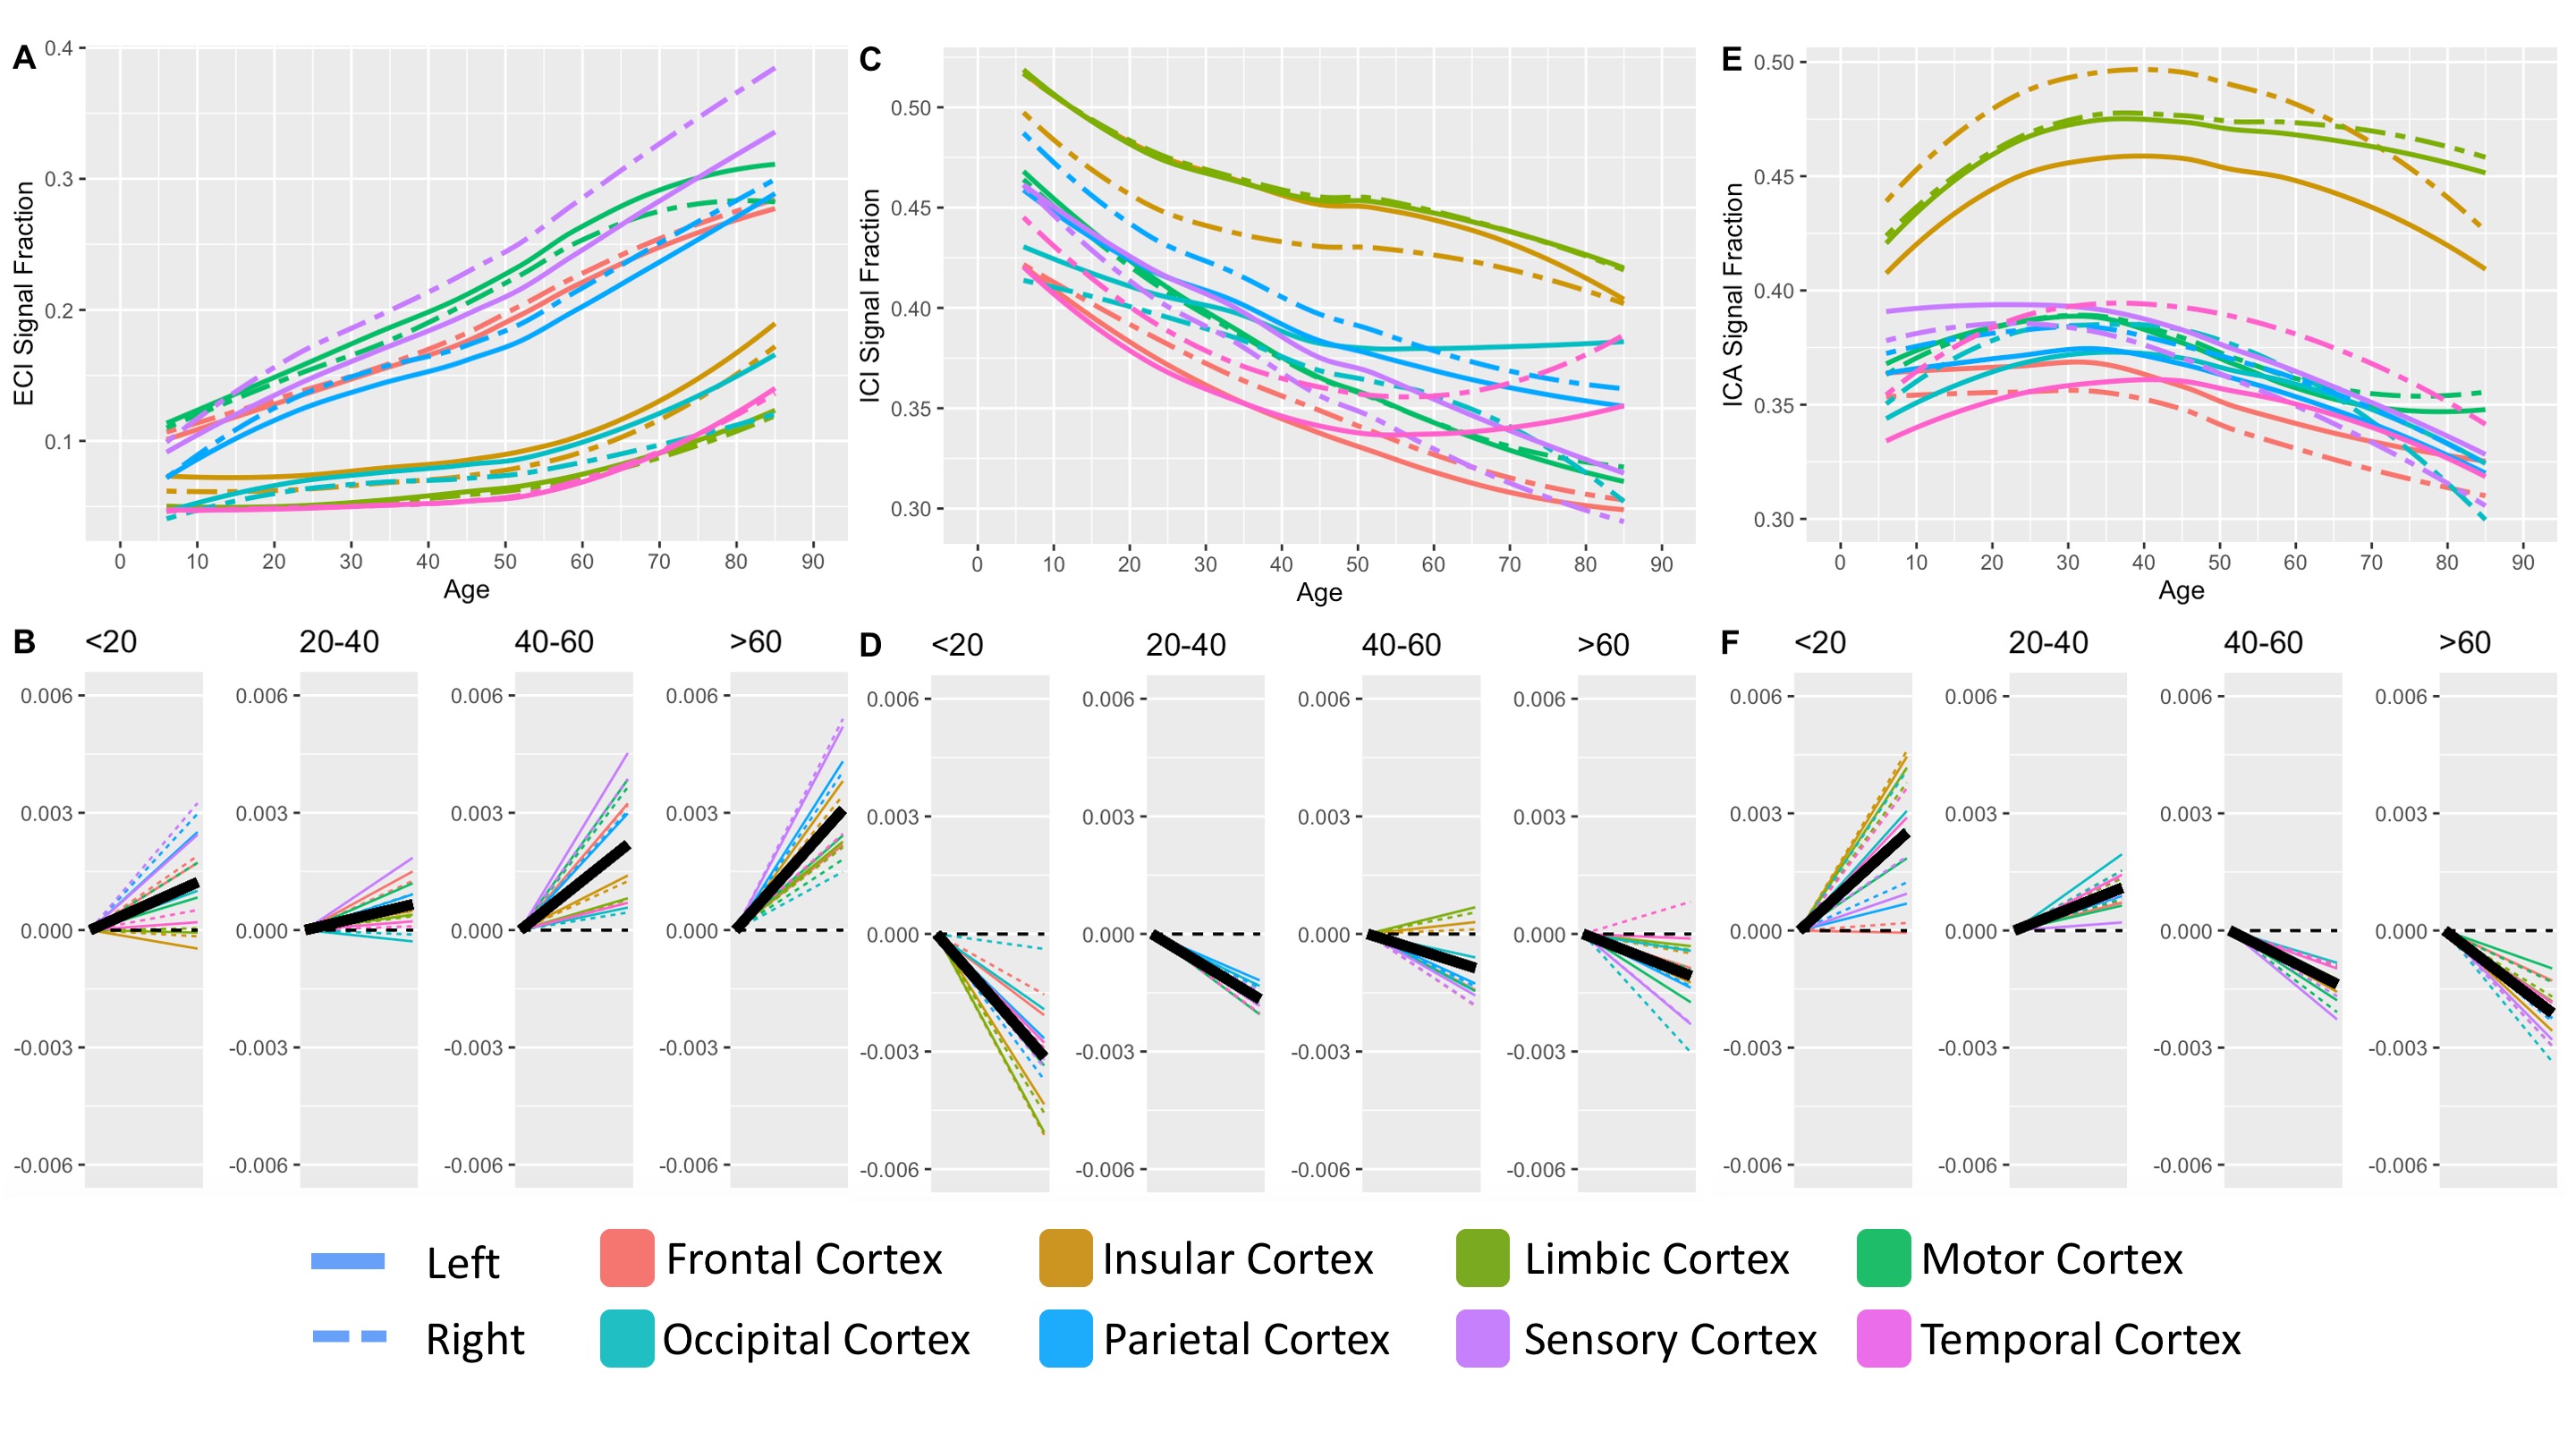
409 subjects from the Nathanial Kline Institute’s Rockland study, a cohort designed to demographically reflect the overall population of the United States, were analyzed with an age range 6-85 years-old (mean 42.67 ± 20.79 S.D.)6. There were 144 male and 265 female participants with average ages of 36.09 ± 21.22 S.D. and 46.25 ± 19.68 S.D., respectively. Brain diffusion MRI was acquired using a Siemens MAGNETOM TrioTim 3T scanner with an isotropic voxel size of 2.0⨉2.0⨉2.0mm3, TE=85ms and TR=2400ms; 9 b=0 images and 127 gradient directions at b=1500s/mm2. Each subject’s diffusion image set was analyzed using SS3T-CSD7,8 implemented in the open source software MRtrix and MRtrix3Tissue7,9. Several preprocessing steps utilized FSL10,11. Diffusion images were denoised12, corrected for Gibbs ringing13, susceptibility distortions11, subject motion14, and eddy currents15. All images were upsampled to of 1.3⨉1.3⨉1.3mm3, and skullstripping was performed using the Brain Extraction Tool10. Response functions were generated16 from each tissue type and used to generate fiber orientation distributions (FODs)8. Signal fractions were calculated directly from the FODs using 3-tissue constrained spherical deconvolution (3T-CSD) which output ICA, ICI, and ECI signal fractions17. White matter FODs were used to generate a cohort-specific FOD template image from 50 individuals between ages 32-38 years-old and each subject’s individual WM FOD image was registered to this template18,19. Both the JHU-DTI based ICBM-DTI-81 white matter atlas including 48 ROIs10,20–22, and the Destrieux atlas including 164 grey matter ROIs23 were warped into the study space. The cortical ROIs from the Destrieux atlas were summarized in a whole cortical ribbon ROI, as well as a cerebellum GM, and a total subcortical GM ROI. The cortical ribbon ROI was further divided into 8 generalized cortical regions. All ROIs from the JHU WM atlas were combined to provide a summary of the WM skeleton. Signal fraction values from each of the three tissue compartments (ICA, ICI, and ECI) were averaged within each of the individual ROIs. The relationship between each signal fraction and age was plotted across the whole lifespan with a locally weighted smoothing (LOESS) line used to summarize the relationship, as well as subdividing the age range into 4 life phases: approximate development (<20 years), early adulthood (20-40 years), late adulthood (40-60 years), and senescence (>60 years). A linear model directly comparing the relationship between age and signal fraction was calculated individually for each ROI within each of the 4 phases and the slope displayed.Results
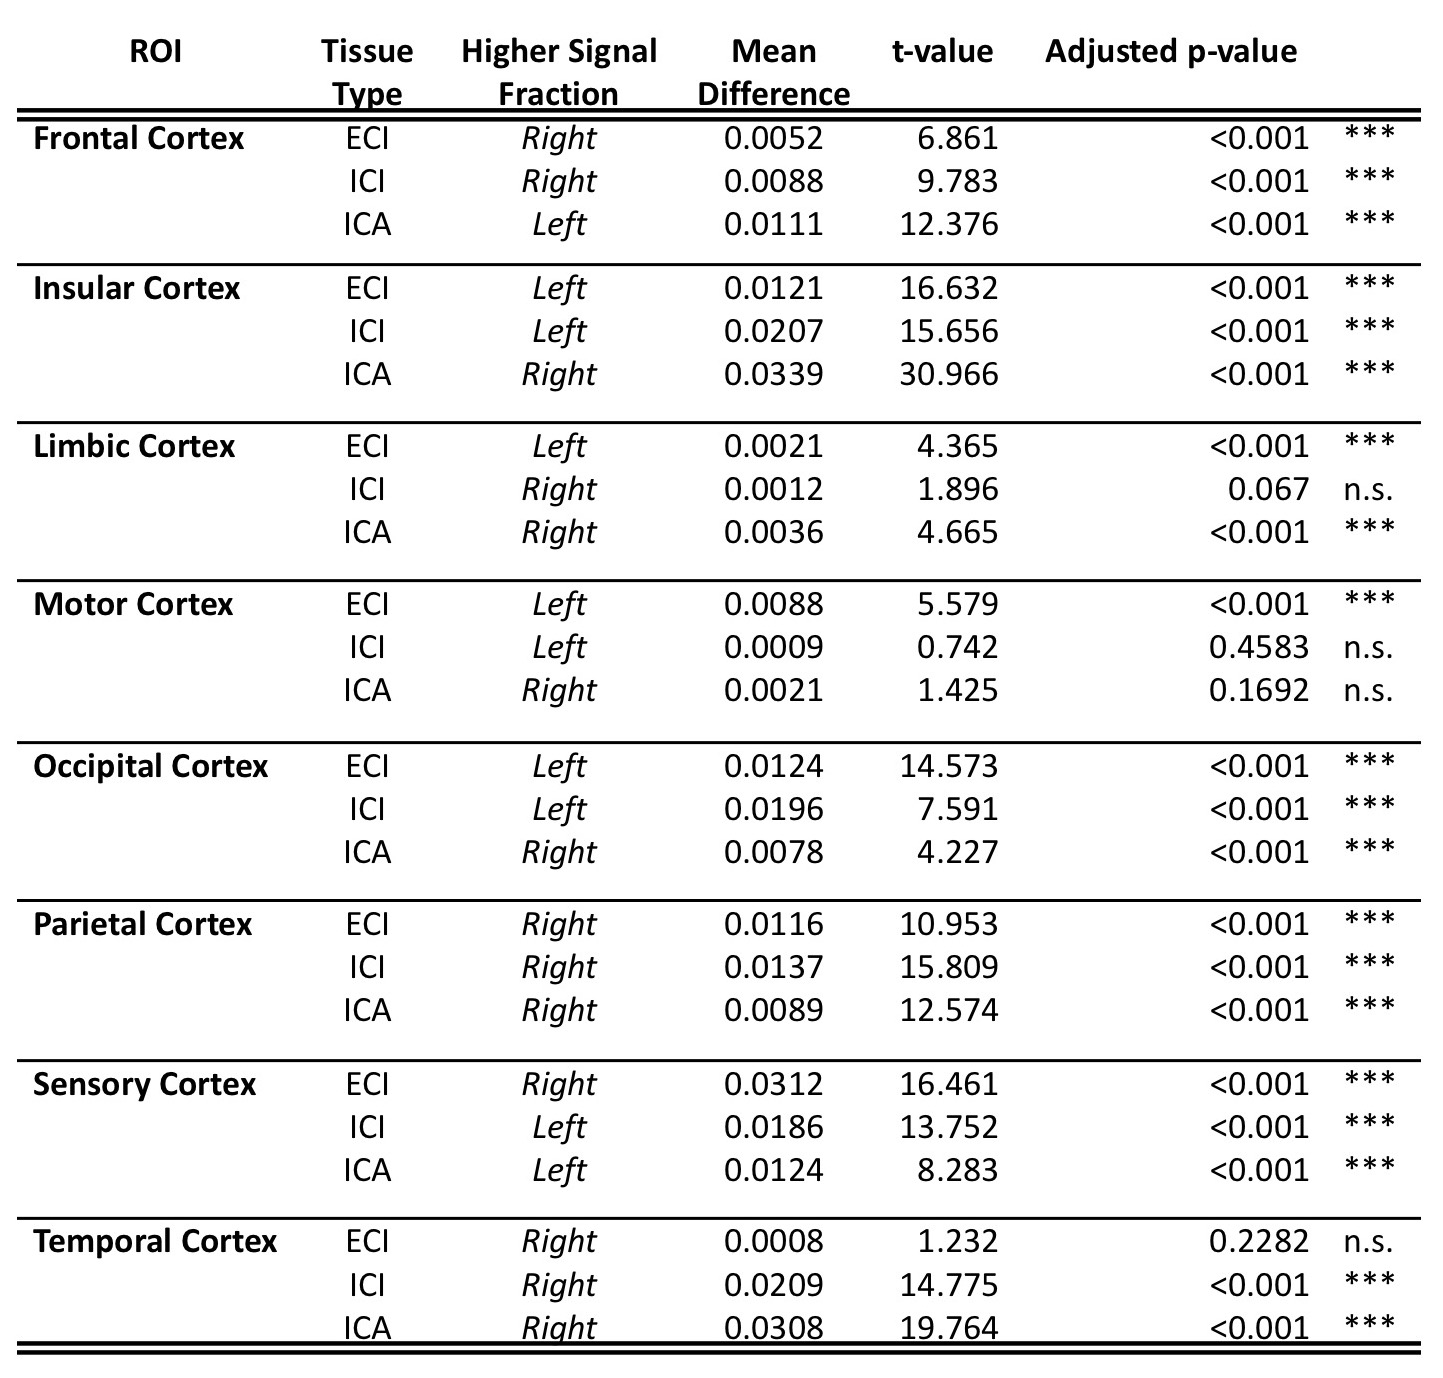
Results from gross anatomical regions (Fig. 1), subcortical GM structures (Fig. 2), and cerebral cortex (Fig. 3) are presented with both whole lifespan trends for each of the 3 signal fractions and linear slopes within each of the 4 lifespan phases for ease of reference to studies with age populations grouped exclusively within those ranges. The general trajectory of signal fraction measurements was a positive relationship with age and ECI signal fraction, a negative relationship between age and ICI signal fraction, and an inverted U-shaped trajectory for the ICA signal fraction. Looking at individual sub-areas these trends tended to still be present, with some notable exceptions such as the increase in ICA signal fraction in the putamen. Larger differences were present between structures and there was significant lateral differences between hemispheres for each of the subcortical GM structures (Table 1) and for each of the cortical regions (Table 2).Discussion
The relationship between age and each of the signal fraction metrics across multiple brain regions demonstrate that there are clear trends within the gross anatomical regions but that several specific subregions show clear departures from this trend. There was an unambiguous trend in aging toward increased ECI/free water signal fraction which supports the findings of several other 3T-CSD papers regarding neuronal decline or injury5,24,25. These results are also important to interpret findings such as the effect of pubertal hormones, which cause changes against the age-related trajectory, suggesting that additional features beyond age-related development may be occurring in adolescent populations.Conclusion
These results describe the relationship between brain microstructure and age and illustrate how cellular microstructure changes throughout the lifespan. Studies analyzing diffusion in developing or aging cohorts should address shifts in anisotropic and isotropic signal in development and dramatically increased levels of extracellular water in agingAcknowledgements
No acknowledgement found.References
1. Grady, C. L., Springer, M. V., Hongwanishkul, D., McIntosh, A. R. & Winocur, G. Age-related changes in brain activity across the adult lifespan. J. Cogn. Neurosci. 18, 227–241 (2006).
2. Ziegler, G. et al. Brain structural trajectories over the adult lifespan. Hum. Brain Mapp. 33, 2377–2389 (2012).
3. Hammond, T. R. et al. Single-cell RNA sequencing of microglia throughout the mouse lifespan and in the injured brain reveals complex cell-state changes. Immunity 50, 253-271. e6 (2019).
4. Pasternak, O., Kelly, S., Sydnor, V. J. & Shenton, M. E. Advances in microstructural diffusion neuroimaging for psychiatric disorders. Neuroimage 182, 259–282 (2018).
5. Mito, R. et al. In vivo microstructural heterogeneity of white matter lesions in healthy elderly and Alzheimer’s disease participants using tissue compositional analysis of diffusion MRI data. NeuroImage Clin. 28, 102479 (2020).
6. Nooner, K. B. et al. The NKI-Rockland sample: a model for accelerating the pace of discovery science in psychiatry. Front. Neurosci. 6, 152 (2012).
7. Dhollander, T. & Connelly, A. A novel iterative approach to reap the benefits of multi-tissue CSD from just single-shell (+ b= 0) diffusion MRI data. in Proc ISMRM vol. 24 3010 (2016).
8. Jeurissen, B., Tournier, J.-D., Dhollander, T., Connelly, A. & Sijbers, J. Multi-tissue constrained spherical deconvolution for improved analysis of multi-shell diffusion MRI data. NeuroImage 103, 411–426 (2014).
9. Tournier, J.-D. et al. MRtrix3: A fast, flexible and open software framework for medical image processing and visualisation. NeuroImage 202, 116137 (2019).
10. Jenkinson, M., Beckmann, C. F., Behrens, T. E., Woolrich, M. W. & Smith, S. M. Fsl. Neuroimage 62, 782–790 (2012).
11. Smith, S. M. et al. Advances in functional and structural MR image analysis and implementation as FSL. Neuroimage 23, S208–S219 (2004).
12. Veraart, J., Fieremans, E. & Novikov, D. S. Diffusion MRI noise mapping using random matrix theory. Magn. Reson. Med. 76, 1582–1593 (2016).
13. Kellner, E., Dhital, B., Kiselev, V. G. & Reisert, M. Gibbs‐ringing artifact removal based on local subvoxel‐shifts. Magn. Reson. Med. 76, 1574–1581 (2016).
14. Andersson, J. L., Graham, M. S., Zsoldos, E. & Sotiropoulos, S. N. Incorporating outlier detection and replacement into a non-parametric framework for movement and distortion correction of diffusion MR images. Neuroimage 141, 556–572 (2016).
15. Andersson, J. L. & Sotiropoulos, S. N. An integrated approach to correction for off-resonance effects and subject movement in diffusion MR imaging. Neuroimage 125, 1063–1078 (2016).
16. Dhollander, T., Raffelt, D. & Connelly, A. Unsupervised 3-tissue response function estimation from single-shell or multi-shell diffusion MR data without a co-registered T1 image. in ISMRM Workshop on Breaking the Barriers of Diffusion MRI vol. 5 5 (2016).
17. Newman, B. T., Dhollander, T., Reynier, K. A., Panzer, M. B. & Druzgal, T. J. Test–retest reliability and long‐term stability of three‐tissue constrained spherical deconvolution methods for analyzing diffusion MRI data. Magn. Reson. Med. 84, 2161–2173 (2020).
18. Raffelt, D. et al. Symmetric diffeomorphic registration of fibre orientation distributions. NeuroImage 56, 1171–1180 (2011).
19. Newman, B. T., Untaroiu, A. & Druzgal, T. J. A novel diffusion registration method with the NTU-DSI-122 template to transform free water signal fraction maps to stereotaxic space. Proceedings of the ISMRM 28th General Meeting, (2020).
20. Hua, K. et al. Tract probability maps in stereotaxic spaces: analyses of white matter anatomy and tract-specific quantification. Neuroimage 39, 336–347 (2008).
21. Mori, S., Wakana, S., Van Zijl, P. C. & Nagae-Poetscher, L. M. MRI atlas of human white matter. (Elsevier, 2005).
22. Wakana, S. et al. Reproducibility of quantitative tractography methods applied to cerebral white matter. Neuroimage 36, 630–644 (2007).
23. Destrieux, C., Fischl, B., Dale, A. & Halgren, E. Automatic parcellation of human cortical gyri and sulci using standard anatomical nomenclature. Neuroimage 53, 1–15 (2010).
24. Mito, R. et al. Fibre-specific white matter reductions in Alzheimer’s disease and mild cognitive impairment. Brain141, 888–902 (2018).
25. Khan, W., Khlif, M. S., Mito, R., Dhollander, T. & Brodtmann, A. Investigating the microstructural properties of normal-appearing white matter (NAWM) preceding conversion to white matter hyperintensities (WMHs) in stroke survivors. NeuroImage 232, 117839 (2021).
Figures