2737
ACUTE CAFFEINE ADMINISTRATION AS A CONFOUND FOR q-MRI and volumetric MRI STUDIES1Institute of Medical Science, University of Toronto, Toronto, ON, Canada, 2Brain Health Imaging Centre, Centre for Addiction and Mental Health, Toronto, ON, Canada, 3Tanz Centre for Research in Neurodegenerative Diseases, University of Toronto, Toronto, ON, Canada, 4Department of Psychiatry, University of Toronto, Toronto, ON, Canada
Synopsis
Changes in cerebral blood flow (CBF) have the ability to confound structural and quantitative MRI studies. Caffeine is widely consumed and leads to strong decreases in CBF. Moderate caffeine users were scanned before and after caffeinated and decaffeinated coffee over two separate days. Percentage change in CBF maps, quantitative T1 maps, and estimates of grey matter volume (GMV) were assessed for the caffeinated coffee and decaffeinated coffee days. Robust decreases in CBF were observed, along with changes in T1 maps and estimates of GMV. Caffeine intake should be considered in studies relying on structural and quantitative MRI measures.
Introduction
Caffeine is the most commonly consumed psychoactive substance in the world, being consumed daily by ~80% of North American adults1. Moderate doses of caffeine (~250mg or one strong cup of coffee) have been shown to decrease cerebral blood flow (CBF) by ~27%, particularly in moderate caffeine users (>200mg/day)2. Yet, caffeine consumption is rarely taken into account in structural neuroimaging. Recent research has shown that MRI-based estimates of gray matter volume (GMV), cortical thickness (CT) and T1 values may be confounded by the amount of water and blood within tissues3,4. Specifically, GMV and CT measurements, which depend on tissue contrast between gray matter (GM), white matter and cerebrospinal fluid on T1-weighted (T1w) images, may decrease with decreases in CBF because blood and GM are not distinguishable in these images. Since the blood T1 is higher than that of GM2, decreases in CBF are expected to lead to local decreases in GM in quantitative T1 (qT1) maps. To the best of our knowledge, no study has yet been performed to assess the effect of caffeine ingestion, in the form of a coffee drink, on these structural measures. This study aims to uncover whether caffeinated coffee is a potential confound in studies relying on quantitative T1 maps, and estimates of GMV and CT.Methods
Scans: Eleven consenting coffee-drinking adults (6M, 25 ± 2 years) were scanned with a 3T scanner (MR750, GE Healthcare) according to institutional REB. Subjects were scanned pre- and post-coffee drink over two days: caffeinated coffee (~270mg caffeine) on Day1, and decaffeinated coffee (~25mg caffeine) on Day2, randomized (Day1 not always before Day2) for all subjects. Participants were instructed to abstain from caffeine consumption for at least 12-hours prior to their first scan on each day, in keeping with previous studies4,5. Caffeinated and decaffeinated coffee were included to improve ecological validity, and to account for drug expectancy effects. MRI scans included: a structural T1w scan (GE BRAVO) for volumetric analysis, four scans (2×fSPGR + 2×FSE) for a variable-flip angle (VFA) calibrated method for T16 and B17 mapping, and a pseudo-continuous Arterial Spin Labelling (pCASL) stock sequence for measurement of CBF (Fig.3B for scanning parameters).Image processing: T1w images were processed with FreeSurfer (Martinos Center for Biomedical Imaging, 2021) using the command “recon-all” with “GNU 'parallel'” for parallel processing. CBF and qT1 maps were processed using FSL (FMRIB Software Library) for registrations (Fig.1) (The MathWorks Inc., Natick,MA). Caffeine-induced changes in CBF, qT1 and GMV were assessed bilaterally, in 5 GM regions of interest (ROIs): caudate, putamen, pallidum, thalamus and whole cortex. Bi-lateral mean CT values were also assessed. A repeated measures ANOVA (rmANOVA) was performed including effects for day (caffeinated vs decaffeinated coffee) and day × ROI interactions.
Results
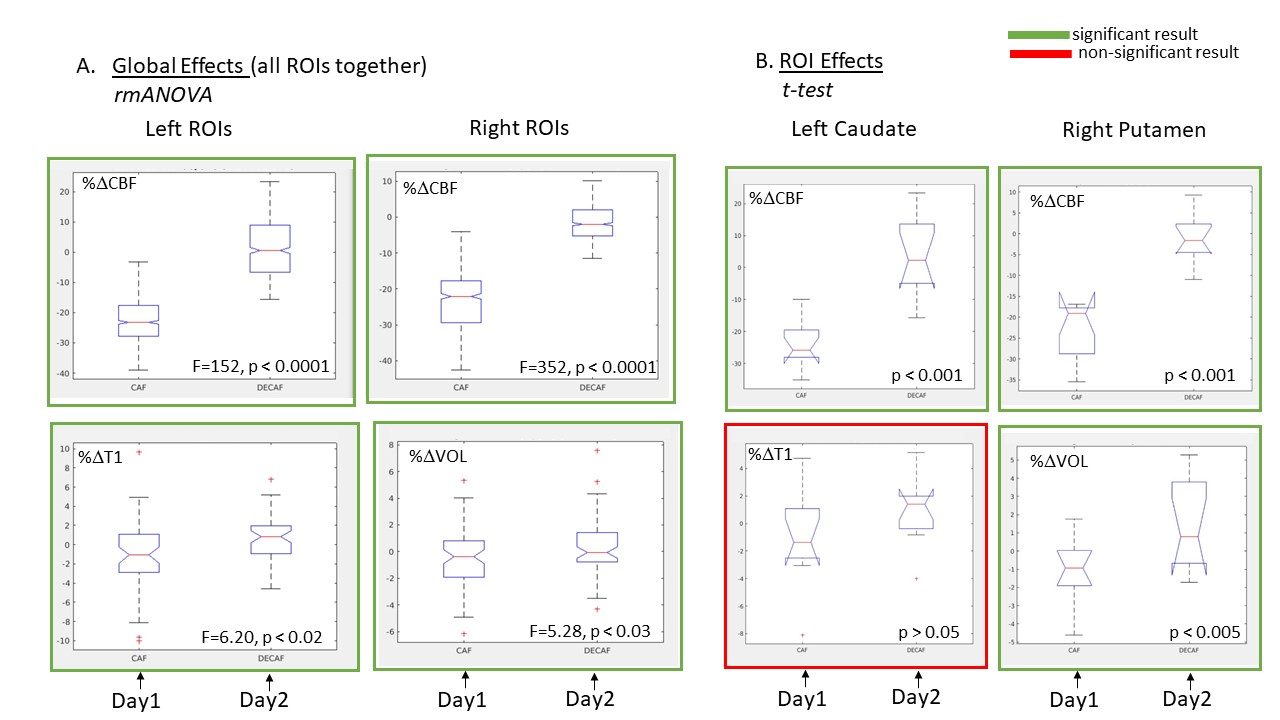
Whole brain: maps showing %ΔCBF values $$$(%Δ=((post-pre)/pre)×100%)$$$ were computed for all subjects, on Day1 and Day2 (example shown in Fig.4A for the 2 extreme subjects). In all cases, %ΔCBF was globally negative on Day1 compared to Day2, indicating a visible reduction in CBF due to caffeine, on a single subject basis. Effects on T1 were less obvious on a single subject %ΔT1 maps.ROI: A rmANOVA was performed on the %Δ values (for each ROI and subject) to isolate the effects induced by the coffee drink alone. For CBF, we found group-level effects of day (Day1 vs Day2) in both hemispheres (F-Left=152,F-Right=352, p < 0.0001) with no day×ROI interactions. For T1, significant group-level effects of day are observed only on the left side (F=6.20,p<0.02). In contrast, for GMV+meanCT, group-level effects of day are observed only on the right side (F=5.28,p<0.03). Boxplots were created to show these global effects across days, for all ROIs and all subjects (see Fig.5A). Post-hoc analyses using t-tests to assess differences across days in individual ROIs revealed significant effects for GMV+meanCT in the Right-Putamen and no significant effects at the ROI level for T1. However, most ROIs for T1 had %ΔT1 smaller on Day1 (caf) than Day2 (decaf) (see example in Fig.5B) consistent with our hypothesis. No significant correlations are observed for subject-specific changes in T1 and changes in CBF across ROIs (data not shown).
Discussion
We found large, global decrease in CBF when subjects drank caffeinated coffee only. We observed global effects of caffeinated coffee on T1 maps and GMV+meanCT but results were significant on a single hemisphere (opposite ones) for each. This laterality of T1 effects, on the left, has been observed in a previous hydrations study8 and warrants further investigation. At the ROI level, all CBF effects were significant but only one other ROI was significant for GMV+meanCT. Our lack of strong effects at an ROI level for T1 and GMV+meanCT may be due to 2 factors: (i) small sample (n=11), and (ii) we used large cortical ROIs so highly localized effects may be averaged out. Future work is underway to collect more data and to look into cortical subdivisions.Conclusion
Our preliminary results show that acute caffeine administration, through a coffee drink, induces significant CBF decreases that have the potential to introduce local changes in T1w images and quantitative T1 parametric maps. Caffeine intake should be considered in studies relying on structural and quantitative MRI measures.Acknowledgements
NSERC Discovery grant RGPIN-2018-05069References
1. Fulgoni VL, Keast DR, Lieberman HR. Trends in intake and sources of caffeine in the diets of US adults: 2001-2010. Am J Clin Nutr. 2015 May;101(5):1081-7.
2. Addicott, M.A., Yang, L.L., Peiffer, A.M., Burnett, L.R., Burdette, J.H., Chen, M.Y., Hayasaka, S., Kraft, R.A., Maldjian, J.A. and Laurienti, P.J. (2009), The effect of daily caffeine use on cerebral blood flow: How much caffeine can we tolerate?. Hum. Brain Mapp., 30: 3102-3114.
3. Franklin, T.R., Wang, Z., Shin, J. et al. A VBM study demonstrating ‘apparent’ effects of a single dose of medication on T1-weighted MRIs. Brain Struct Funct 218, 97–104 (2013).
4. Tardif CL, Steele CJ, Lampe L, Bazin PL, Ragert P, Villringer A, Gauthier CJ. Investigation of the confounding effects of vasculature and metabolism on computational anatomy studies. Neuroimage. 2017 Apr 1;149:233-243.
5. Vidyasagar R, Greyling A, Draijer R, Corfield DR, Parkes LM. The effect of black tea and caffeine on regional cerebral blood flow measured with arterial spin labeling. J Cereb Blood Flow Metab. 2013 Jun;33(6):963-8.
6. Chavez S. Calibrating variable flip angle (VFA)-based T1 maps: when and why a simple scaling factor is justified. International Society of Magnetic Resonance in Medicine (ISMRM). Paris, France; 2018. p. 537.
7. Desmond KL, Xu R, Sun Y, Chavez S. A practical method for post-acquisition reduction of bias in fast, whole-brain B1-maps. Magn Reson Imaging. 2021 Apr;77:88-98.
8. Chavez, S. (2017). Detecting regional changes in brian tissue quantitative T1 values due to hydration status. International Society for Magnetic Resonance Medicine, Annual General Meeting 2017. 1101
Figures
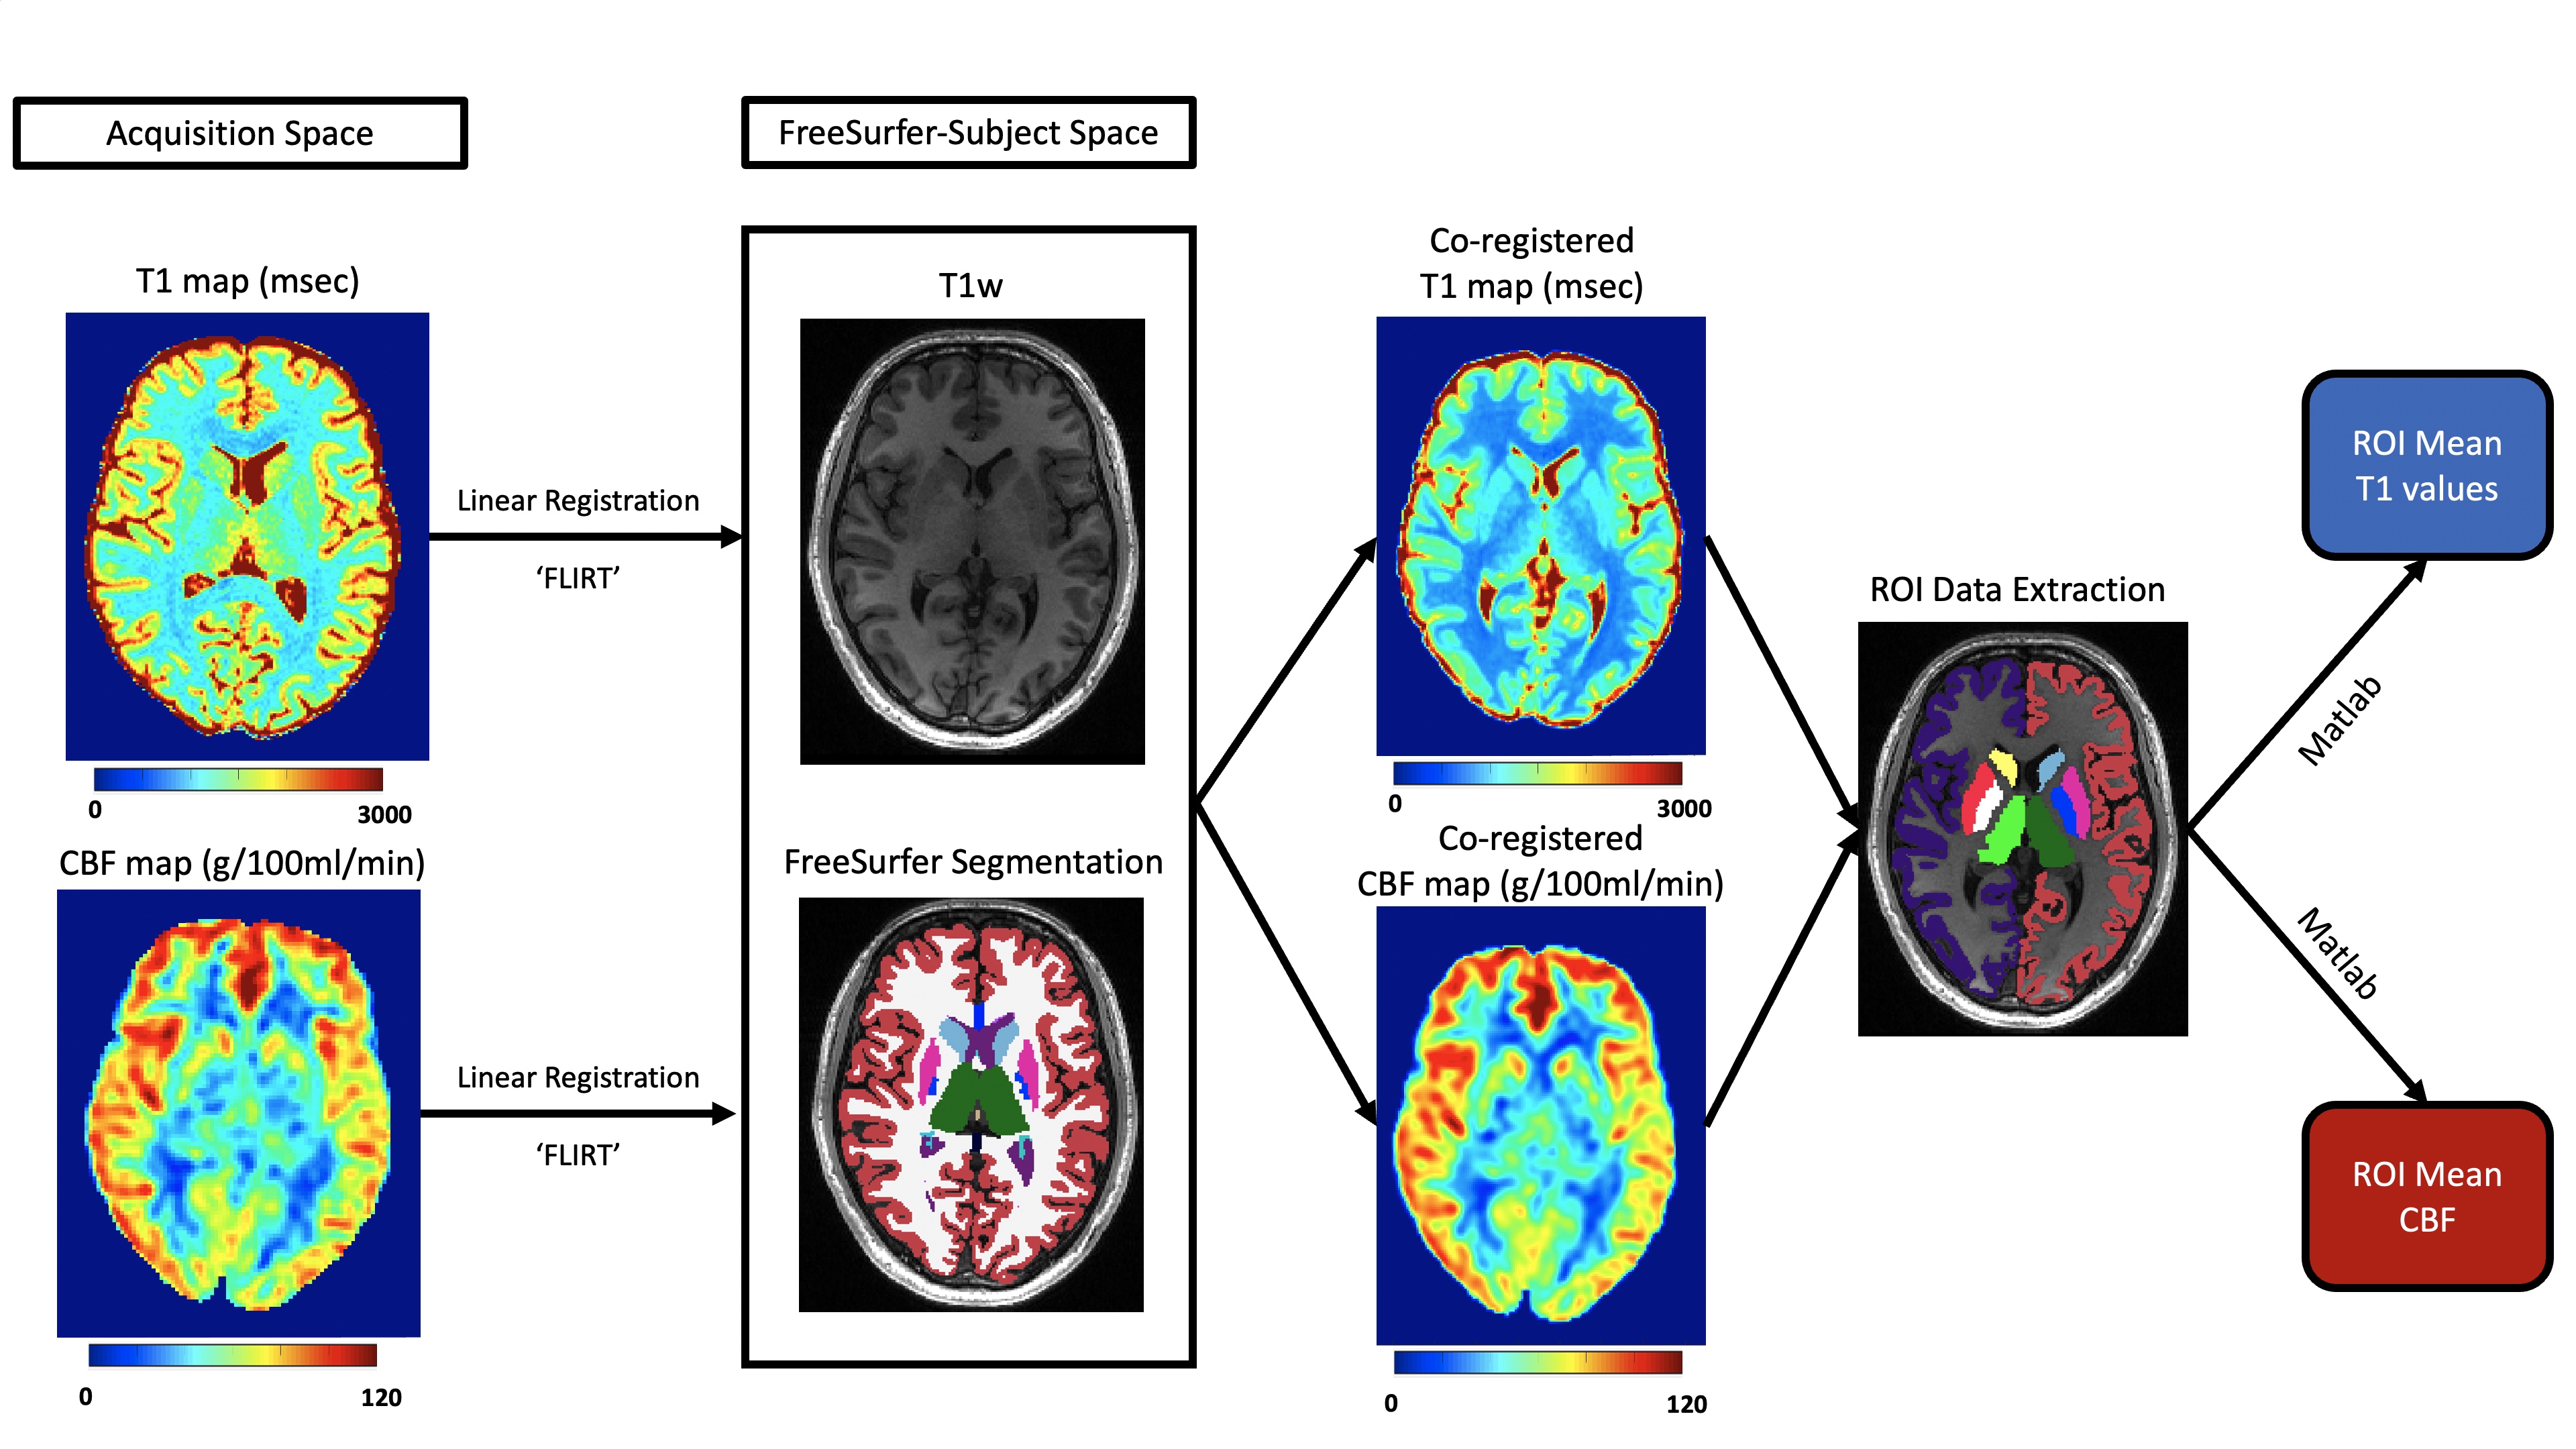
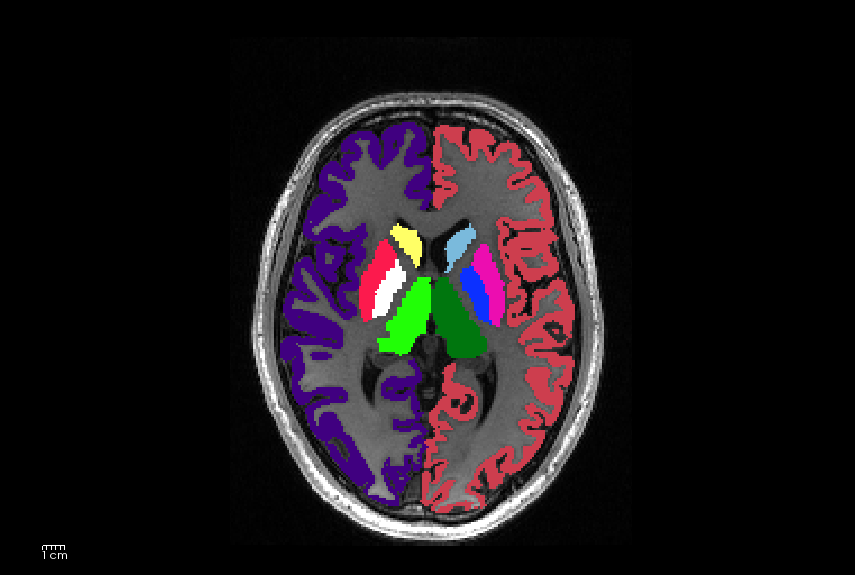
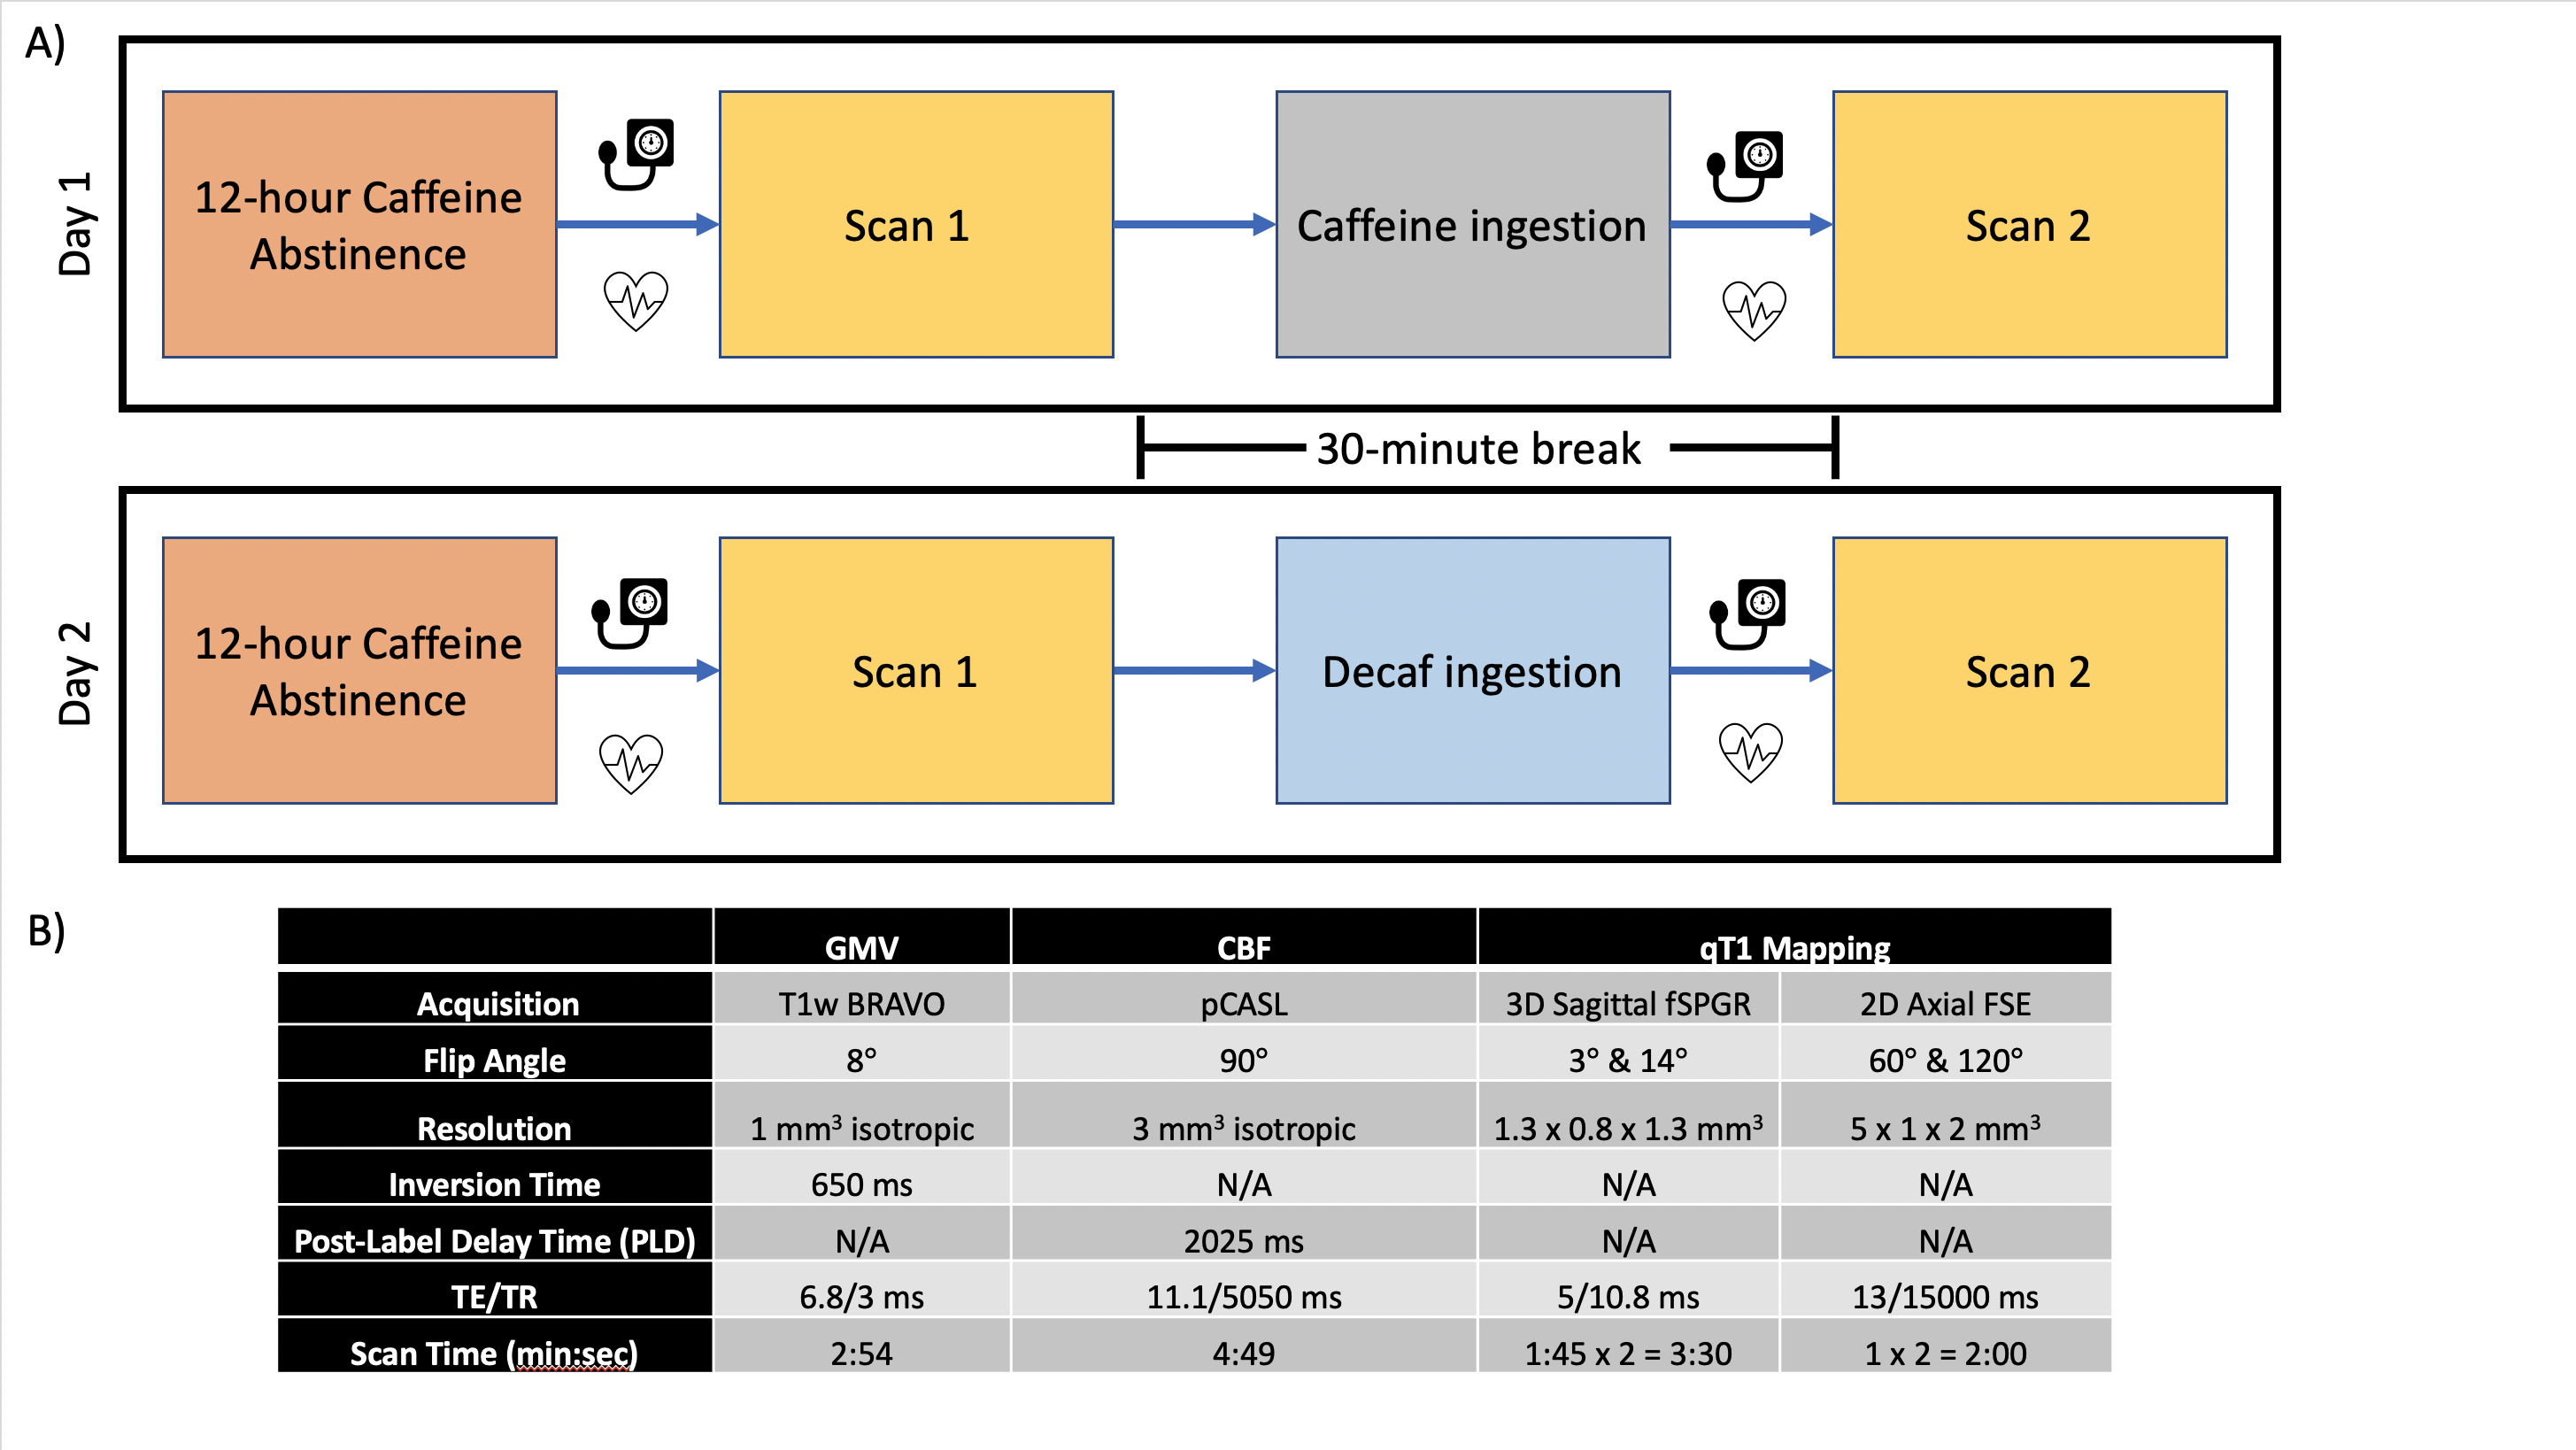
Fig3. A) Participants were scanned pre- and post- coffee beverage over two separate days, after having abstained from caffeine for 12 hours. Participants were given either caffeinated or decaffeinated coffee in a 30-minute break between their pre- and post- beverage scans.
B) Acquisition parameters for structural T1w images (used for GMV estimates), ASL (for CBF quantification) and T1 mapping. Our standard T1 mapping protocol includes a dual flip-angle fSPGR as well as a double-angle FSE method for B1 mapping.
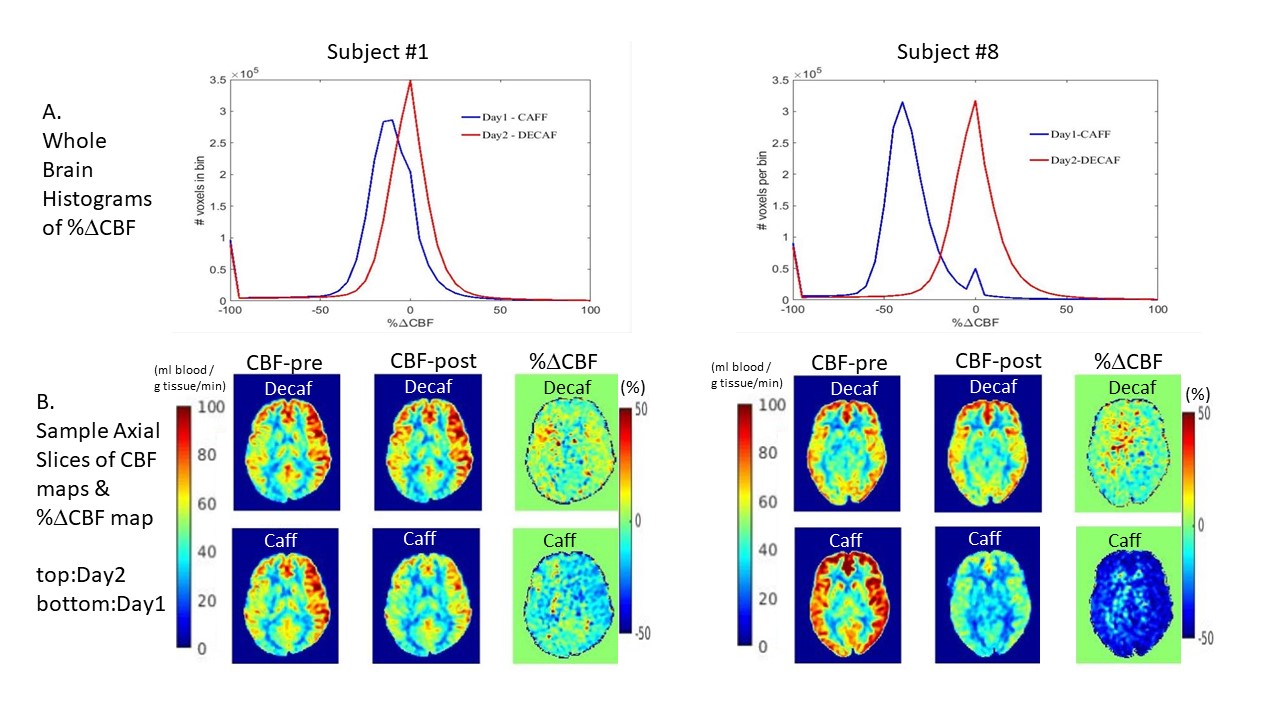
Fig4. CBF effects of caffeinated vs decaf coffee. A) The lowest effect was observed for Subject #1: mean %ΔCBF was -15.61% after caffeinated coffee vs -6.76% for decaf. Subject #8 had the highest effect: mean %ΔCBF was -38.5% after caffeinated coffee & -5.85% for decaf. Whole brain histograms of %ΔCBF after caffeinated vs decaffeinated coffee vary between subjects - though decreases in CBF are reliably observed after caffeinated vs decaffeinated coffee. B) Images of %ΔCBF in subject #1 and #8 after decaffeinated (top) and caffeinated coffee (bottom).