2734
Evaluation of brain volumetric changes and alterations in T1 relaxation times in American football players using 7 Tesla MRI1Erwin L. Hahn Institute for MRI, University Duisburg-Essen, Essen, Germany, 2Dept. of Diagnostic and Interventional Radiology and Neuroradiology, University Hospital Essen, University Duisburg-Essen, Essen, Germany, 3Chair of Geriatric Medicine, University Duisburg-Essen, Essen, Germany, 4Institute for Health Services Research and Clinical Epidemiology, Philipps University Marburg, Marburg, Germany, 5Westphalian University of Applied Sciences, Gelsenkirchen, Germany, 6University of Applied Sciences Ruhr West, Mülheim, Germany, 7High-Field and Hybrid MR Imaging, University Hospital Essen, University Duisburg-Essen, Essen, Germany
Synopsis
American football players were examined before and after a season of the German Football League. High resolution quantitative MRI at 7T for evaluations of volumetric changes and alterations in T1 relaxation times of various brain regions was performed. Age- and gender-matched subjects with no history of contact and collision sports served as a control group. In addition, structural susceptibility weighted imaging was compared between 3T and 7T. Loss of gray matter volume and an overall increase in T1 relaxation times were observed in players between both scans. SWI was superior in detecting cerebral microbleeds at 7T compared to 3T.
Introduction
American football players (AFP) experience repetitive brain trauma during their career. While such concussions cause temporal functional disorders of the brain, a variety of concussions can also lead to long-term functional and structural changes in the brain. Subclinical concussions may also cause chronic traumatic encephalopathy (CTE), which is a suspected neurodegenerative disease diagnosed in the brains of former contact and collision athletes. Structural changes in AFP brains, such as the loss of white matter integrity can already be demonstrated after a football season, and in players with mild skull brain contusions. The level of Tau protein in blood can be determined as a potential biomarker for diffuse axonal injury and blood-brain barrier interruptions, as it correlates with the loss of white matter integrity [1]. Cerebral microbleeds (CM) are a typical finding of repetitive brain trauma and diffuse axonal injury and show a frequency of about 9% in retired AFP [2]. However, only a limited number of studies are available on this topic. In recent studies, ultrahigh field MRI not only proved a better detectability of CM in patients with diffuse axonal injury at 7T compared to 3T [3], but also showed high reproducibility in high resolution quantitative MRI in a multi-center study [4].Methods
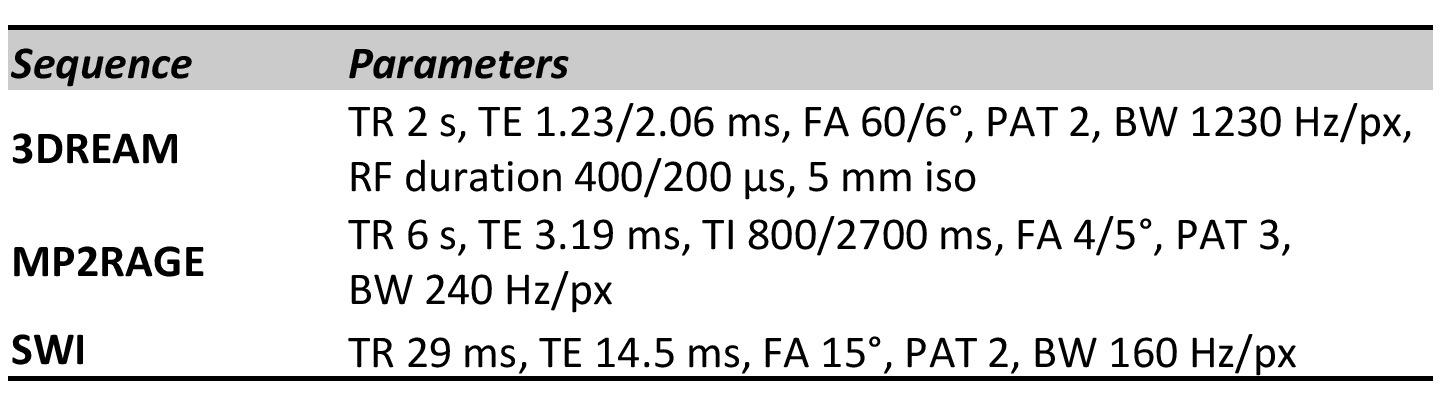
A total of 17 male AFP (ages: 18-33 years) were examined before and after a season of the German Football League. A second cohort of 18 gender- and age-matched subjects with no history of contact and collision sports served as a control group. MRI of the brain was performed at 3T (MAGNETOM Skyra, Siemens Healthcare GmbH, Germany) and at 7T (MAGNETOM 7T, Siemens) using an established protocol. At 7T whole-brain MP2RAGE [5] datasets with 0.6 mm isotropic resolution were acquired within 14:50 minutes. The combined uniform images and T1 maps were additionally corrected for transmit B1 inhomogeneity using 3DREAM B1 maps [6]. Different brain sub-volumes were extracted for further analysis as described in [4]. To correct for systematic fluctuations in repetitive scans, sub-volumes were normalized to the individual whole-brain volume of each subject. Similar, T1 values were normalized to the T1 value of CSF obtained in each subject. For qualitative structural evaluations, a clinically established susceptibility weighted imaging (SWI) sequence with high in-plane resolution of 0.3 x 0.3 mm2 was obtained in an acquisition time of 13:34 minutes for 104 slices of 1.5 mm each. Image analyses were performed by two neuroradiologists in consensus reading for number of CM and additional findings as well as in comparison to 3T MRI. Details of the 7T MR imaging protocol are provided in Figure 1.Results
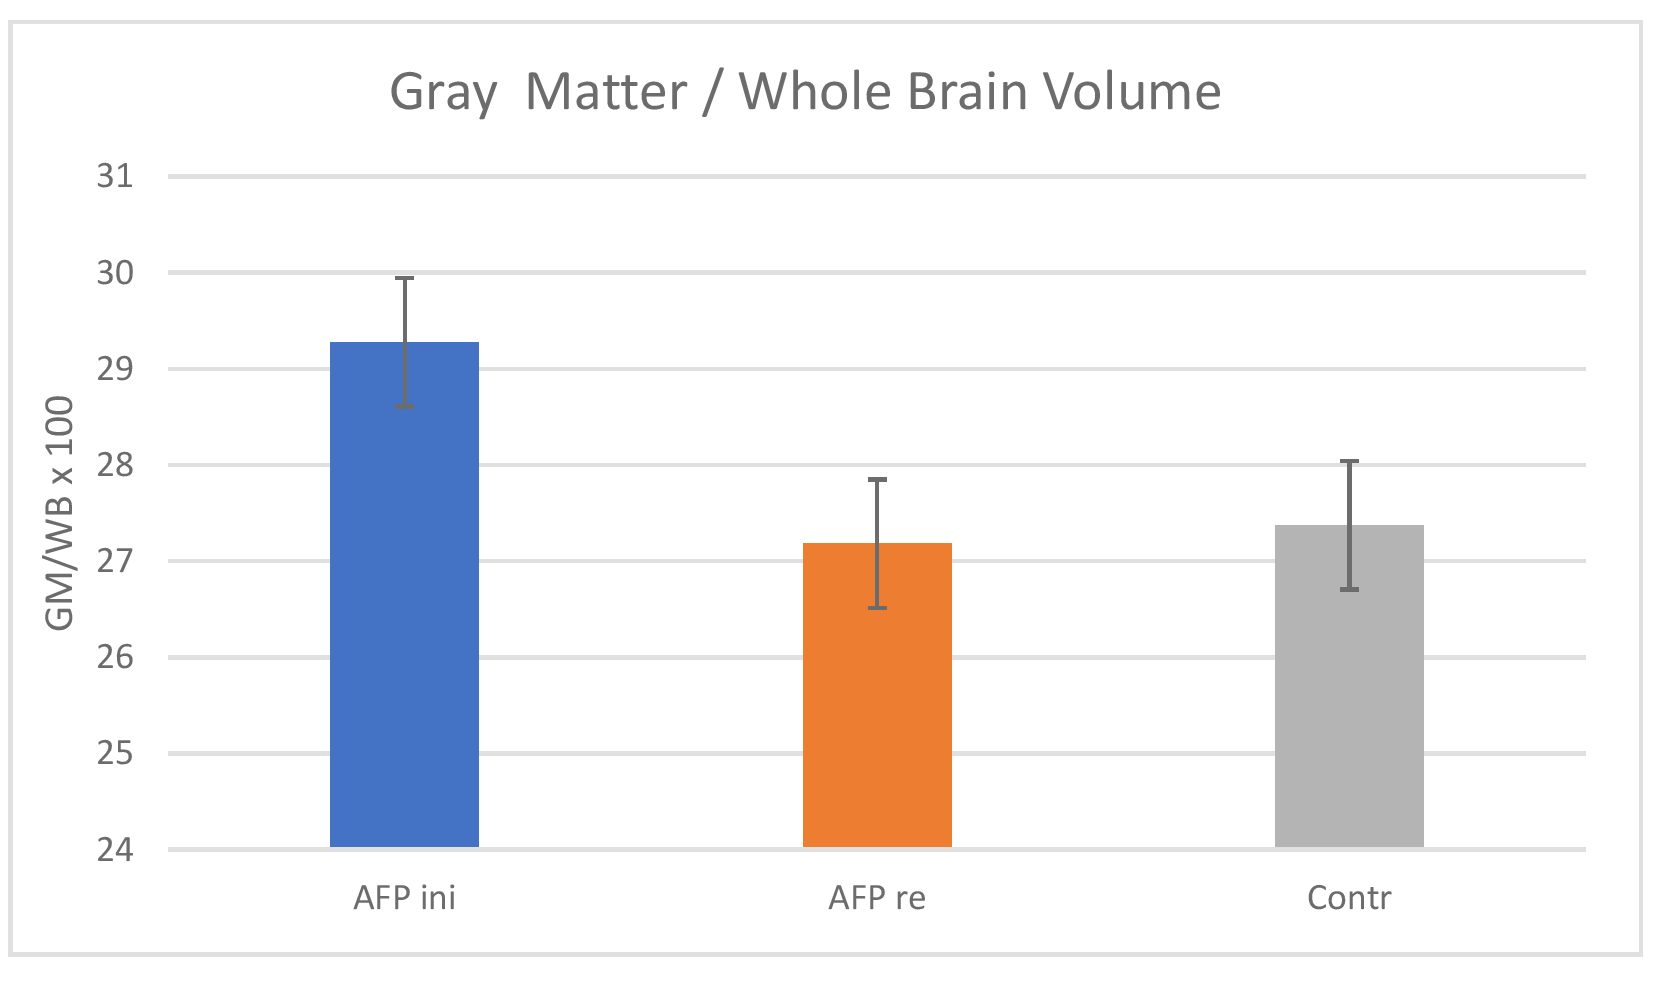
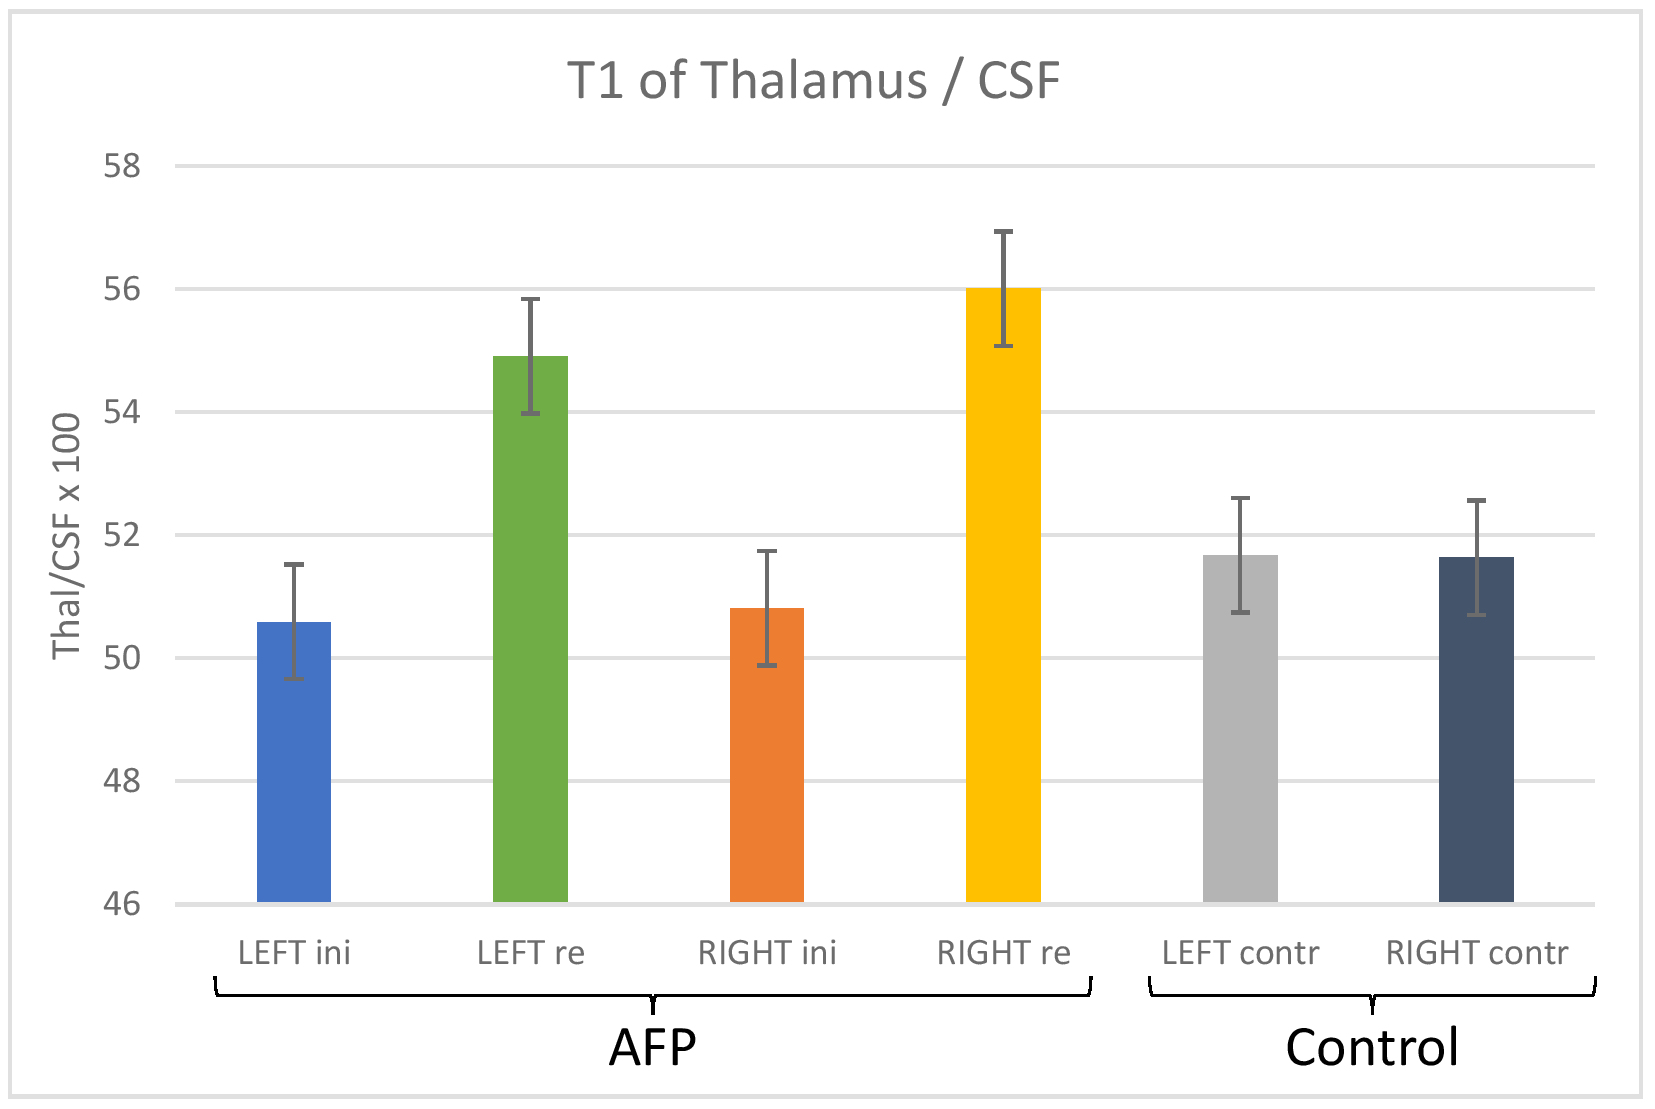
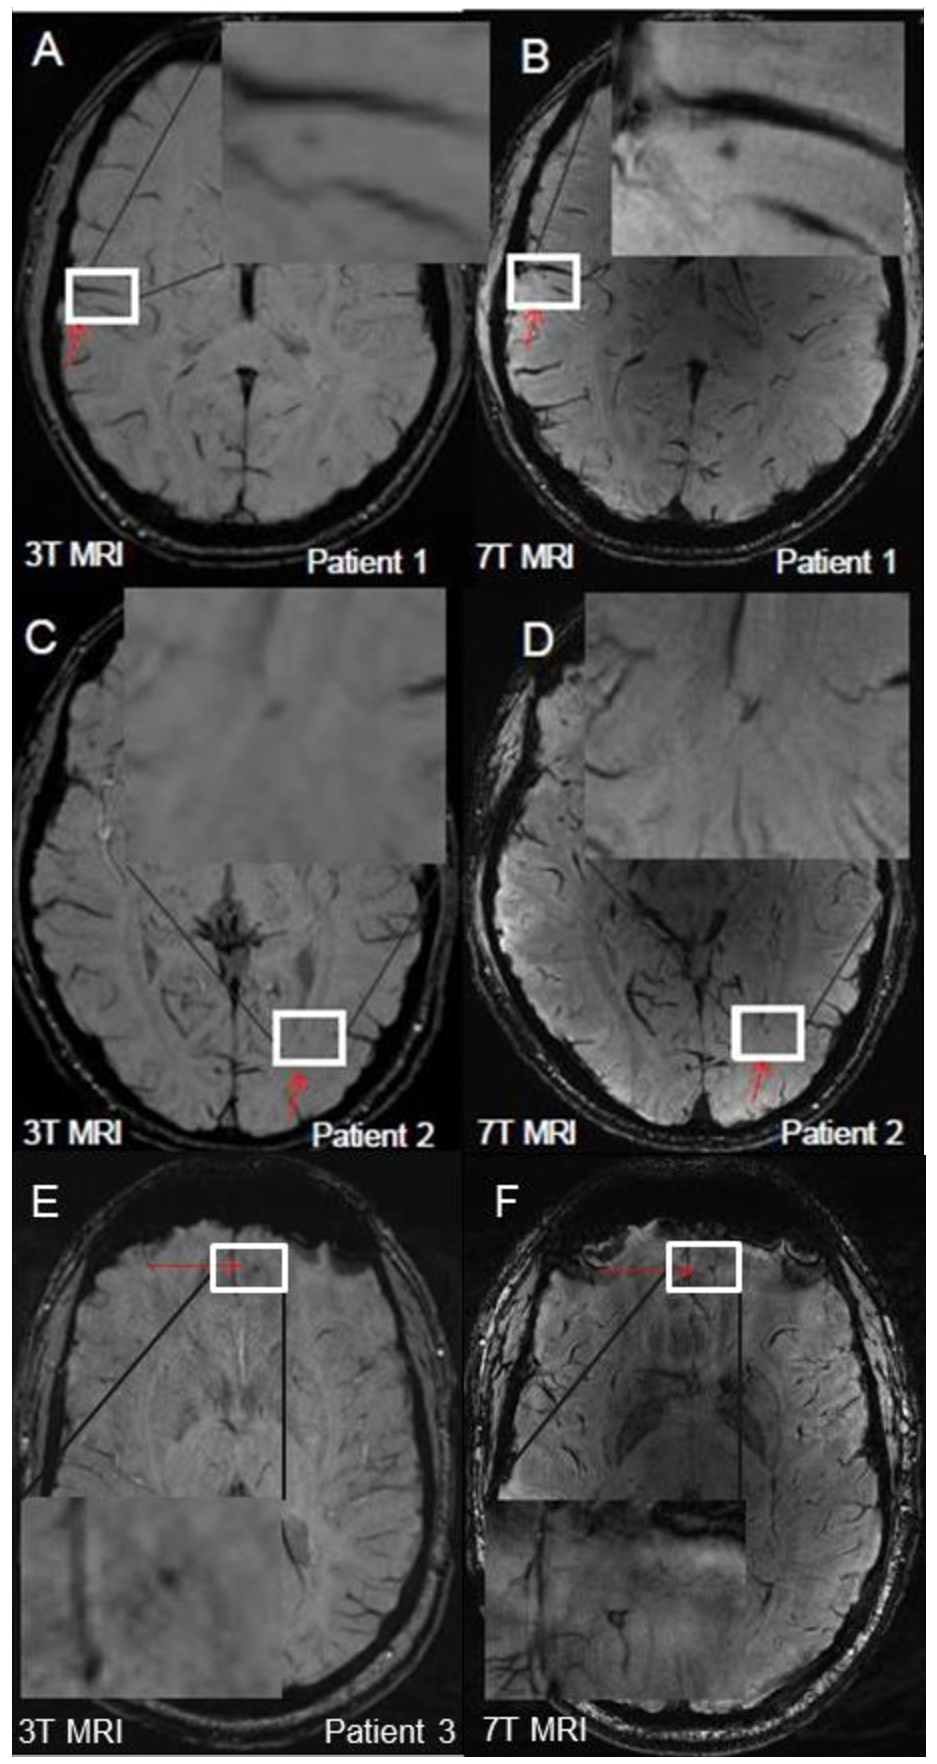
Only brainstem and cerebellum showed a slight increase by 1-2% in mean volume between the two scans before and after season in AFP, while other sub-volumes decreased by this amount on average. Notably, the percentage deviation of gray matter volume decreased by 7.7% in AFP over the season. However, no significant deviations between AFP and control subjects were observed in the volumetric evaluations. Regarding T1 all AFP brain sub-volumes showed an increase in relaxation times between the two scans, and in comparison between AFP rescans and controls. Only cerebellum remained constant. In AFP the mean T1 values of white matter and gray matter increased by 1.5% and 2.6%, respectively. Other brain regions showed larger alterations, i.e., between 5% and 7% for putamen, pallidus, hippocampus, and caudate, as well as between 7% and 9% between amygdala, thalamus, accumbens, and brainstem. Exemplary comparisons are given in Figure 2 and 3. In the structural SWI readings a total of 10 CM were identified in five AFP at 3T MRI (Figure 4A). 7T MRI confirmed CM in three of these AFP (Fig. 4B). Moreover, eight smaller CM were additionally detected. The other two suspected CM at 3T in the other two AFP (Fig. 4C) were identified at 7T as atypical small intracerebral veins (Fig. 4D). As an additional finding a developmental venous anomaly (DVA) was found in one the AFP, which was well delineated in both 3T and 7T, whereas at 7T a more exact architecture of the DVA was definable. In the post-season evaluations the number of CM remained constant.Discussion
Loss in gray matter volume and overall increases in T1 relaxation times were the predominant findings in the quantitative evaluations of the repetitive scans in AFP and in comparison to controls. Neuroinflammation induced by repeated concussions over the season could be an attempt for explanation as similar observations were made in other studies that investigated gray matter atrophy and microglial activation [7]. However, a major limitation of the presented study is that no rescans were obtained in the control group to further strengthen the significance of the results. Hence, further studies are needed. For the assessment of qualitative imaging 7T SWI improved the depiction of CM. Moreover, 7T SWI allowed a more accurate differentiation of lesions that were described as CM at 3T but were then identified as atypical venous blood vessels at 7T SWI. This is in line with previous studies [3] and could additionally help to understand pathophysiological processes in repetitive brain trauma.Acknowledgements
No acknowledgement found.References
[1] Hirad AA, et al. A common neural signature of brain injury in concussion and subconcussion. Sci Adv. 2019; 5(8):eaau3460.
[2] Casson IR, et al. Is There Chronic Brain Damage in Retired NFL Players? Neuroradiology, Neuropsychology, and Neurology Examinations of 45 Retired Players. Sports Health. 2014; 6(5):384-95.
[3] Moenninghoff C, et al. Diffuse axonal injury at ultra-high field MRI. PLoS One. 2015; 10(3):e0122329.
[4] Voelker MN, et al. The traveling heads 2.0: Multicenter reproducibility of quantitative imaging methods at 7 Tesla. Neuroimage. 2021; 232:117910.
[5] Marques JP, et al. MP2RAGE, a self bias-field corrected sequence for improved segmentation and T1-mapping at high field. Neuroimage. 2010; 49(2):1271-81.
[6] Ehses P, et al. Whole-brain B1 -mapping using three-dimensional DREAM. Magn Reson Med. 2019; 82(3):924-934.
[7] Nicastro N, et al. Gray matter changes related to microglial activation in Alzheimer's disease. Neurobiol Aging. 2020;94:236-242.
Figures