2728
MR-visibility and relaxation properties of 3-D printed FDM polymers
Teemu Tuomainen1, Antti Paajanen1, and Mikko J. Nissi1,2
1Department of Applied Physics, University of Eastern Finland, Kuopio, Finland, 2Research Unit of Medical Imaging, Physics and Technology, University of Oulu, Oulu, Finland
1Department of Applied Physics, University of Eastern Finland, Kuopio, Finland, 2Research Unit of Medical Imaging, Physics and Technology, University of Oulu, Oulu, Finland
Synopsis
Increasing availability and affordability of 3-D printers utilizing fused deposition modeling (FDM) have enabled their widespread use especially in pre-clinical MRI, allowing in-house design and manufacturing of elaborate coil housings, animal holders, sample holders, etc. Here, we investigated ten common and broadly available FDM polymers for their MRI-visibility at 9.4T. We utilized ultra-short echo time imaging sequences, specifically, single-point-imaging (SPI) and multi-band SWIFT to measure the relaxation properties of the different polymers. The findings support the selection of appropriate printing materials when either visibility or invisibility for ultra-short echo time imaging is required.
Introduction
In pre-clinical MRI, custom coil housings, animal holders or sample holders are frequently needed for in-house developed RF-coils, to restrict/control animal motion or sample movement, or to allow easy identification and placement/orientation of multiple samples in a specific manner. Recent increase in popularity and availability of affordable 3-D printers, utilizing fused deposition modeling (FDM), i.e. filament printing, have brought an abundance of design possibilities to MRI researchers, allowing rapid in-house design and manufacturing of various plastic components.Solid materials, such as plastics, produce limited MRI signal with typical acquisition schemes; however, ultra-short echo time (UTE) imaging sequences, such as ZTE, UTE and SWIFT1 are able to acquire signal from short $$$T_2^*$$$ materials. The ability to detect nearly all signal can also produce challenges in the form of accentuated artifacts. In some cases, MR-invisible materials may be preferred to limit artifacts while e.g. MR-visible sample holders can be used to identify samples. In this work, the MR-visibility and relaxation properties of ten common 3-D printing polymers were investigated using ultra-short echo time imaging sequences.
Methods
Ten disks (16 mm diameter, 2 mm height, 4 mm hole) were manufactured with a Prusa MK2S 3-D printer, using different FDM polymers: PLA-natural, Nylon 1 (Taulman 618), PETG, M3D Tough, PC-plus, ASA, Nylon 2 (Taulman 645), HIPS, ABS and PolyMax PLA. The disks were identified with radial notches and were stacked on a silicone tube and placed inside a PTFE holder.MR imaging was conducted using a 9.4T scanner (Varian/Agilent, VnmrJ3.1) and a 20 mm 1H RF coil (Rapid biomedical). MRI scans were done using MB-SWIFT (multi-band sweep imaging with Fourier transform2) and SPI (single point imaging, “ct3d” sequence). For reference, a fast spin echo (FSE) image was collected (matrix size = 256x128, FOV = 30x30 mm2, slice thickness = 3 mm, TE = 4.26 ms, TR = 5 s). With MB-SWIFT, inversion recovery and saturation recovery Look-Locker methods (IR-LL and SR-LL) were used for the measurement of $$$T_1$$$ relaxation3. The sequence used a flip angle α=1°, bandwidth of 384 kHz, TR of 3 ms, 128 radial points/spoke and an adiabatic inversion or saturation pulse of 6 ms after every 2048 or 1024 spokes, respectively. A total of 1M spokes were collected for both measurements, producing 512 or 1024 samples of the Look-Locker curve. Additionally, plain MB-SWIFT image was acquired with otherwise the same sequence, but without saturation pulses and using a 4° flip angle and 262k spokes. With SPI, 7 echo times from 50 to 800 µs, a matrix size of 643 and FOV of 32x32x32 mm3 were used to measure $$$T_2^*$$$ relaxation time.
MB-SWIFT data was reconstructed with NUFFT4 using MATLAB (R2019b, MathWorks Inc., Natick, MA). The recovery curves were reconstructed to 16 individual images of 2563 by binning the spokes appropriately over the entire acquisition. From the IR-LL and SR-LL images, the $$$T_1$$$ was estimated (with fminsearch in MATLAB) by using three-parameter fitting with5
$$ S(t) = A - B\mathrm{exp}(-\frac{t}{T_1^*}),$$
where $$$t$$$ refers to the reconstructed time points in the relaxation curves. From the obtained apparent $$$T_1^*$$$, the real $$$T_1$$$ was then calculated using3,6,7
$$ T_1 = (1/T_1^* - \mathrm{ln(cos}(\alpha))/TR)^{-1}. $$
From the SPI with variable echo times, $$$T_2^*$$$ fitting was conducted using
$$S(t) = S_0 \mathrm{exp}(-\frac{t}{T_2^*}).$$
Results
Most of the 3-D printed disks could be seen and identified with both the MB-SWIFT and SPI with the shortest echo time (Fig. 1). The average signal intensities of the different polymers were normalized with the signal of the silicone tube. The relative signal intensities of the polymers in MB-SWIFT far exceeded those observed with SPI (Table 1). PLA-natural, Nylon 1 and PETG produced the least signal while M3D Tough produced the most signal. The $$$T_1$$$ relaxation times of the polymers were on the order of 1-2 seconds, while the $$$T_2^*$$$ relaxation times of those polymers that could be measured, ranged from about 70μs to 180μs.Discussion
Materials, such as polycarbonate (PC), polyethylene terephthalate glycol (PETG) and nylon may be invisible in MRI whereas some formulations of polylactic acid (PLA) as well as acrylonitrile styrene acrylate (ASA), acrylonitrile butadiene styrene (ABS), high impact polystyrene (HIPS) and, particularly, the semi-flexible M3D Tough filament8 may be detectable using UTE imaging. Long-$$$T_2$$$ signal preserving saturations, such as off-resonance saturation or 0° (360°) saturation pulses, could be utilized to remove the signal of most of the investigated materials. On the other hand, to achieve MR-visibility of such polymers, care should be taken when considering the imaging parameters and pulse sequences. The relative intensity values provide insight into the MR-visibility of the investigated polymers. Due to off-resonance, blurring of some of the printed discs was observed which should also be considered when choosing the polymers and the imaging sequences. The pure phase encoding scheme of the SPI sequence avoids the blurring and while the relative signal intensities may be more accurate than those obtained with MB-SWIFT, the scan time penalty of SPI is significant.Conclusion
Ultrashort echo time pulse sequences provide possibilities to quantify and image polymer materials invisible with standard MRI. The results presented provide a guide for the selection of the most suitable FDM polymers if MR-visibility or particularly MR-invisibility is required.Acknowledgements
The authors acknowledge the support of the Academy of Finland (grant #325146).References
1. Garwood, M. MRI of fast-relaxing spins. J. Magn. Reson. 229, 49–54 (2013).2. Idiyatullin, D., Corum, C. A. & Garwood, M. Multi-Band-SWIFT. J. Magn. Reson. 251, 19–25 (2015).
3. Zhang, J. et al. Quantifying iron-oxide nanoparticles at high concentration based on longitudinal relaxation using a three-dimensional SWIFT look-locker sequence. Magn. Reson. Med. 71, 1982–1988 (2014).
4. Fessler, J. A. Michigan Image Reconstruction Toolbox (MIRT). University of Michigan https://web.eecs.umich.edu/~fessler/code/ (2021).
5. Deichmann, R. Fast high-resolution T1 mapping of the human brain. Magn. Reson. Med. 54, 20–27 (2005).
6. Jiang, K. et al. Fast T1 mapping of the brain at high field using Look-Locker and fast imaging. Magn. Reson. Imaging 36, 49–55 (2017).
7. Henderson, E., McKinnon, G., Lee, T. Y. & Rutt, B. K. A fast 3D look-locker method for volumetric T1 mapping. Magn. Reson. Imaging 17, 1163–1171 (1999).
8. M3D LLC. Tough 3D Ink ® Material Safety Data Sheet Version 1.0. 1–8 (2018).
Figures
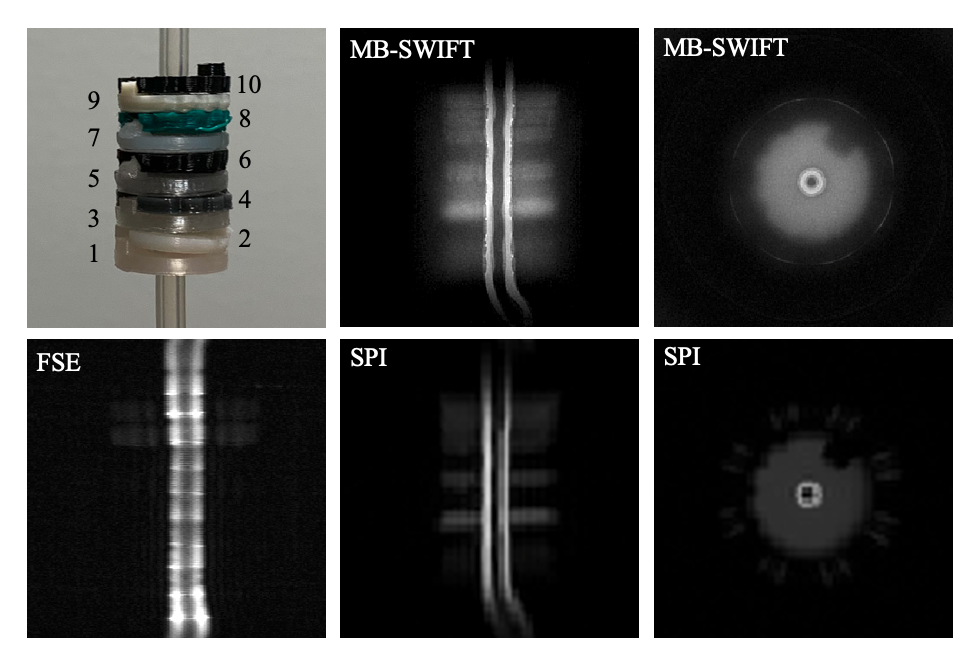
Fig. 1. Measurement setup for the 3-D printed polymer disks. The presented axial slices of a single disk (right) are from the M3D Tough. SPI images were obtained with TE = 50µs. Polymers: 1: PLA-natural, 2: Nylon 1, 3: PETG, 4: M3D Tough, 5: PC-plus, 6: ASA, 7: Nylon 2, 8: HIPS, 9: ABS, 10: PolyMax PLA.
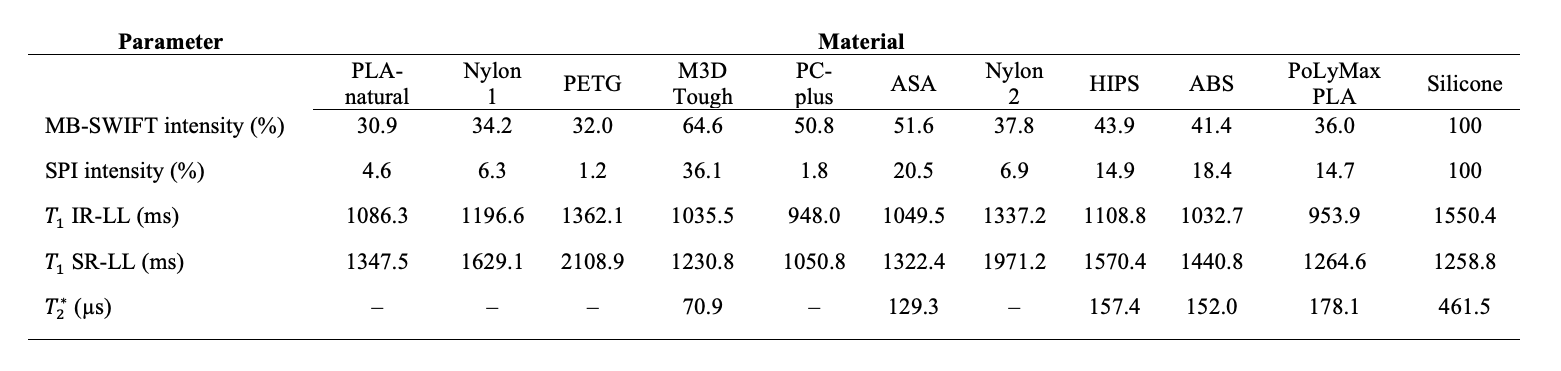
Table 1. Average T1 and T2* relaxation time values and relative signal intensities for the 3-D printed polymer materials at 9.4T. Values not obtained are presented with a dash (–). The signal intensities were obtained from plain MB-SWIFT images or the SPI (TE = 50 µs) images and referenced to the average signal of the silicone tube, respectively. IR-LL indicates inversion recovery Look-Locker and SR-LL saturation recovery Look-Locker.
DOI: https://doi.org/10.58530/2022/2728