2722
Analysis of variability of diffusion tensor imaging measurements using co-electrospun fibre phantom1Centre for Medical Image Computing, University College London, London, United Kingdom, 2School of Pharmacy, University College London, London, United Kingdom, 3Department of Radiology,Shandong Provincial Hospital, Cheeloo College of Medicine, Shandong University, Jinan, China, 4Philips Heathcare, Shanghai, China, 5Bioxydyn Limited, Manchester, United Kingdom
Synopsis
Brain diffusion tensor imaging (DTI) measurements are sensitive to pathological changes, but in order for them to be of greatest use it is vital to understand intra-scanner and inter-scanner variations in DTI metrics. Here we demonstrate a physical phantom with variable pore sizes and fibre orientation that can be used to assess the repeatability and reproducibility of DTI measurements across scanners and protocols and present its application in assessing 9 separate scanner/protocol combinations.
INTRODUCTION
Phantoms are often employed to assess intra- and inter-scanner variability in diffusion MRI measurements1-6. However, most of these phantoms are either anisotropic but solid fibres1 or isotropic solutions2, 3 or traveling volunteers1, 3, 6; melt-spun hollow microfibre phantom involves high temperature and multi-step procedure4, 5. Here we demonstrate a brain white matter phantom comprising one-step co-electrospun (co-ES) microfibres7-9 with variable size and orientation at ambient conditions and assess its potential for evaluating DTI metric variability across scanner/protocols.METHODS
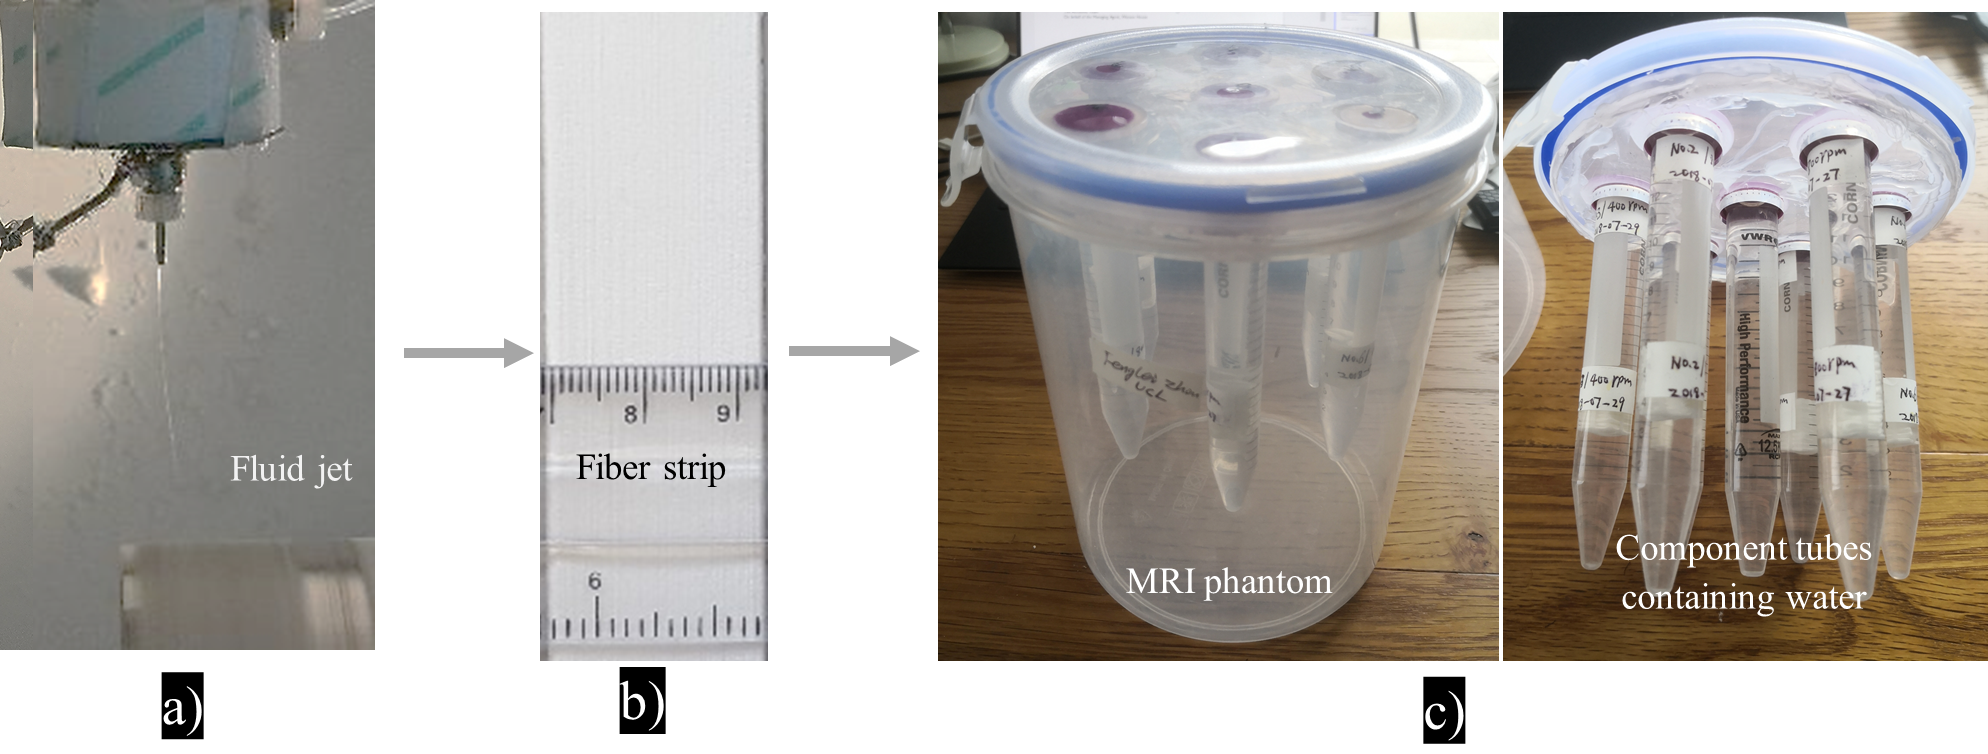
Microstructural characterization and phantom constructionFig.1 shows the construction of the phantom. Three samples of ~0.5 mm fibre strips were fabricated by co-electrospinning, as previously described8, named PCL-PSi-100 (phantom tubes 5&6), PCL-PSi-400 (tubes 3&4) and PCL-PSi-800 (tubes 1&2) after the fibre collecting speed. The pores and fibre orientation of these fibres were quantified via ImageJ based on their SEM images. Phantom design and construction followed same procedure previously reported8.
MR acquisition and analysis
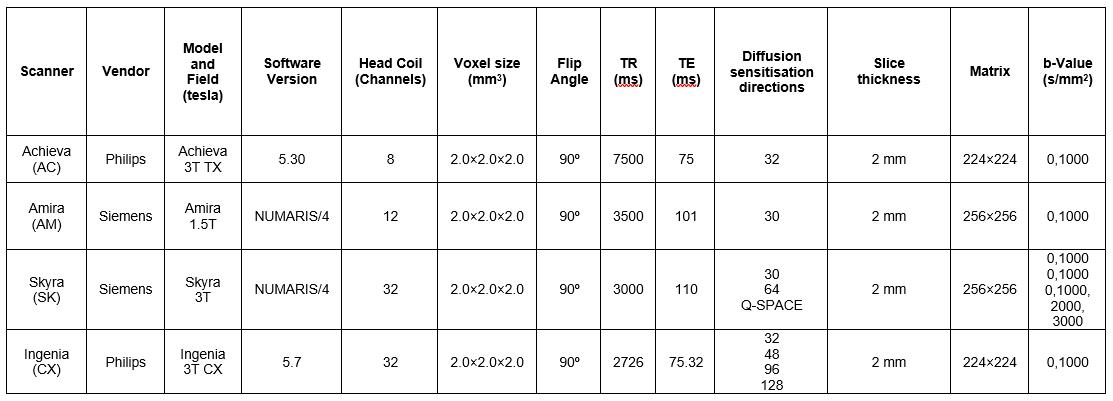
The phantom was scanned twice on 4 scanners across 9 acquisition protocols (as listed in Table 1) under room temperature (RT) and ice-water (IW). Phantom temperature was recorded before and after scanning. The diffusion data from each acquisition site were processed using an ROI approach using DSI Studio (http://dsi-studio.labsolver.org). A circular ROI was placed in the centre slice of each of the 6 tubes, and the mean DTI metrics were determined from 9 voxels. Coefficient of variation (CV) for each DTI metric for each tube across all scanners/protocols and across only protocols was used to assess reproducibility. Repeatability was assessed using inter-scan CV.
RESULTS
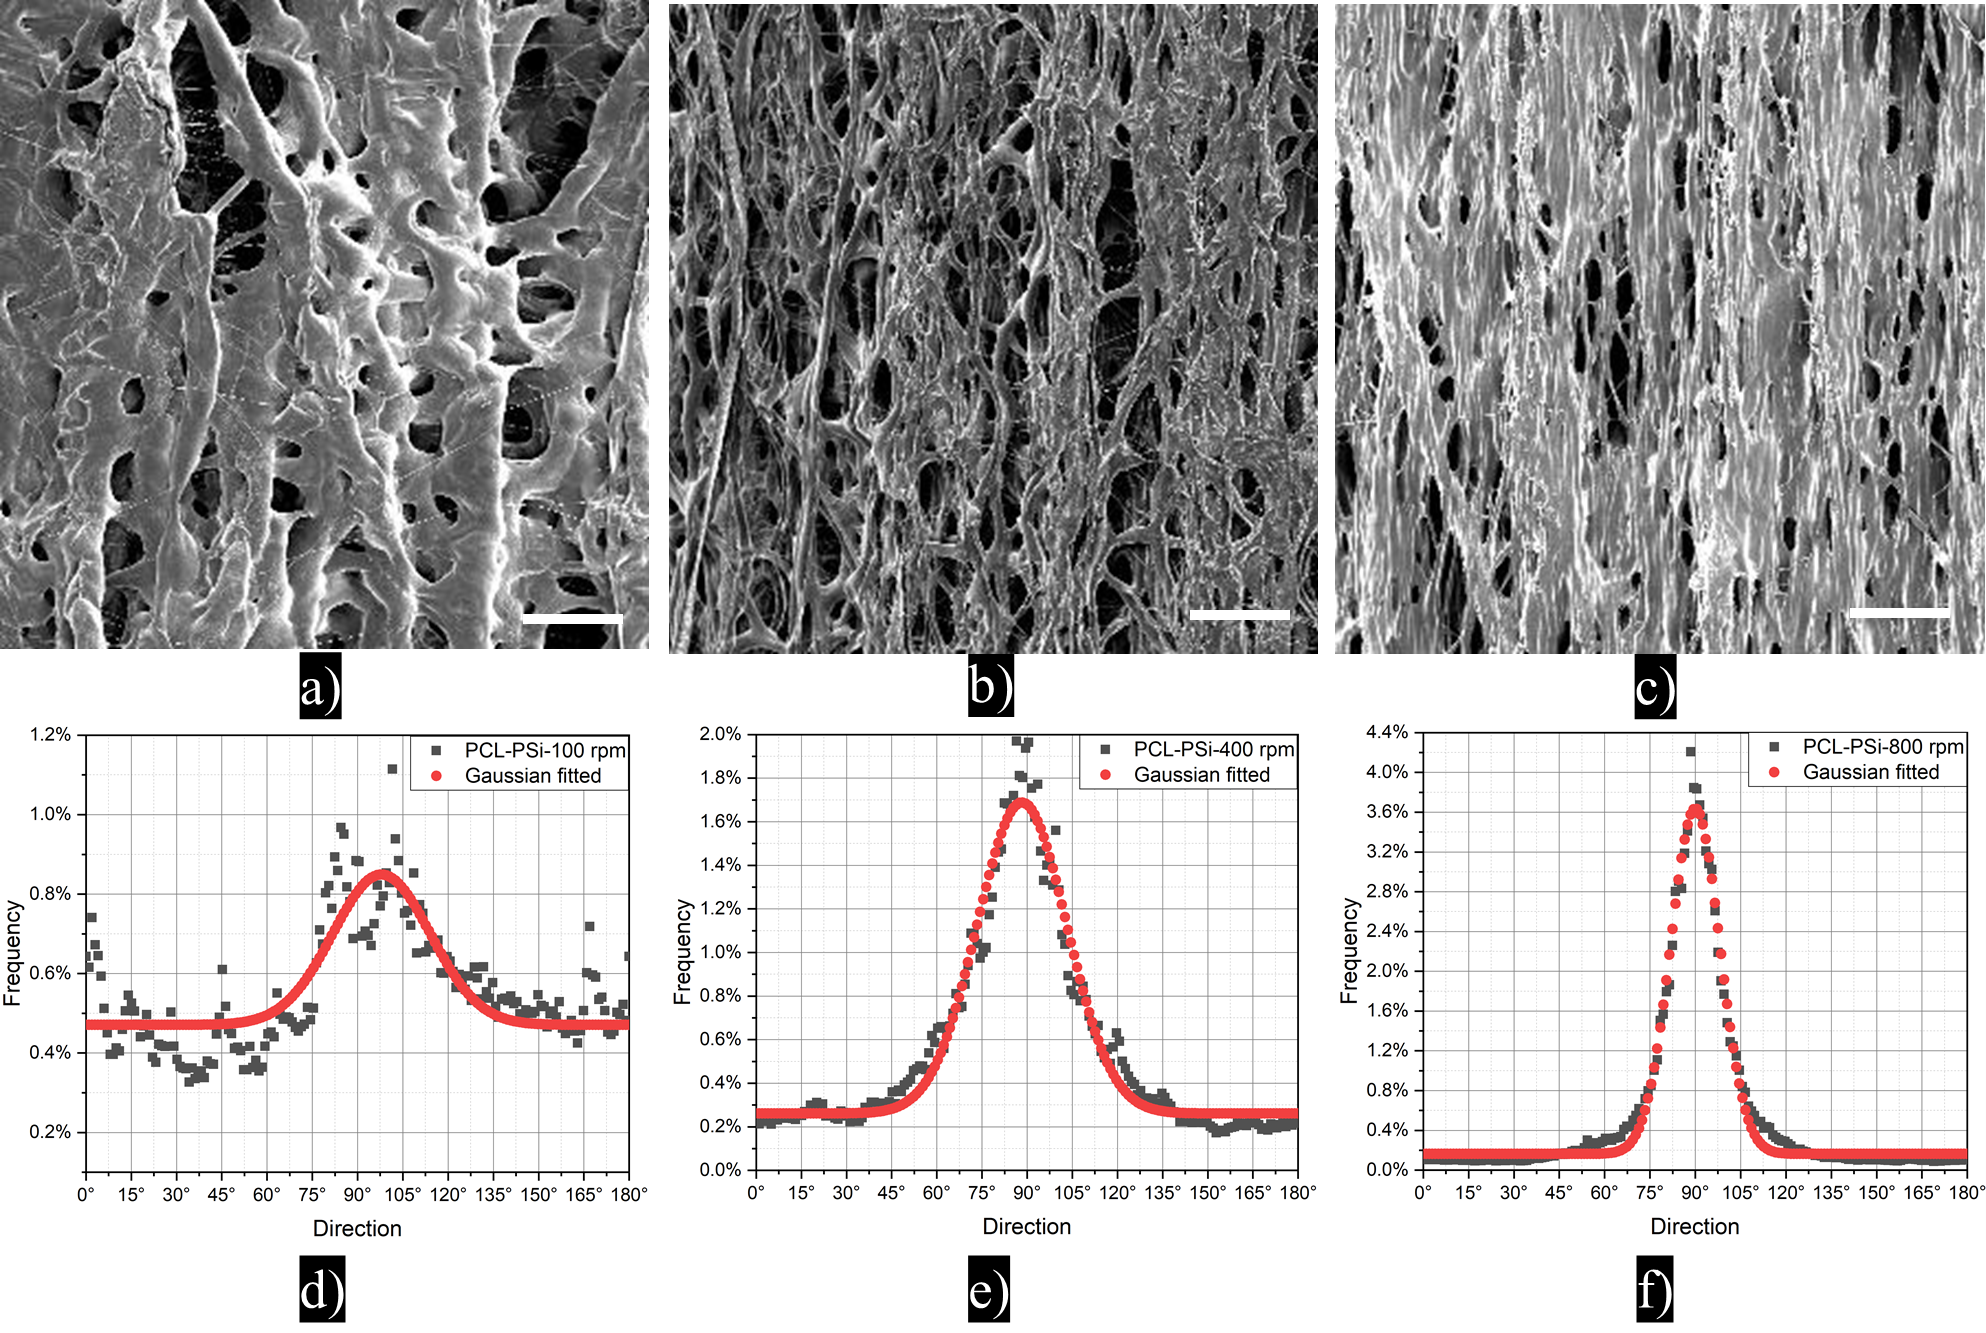
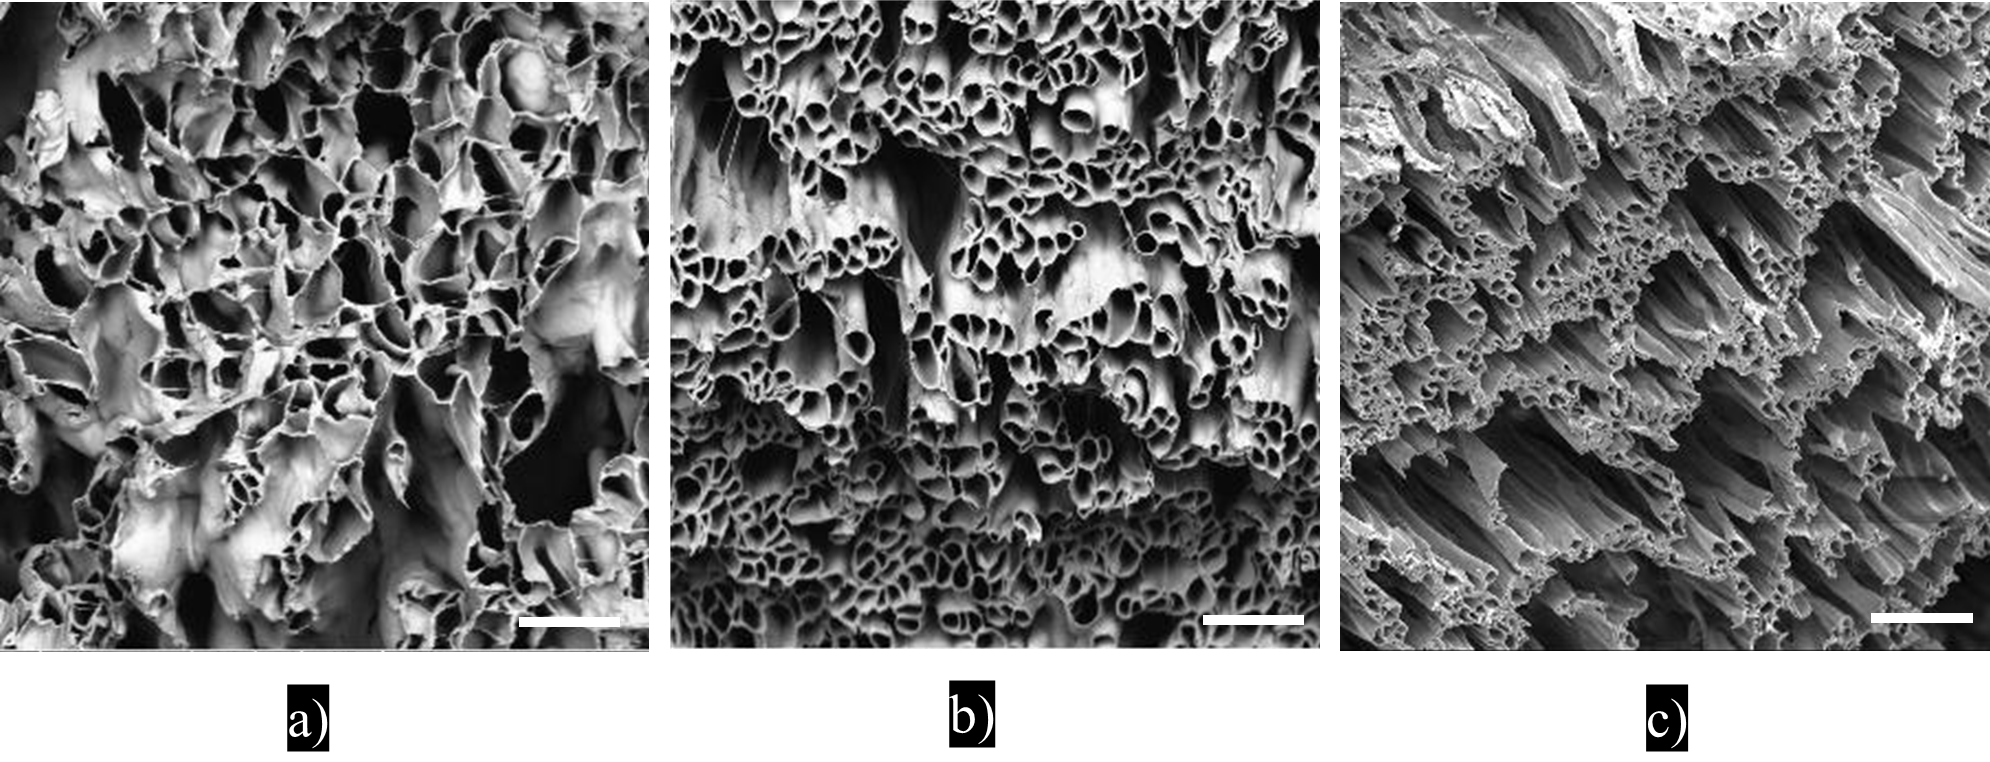
SEM characterisationFig. 2a-c shows that the fibres are well-aligned but tend to merge with neighbouring fibres. Fibre alignment increases with increasing collector speed (Fig. 2d-f). Hollow fibres (pores) and relatively large extra-fibre space are the main features of fibre strips (Fig. 3a-c). Fibres become thinner with increasing collecting speed. The pore diameter range of the PCL-PSi-100 spans 3 - 18+ µm, wider than the PCL-PSi-400 and -800 with ranges of 3 -15 µm and 3 -12 µm, respectively. The area-weighted fibre inner diameter varies from 10.6 ± 2.0 μm for PCL-PSi-100, through 7.3 ± 0.4 μm for PCL-PSi-400 to 5.1 ± 0.2 μm of PCL-PSi-100.
Phantom DTI metrics
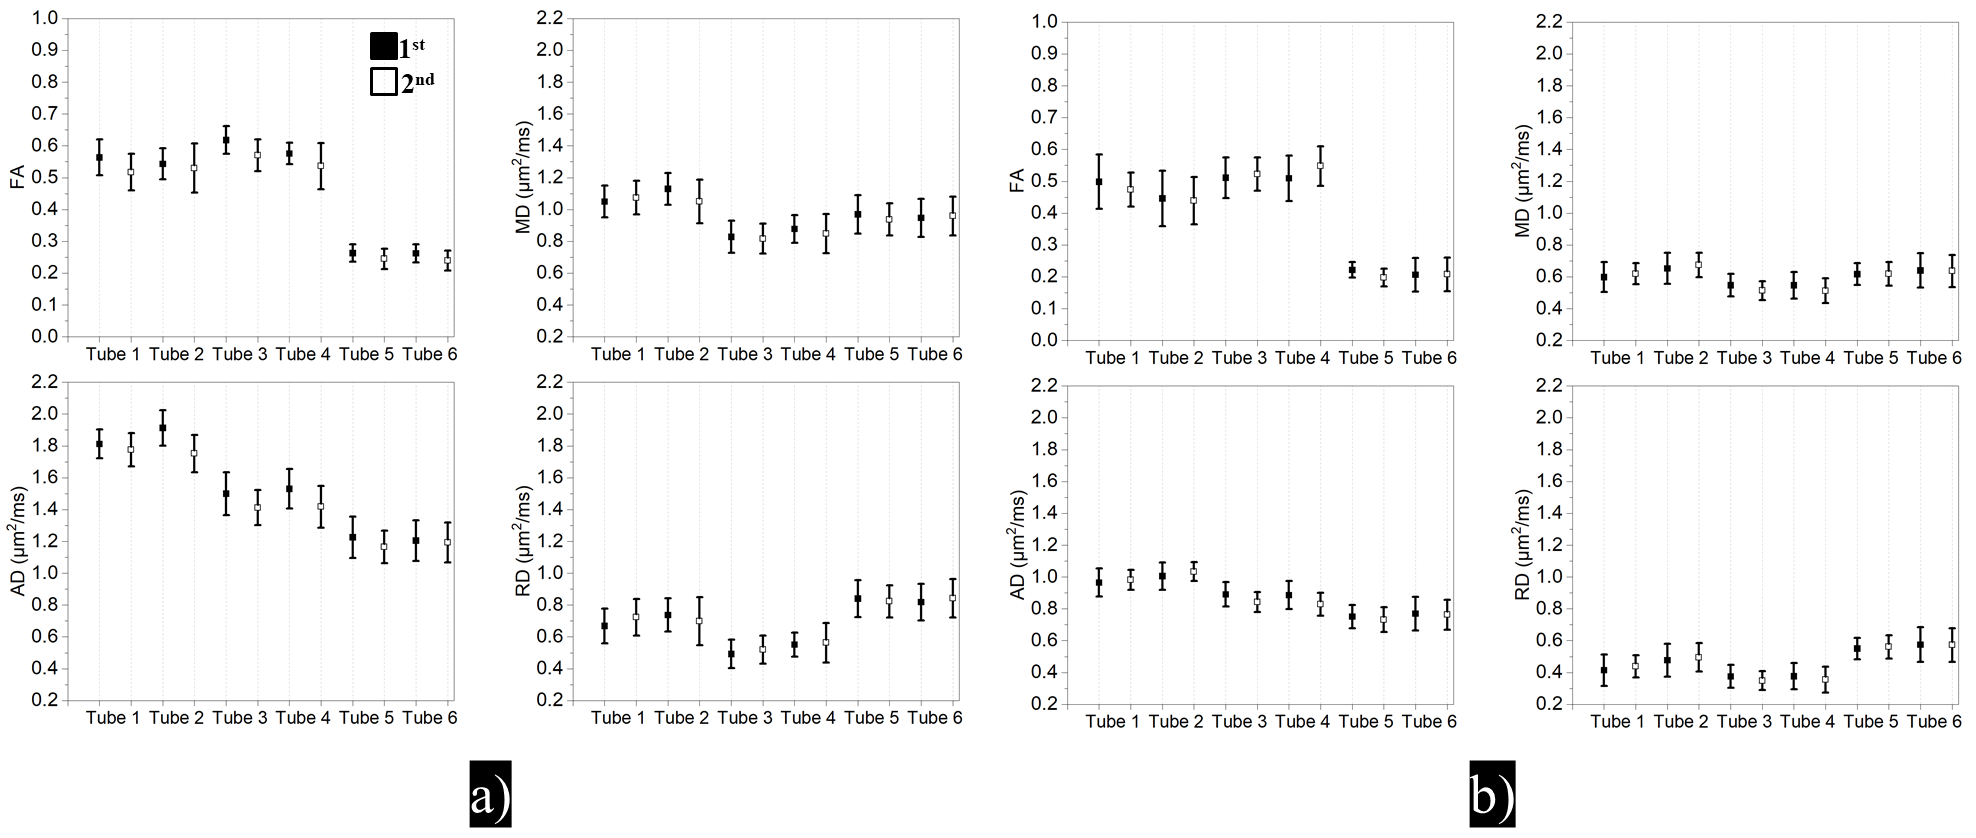
The phantom exhibits DTI metrics that are mostly in the range expected for brain white matter2, 3. Figure 4a depicts the mean ± stdev of DTI metrics acquired across 9 scanners/protocols in the two RT scans. The inter-scanner/protocols CVs of FA span 5.90%-14.62% at RT. Tube 6 and Tube 2 show the largest (6.48%) and smallest inter-scan CV (1.75%). The inter-scanner/protocols CVs of MD/AD/RD at RT range from 8.91%/4.99%/12.27% to 14.60%/10.60%/22.05%. The inter-scanner/protocols CVs of RD are much higher than those for MD and AD in all Tubes. The inter-scan CV range 0.86% - 5.21% for MD, 0.73% - 6.25% for AD, and 1.47% - 5.55% for RD.
Figure 4b displays the mean ± stdev of DTI metrics in IW. The inter-scanner/protocols CVs of FA reach up to 25.84% (Tube 6, IW-1st) and down to 10.01% (Tube 3, IW-2nd); two repeated MR scans of Tubes 5&6 show the largest (8.37%) and smallest CV (0.41%). The inter-scanner/protocols CV of MD/AD/RD vary from 10.6%/5.7%/12.2% to 16.8%/13.8%/24.0%. For MD, AD and RD, the largest and smallest inter-scan CVs are 4.52% and 0.10%, 4.81% and 0.64%, 5.23% and 0.36%, respectively.
DISCUSSION
The increasing fibre orientation in the fibre strips is responsible for the increases in FA and AD values. For two scans under RT, FA and AD showed better inter-scanners/protocols reproducibility than MD and RD. When comparing DTI metrics between RT-1st and RT-2nd, FA and MD showed the worst and best inter-scan CVs, respectively. In the case of scans in IW, DTI metrics showed comparable or slightly worse inter-scanners/protocols reproducibility than those in RT, except higher CV values in Tube 6. The inter-scan CVs were improved for all DTI metrics, in particular FA.CONCLUSION
We show that our co-electrospun white matter phantom can be used to determine DTI metric variability inter-scans and inter-scanners/protocols. The phantom exhibits DTI metrics that are mostly in the range expected for brain white matter, and is suitably robust for use in multi-centre studies.Acknowledgements
This research was supported by NIHR UCLH Biomedical Research Centre (BRC) grant, UK-MRC ImagingBioPro grant (MR/R025673/1), UCL Department of Medical Physics and Biomedical Engineering and EPSRC (EP/M020533/1; CMIC Pump-Priming Award), and Royal Society (IEC\NSFC\201051 - International Exchanges 2020 Cost Share (NSFC) award). GJM Parker has a shareholding and part time appointment and directorship at Bioxydyn Ltd. which provides MRI services. He is also a director and shareholder of Queen Square Analytics Ltd, which provides quantitative MRI services. This research was also supported by the Taishan Scholars Project (No. tsqn201812147). FLZ and FG contributed equally to this work.References
1. Teipel, S. J.; Reuter, S.; Stieltjes, B.; et al. Multicenter stability of diffusion tensor imaging measures: A European clinical and physical phantom study. Psychiatry Research: Neuroimaging 2011, 194 (3), 363-371.
2. Grech-Sollars, M.; Hales, P. W.; Miyazaki, K.; et al. Multi-centre reproducibility of diffusion MRI parameters for clinical sequences in the brain. NMR in Biomedicine 2015, 28 (4), 468-485.
3. Palacios, E. M.; Martin, A. J.; Boss, M. A.; et al. Toward Precision and Reproducibility of Diffusion Tensor Imaging: A Multicenter Diffusion Phantom and Traveling Volunteer Study. American Journal of Neuroradiology 2017, 38 (3), 537-545.
4. Provenzale, J. M.; Taylor, B. A.; Wilde, E. A.; et al. Analysis of variability of fractional anisotropy values at 3T using a novel diffusion tensor imaging phantom. Neuroradiol J 2018, 31 (6), 581-586.
5. Wilde, E. A.; Provenzale, J. M.; Taylor, B. A.; et al. Assessment of quantitative magnetic resonance imaging metrics in the brain through the use of a novel phantom. Brain Injury 2018, 32 (10), 1265-1275.
6. Thieleking, R.; Zhang, R.; Paerisch, M.; et al. Same Brain, Different Look?—The Impact of Scanner, Sequence and Preprocessing on Diffusion Imaging Outcome Parameters. Journal of Clinical Medicine 2021, 10 (21), 4987.
7. Zhou, F.-L.; Li, Z.; Gough, J. E.; et al. Axon mimicking hydrophilic hollow polycaprolactone microfibres for diffusion magnetic resonance imaging. Materials & Design 2018, 137, 394-403.
8. Huang, C.-C.; Hsu, C.-C. H.; Zhou, F.-L.; et al. Validating pore size estimates in a complex microfibre environment on a human MRI system. Magnetic Resonance in Medicine 2021, 86 (3), 1514-1530.
9. Kerkelä, L.; Nery, F.; Callaghan, R.; et al. Comparative analysis of signal models for microscopic fractional anisotropy estimation using q-space trajectory encoding. NeuroImage 2021, 242, 118445.
Figures