2721
Developing 3D-printed phantoms for quality assurance and validation of quantitative DCE–MRI measurements1Centre for Clinical Brain Sciences, The University of Edinburgh, Edinburgh, United Kingdom, 2Institute for Bioengineering, The University of Edinburgh, Edinburgh, United Kingdom, 3Edinburgh Imaging, The University of Edinburgh, Edinburgh, United Kingdom, 4Institute for Materials and Processes, The University of Edinburgh, Edinburgh, United Kingdom
Synopsis
Difficulties in engineering accurate biomimetic phantoms make it challenging to validate MRI models. This is particularly true for quantitative vascular permeability measurements using dynamic contrast-enhanced (DCE-) MRI, where no robust controllable phantoms are available for validating novel techniques and harmonising multicentre results. We developed 3D-printed biomimetic vascular permeability phantoms with controllable properties and assessed their ability to interrogate common DCE model quantification approaches. Parameters such as blood flow, vascular permeability, plasma volume and extravascular volume were reproduced by adapted 3D-printed material and flow circuit properties. The resulting phantoms were shown to reproduce realistic DCE-MRI signals observed clinically.
Introduction
Dynamic contrast-enhanced (DCE) MRI is widely used to assess perfusion, vascular permeability, and other tissue properties. Commonly used tracer kinetic models describe the passage of a contrast agent bolus through the tissue.1 The model parameters reflect physiological processes which can be used to evaluate disease progression. For example, blood-brain barrier integrity is typically evaluated with the permeability-surface area product PS, which characterises the leakage of contrast agent from blood capillaries to the extravascular space.2 Scanning equipment and acquisition/analysis protocol differences can introduce measurement uncertainties, causing significant variations in measured DCE model parameters. For example, healthy brain tissue PS values have varied by an order of magnitude.3Adapted MRI phantoms are needed to validate quantitative DCE measurements and achieve multicentre harmonisation.4 However, challenges in precision engineering compromise the ability of existing phantoms to quantitatively assess DCE permeability measurements. There are currently no phantoms involving controllable manufacturing parameters reflecting DCE model parameters such as PS, plasma volume (vp) or extravascular volume (ve).
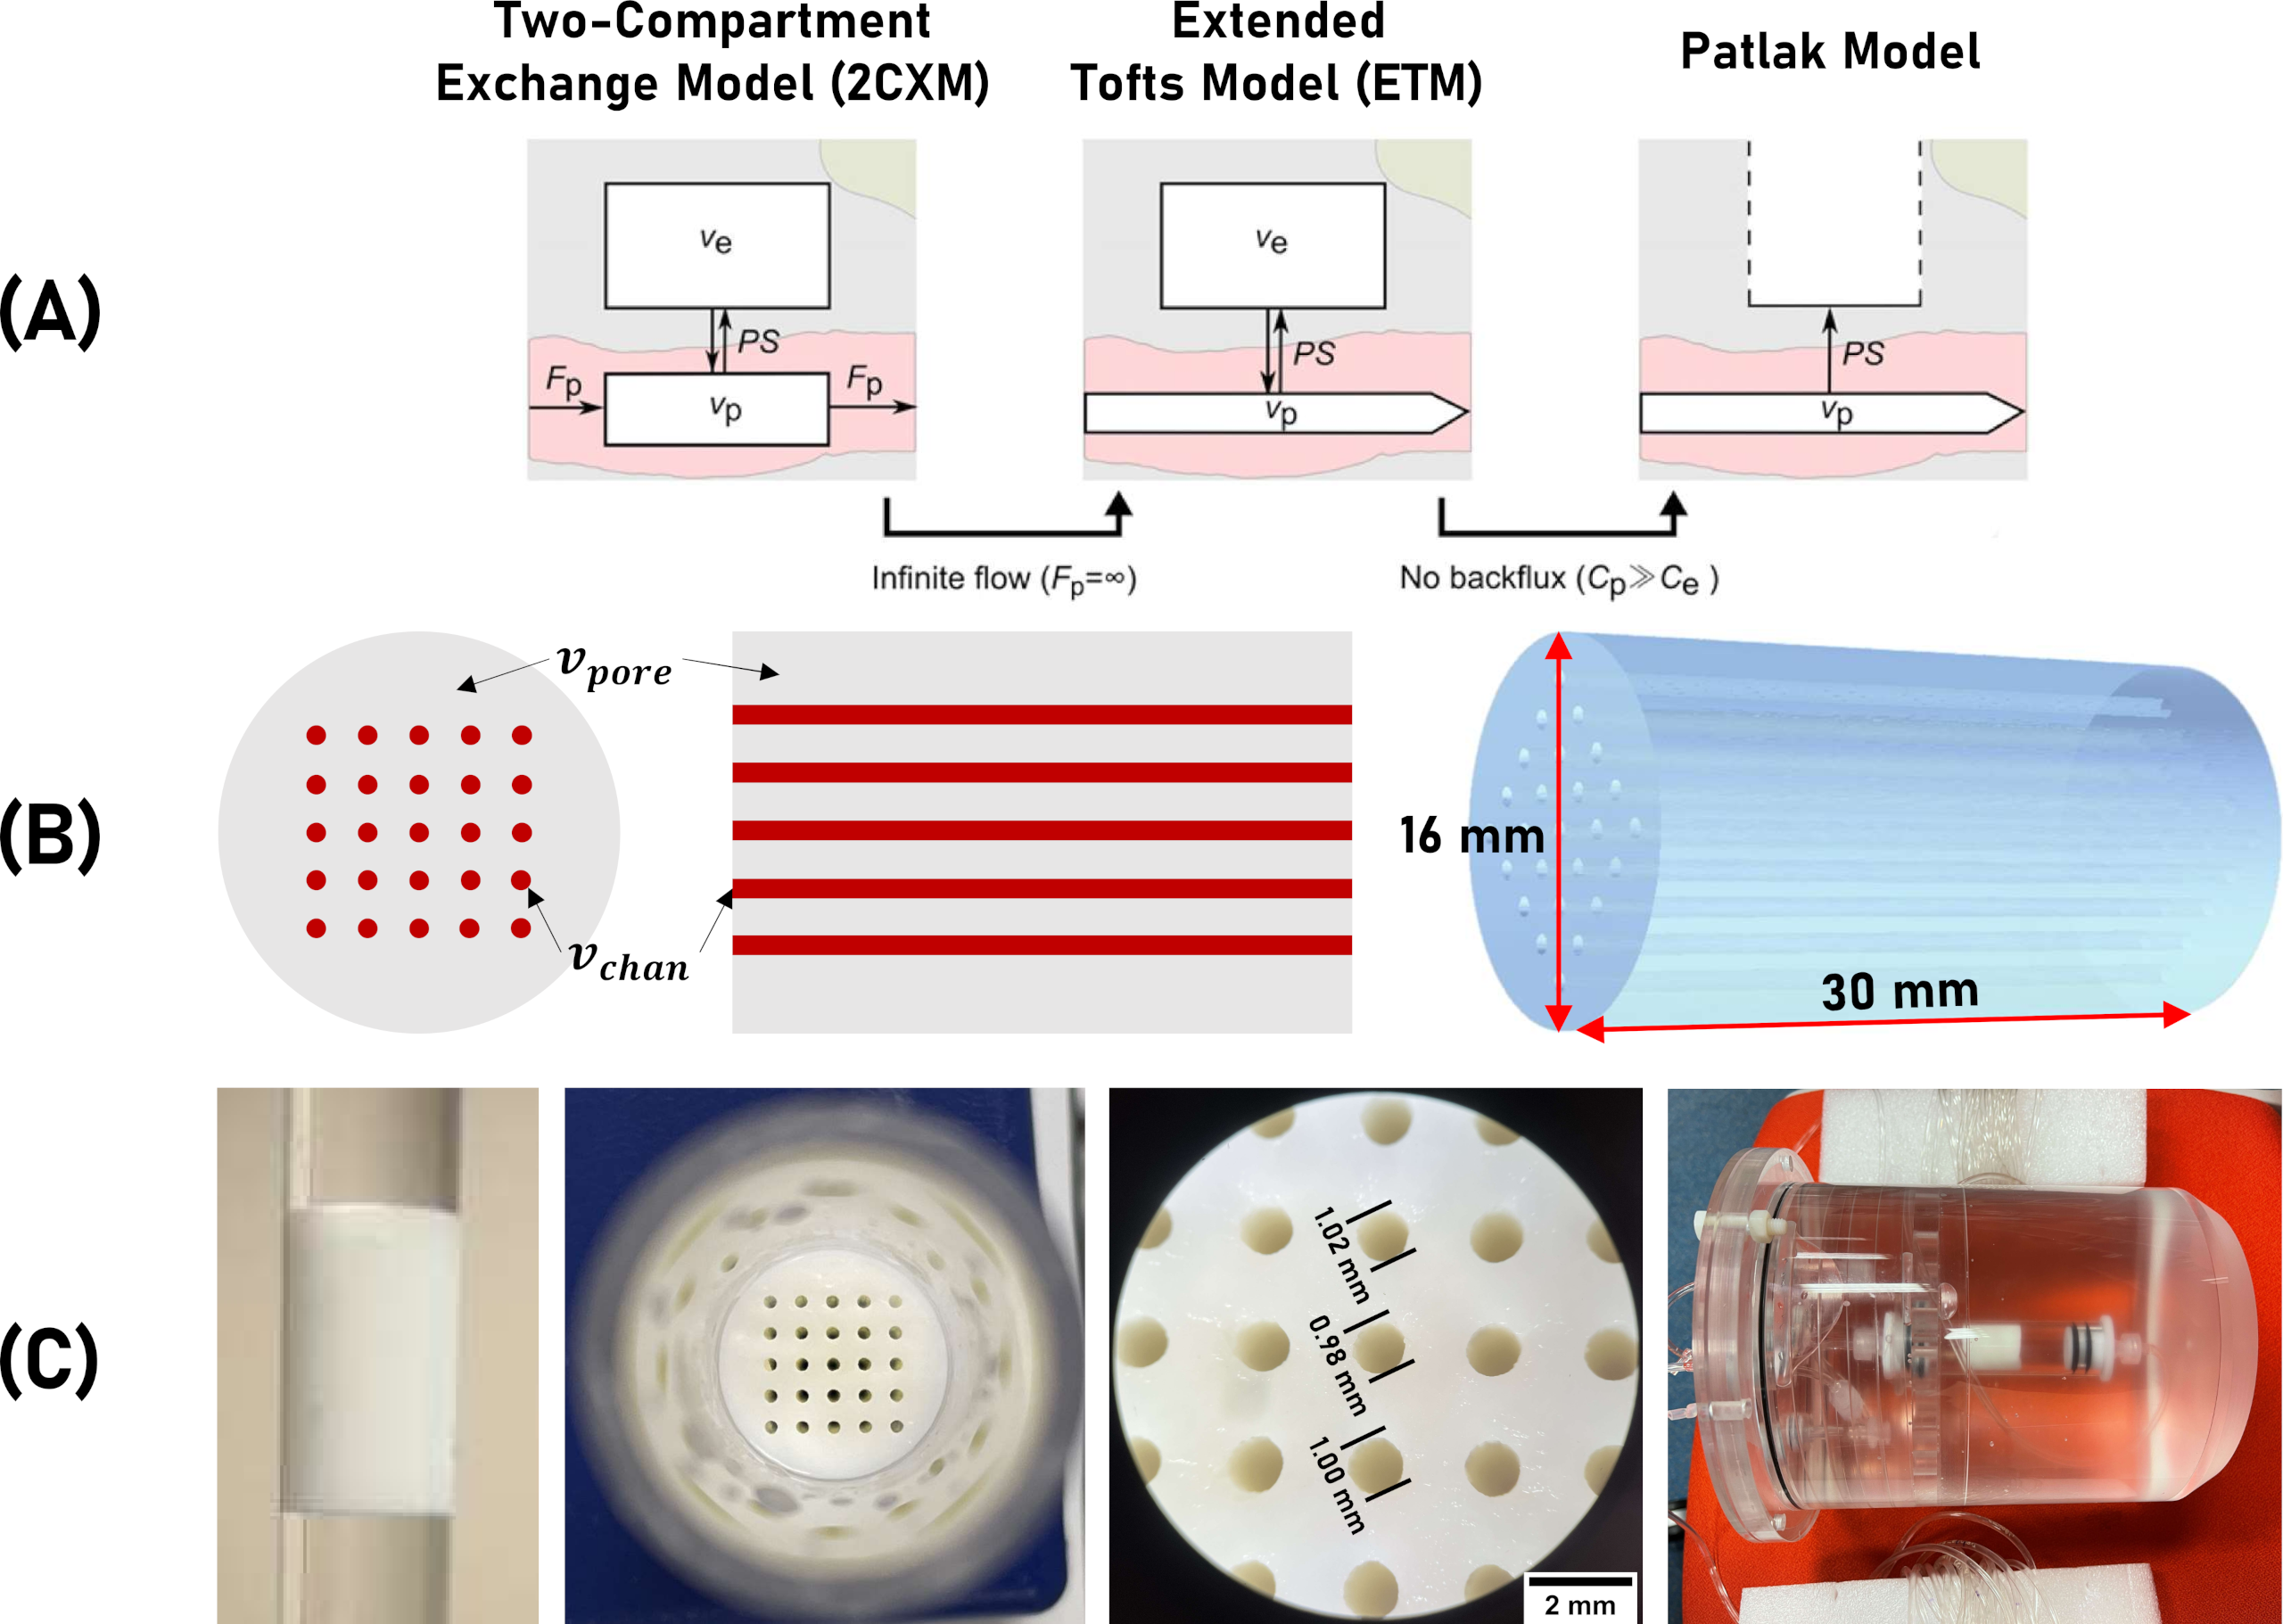
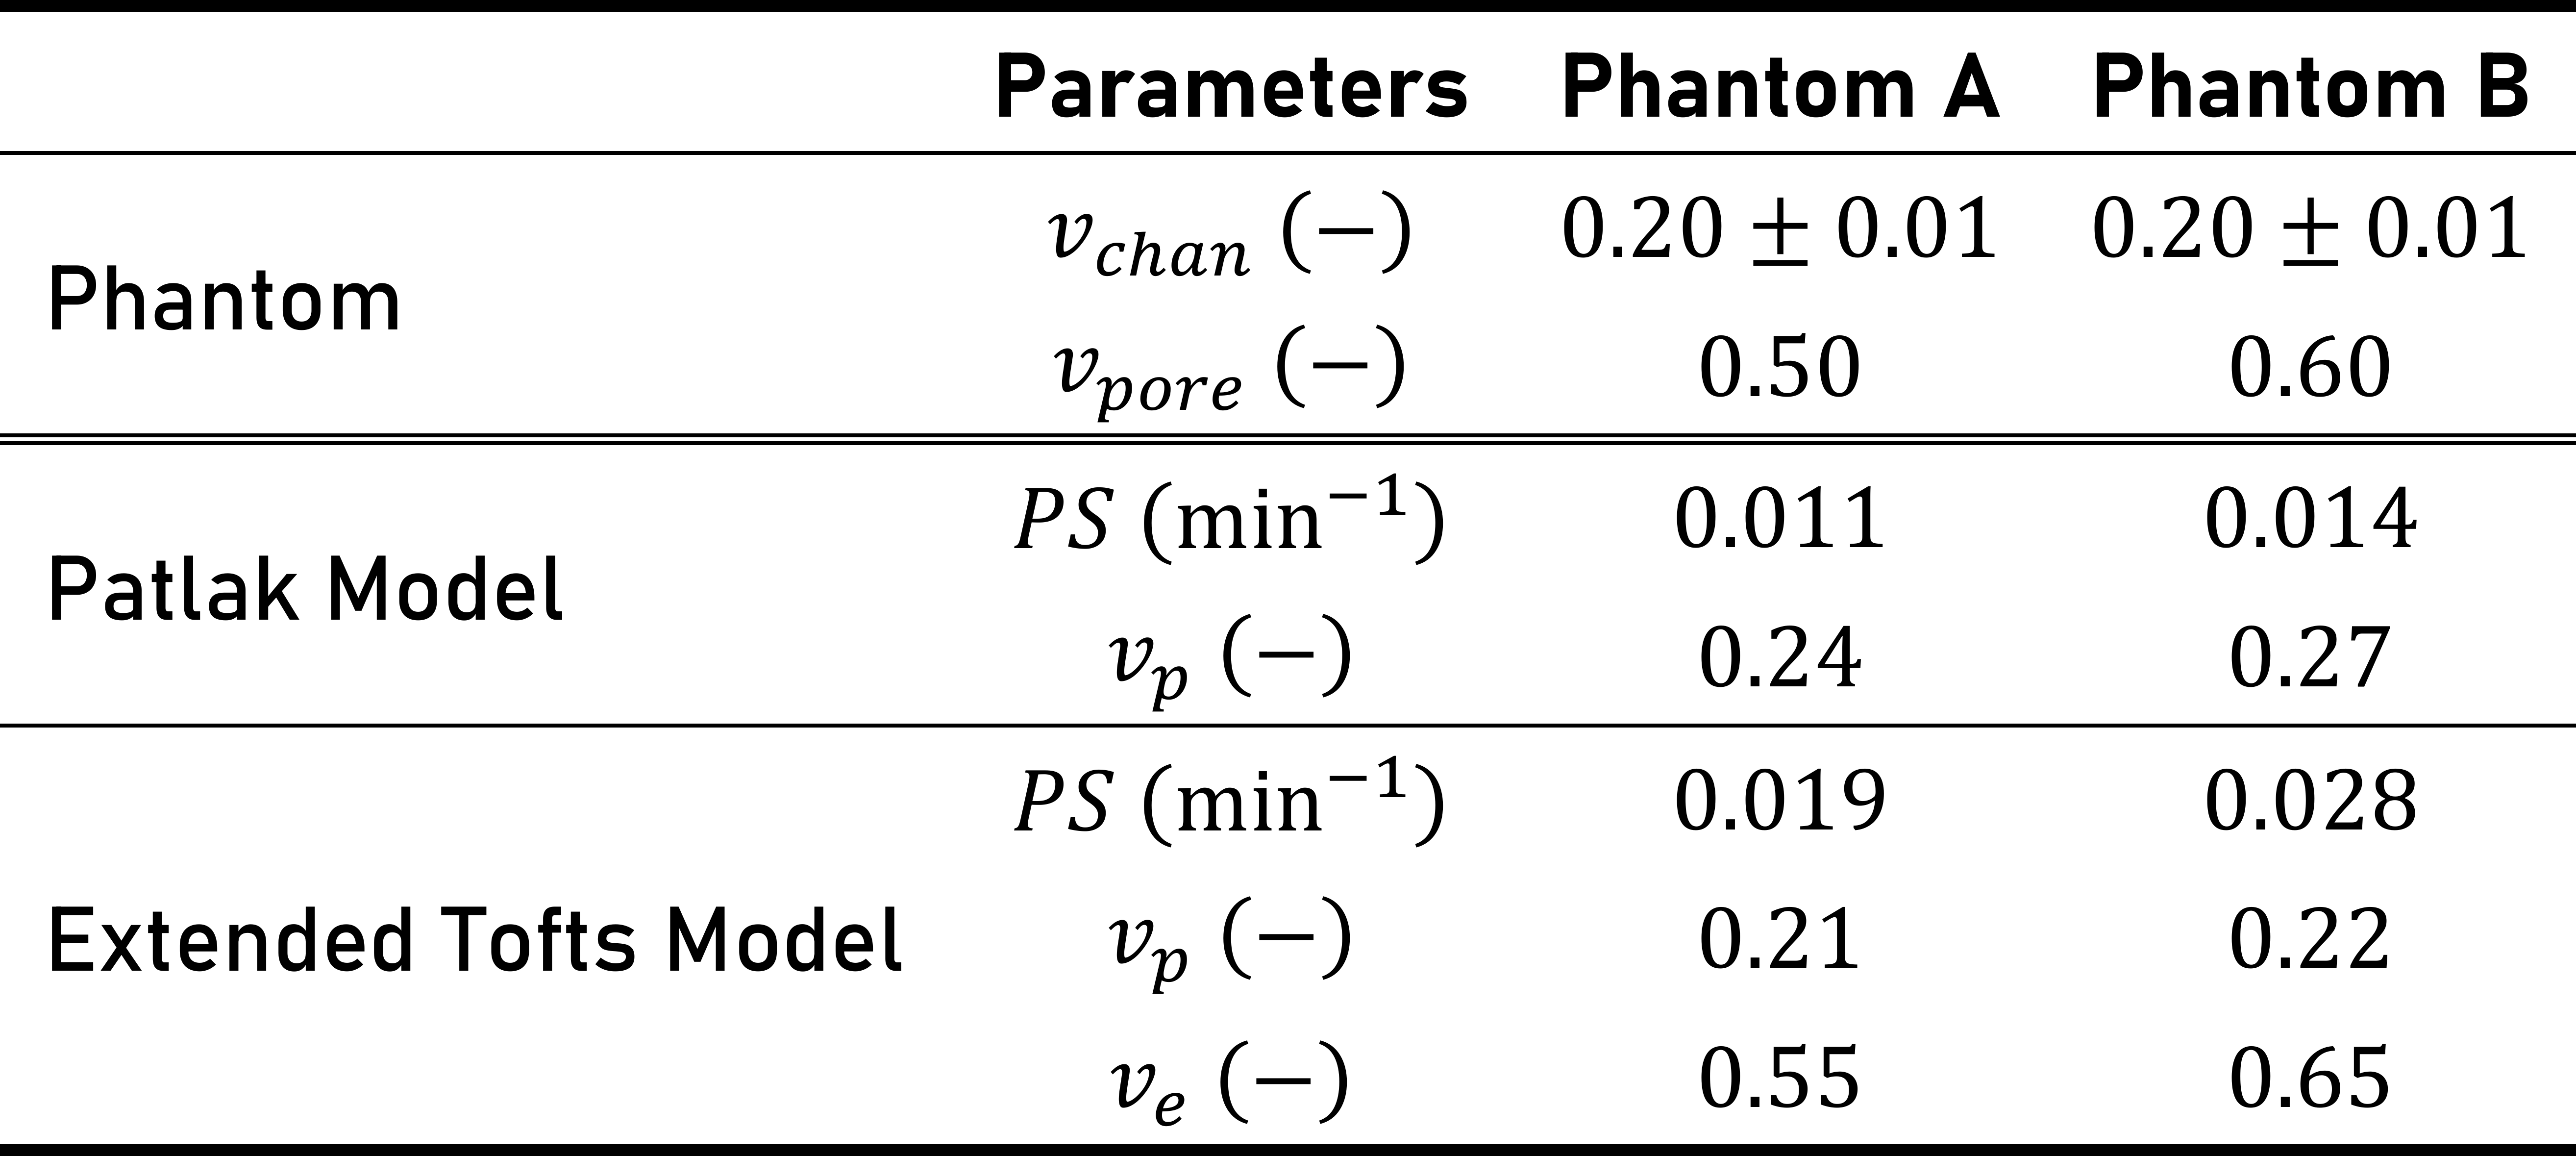
The aim of this study was to evaluate whether recent 3D-printing developments can enable the fabrication of precision phantoms, reflecting clinically used DCE-MRI models (Figure 1A). Our main hypothesis was that DCE-MRI signal of 3D-printed (3DP) phantoms of controllable structure and flow properties can be modelled using a two-compartment tracer kinetic model. In particular, that increasing the printing material pore volume (vpore) while keeping the printed channel volume (vchan) constant would result in greater ve and PS, without affecting vp.
Methods
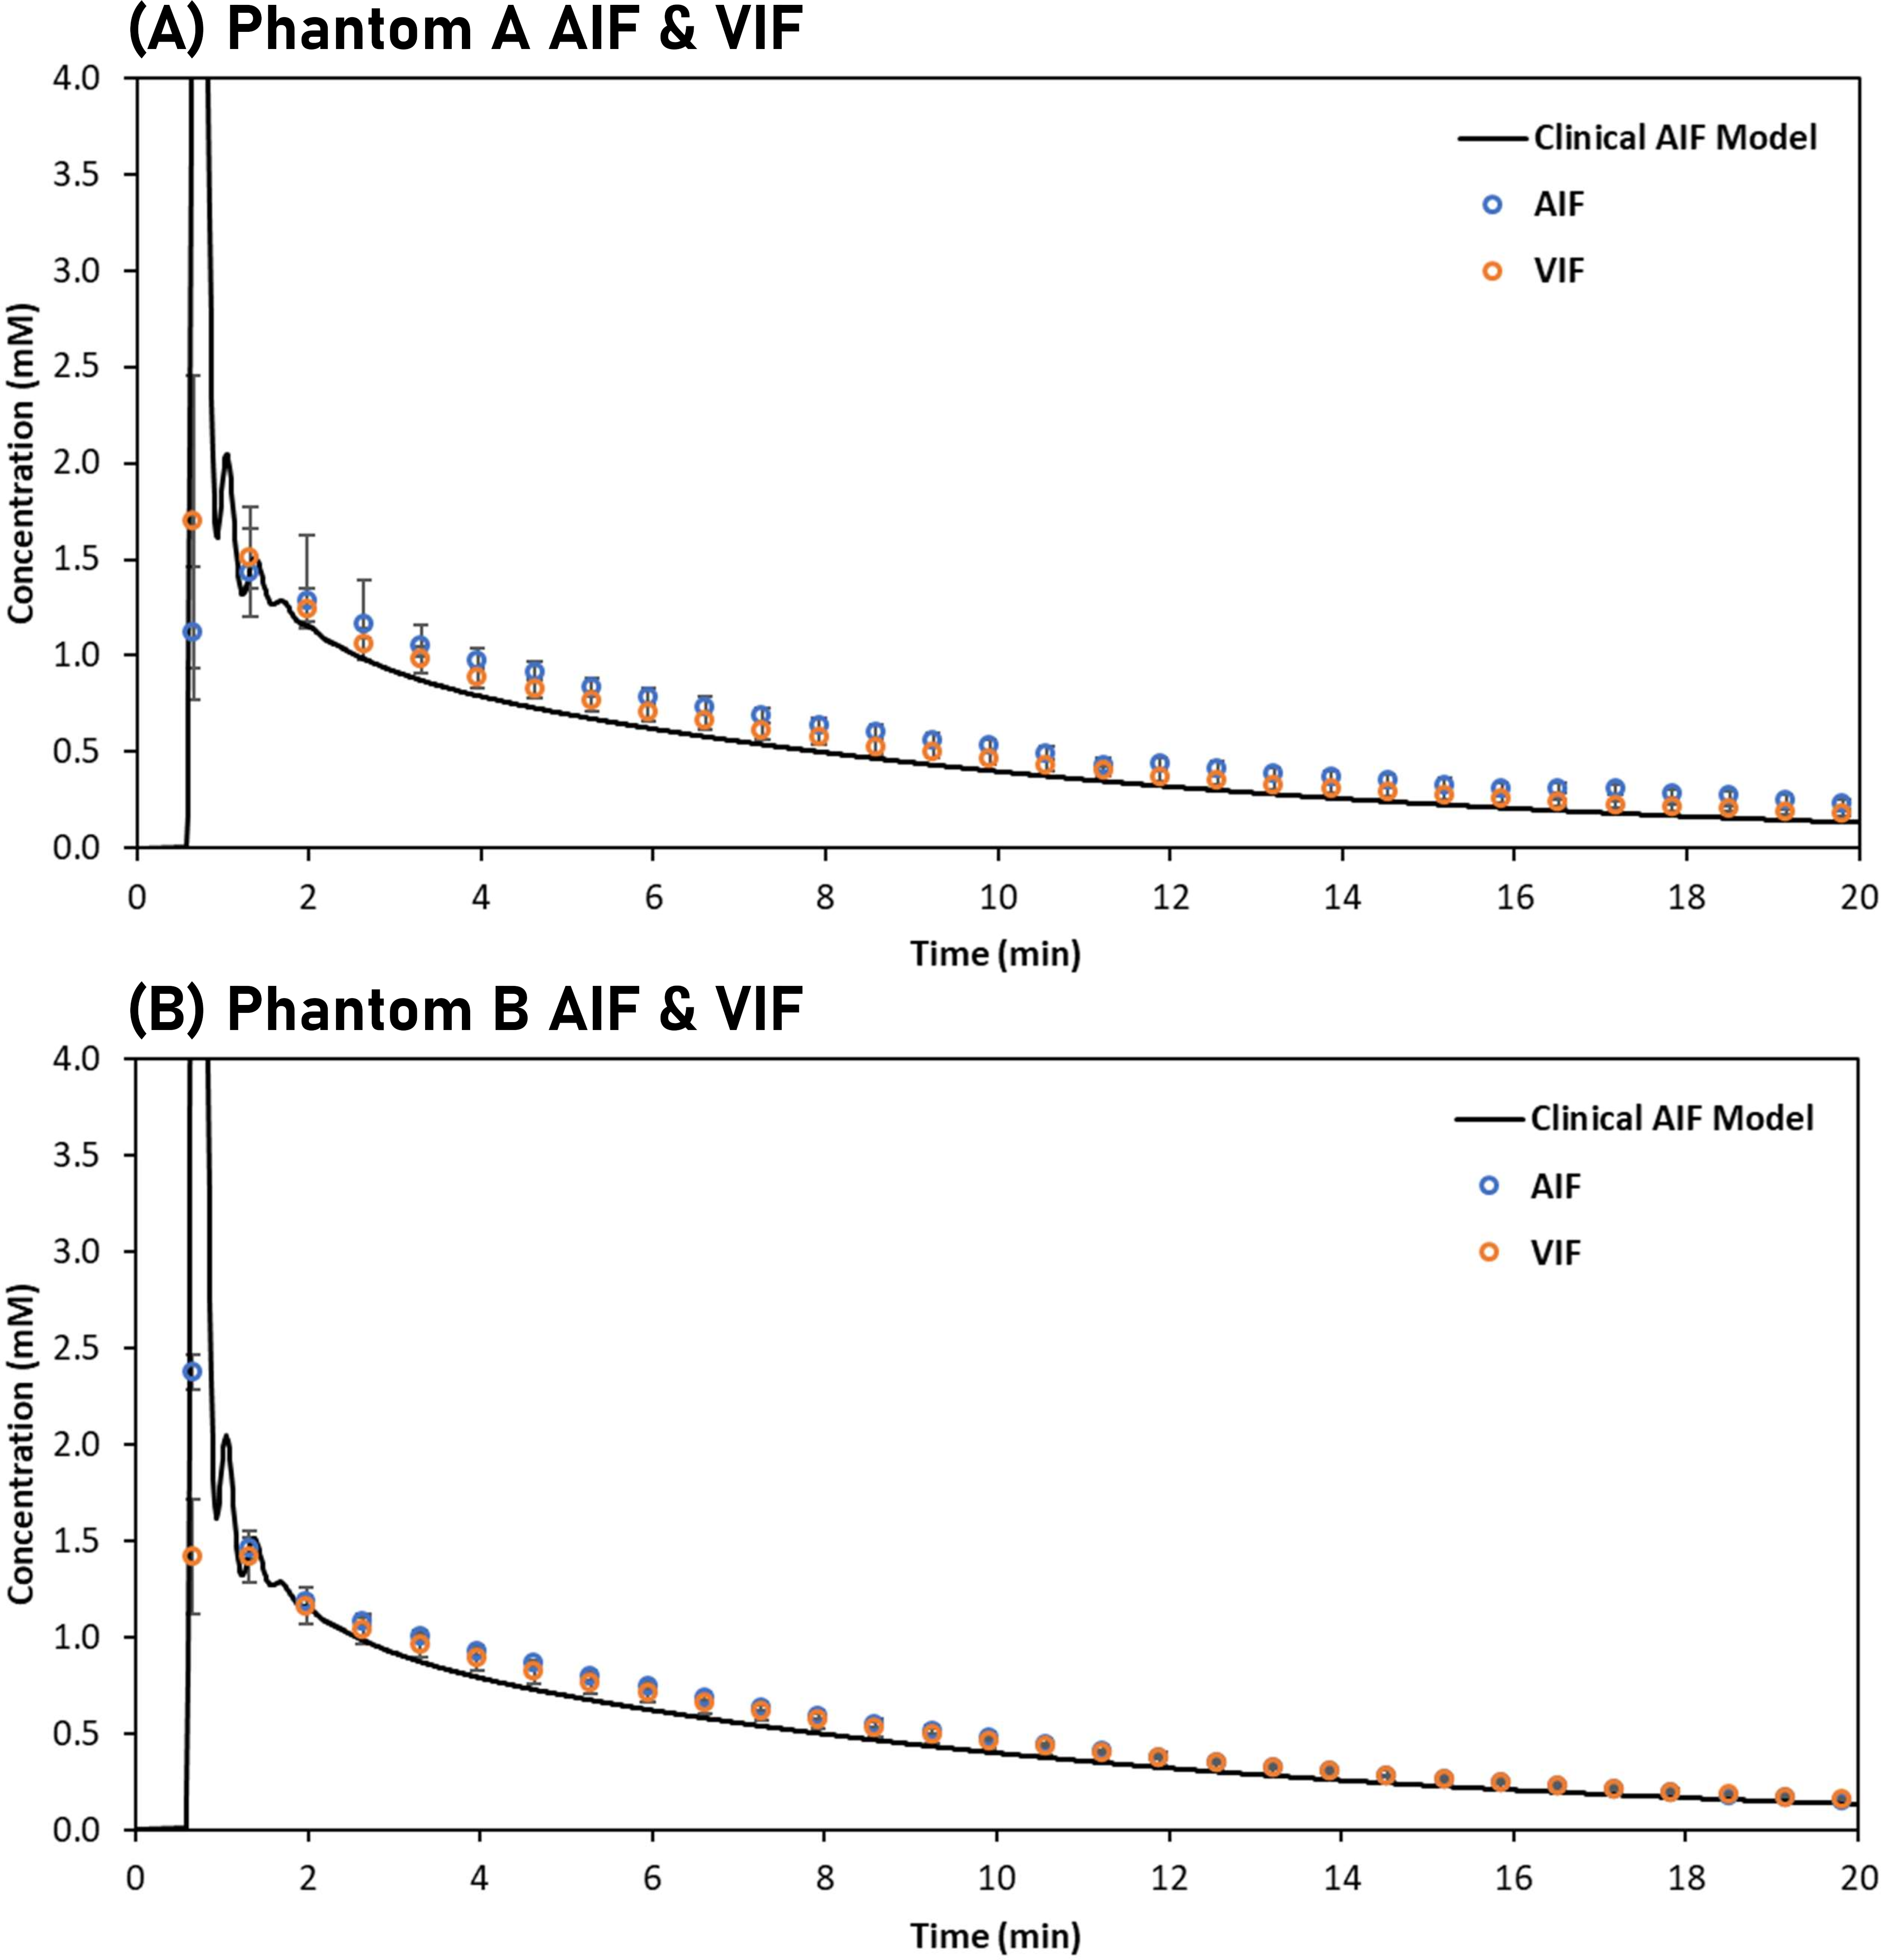
Phantom production: Phantoms (Figure 1B) were fabricated using digital light processing printing,5 controlling channel volume vchan and porosity vpore. vpore was controlled by the amount of porogens in the printing formulation. Lowering porogen concentration lowers intraparticle porosity and pore size, decreasing permeability (PS).6 Phantoms A and B were fabricated with 50 and 60 % (v/v) porogen, respectively.Clinically-relevant vascular input: A flow circuit (Figure 1C) was used to produce a clinically relevant arterial input function (AIF). Water was pumped (17 mL/min) to the phantom. 3 mL of gadobutrol (69 mM) was injected into a mixer (containing 21 mL of water) in followed by a dilution with 140 mL of water, resulting in typically observed vascular input signals (Figure 3A-B). This protocol was optimised with tracer experiments and computer modelling, and compared with population averaged AIF models .7
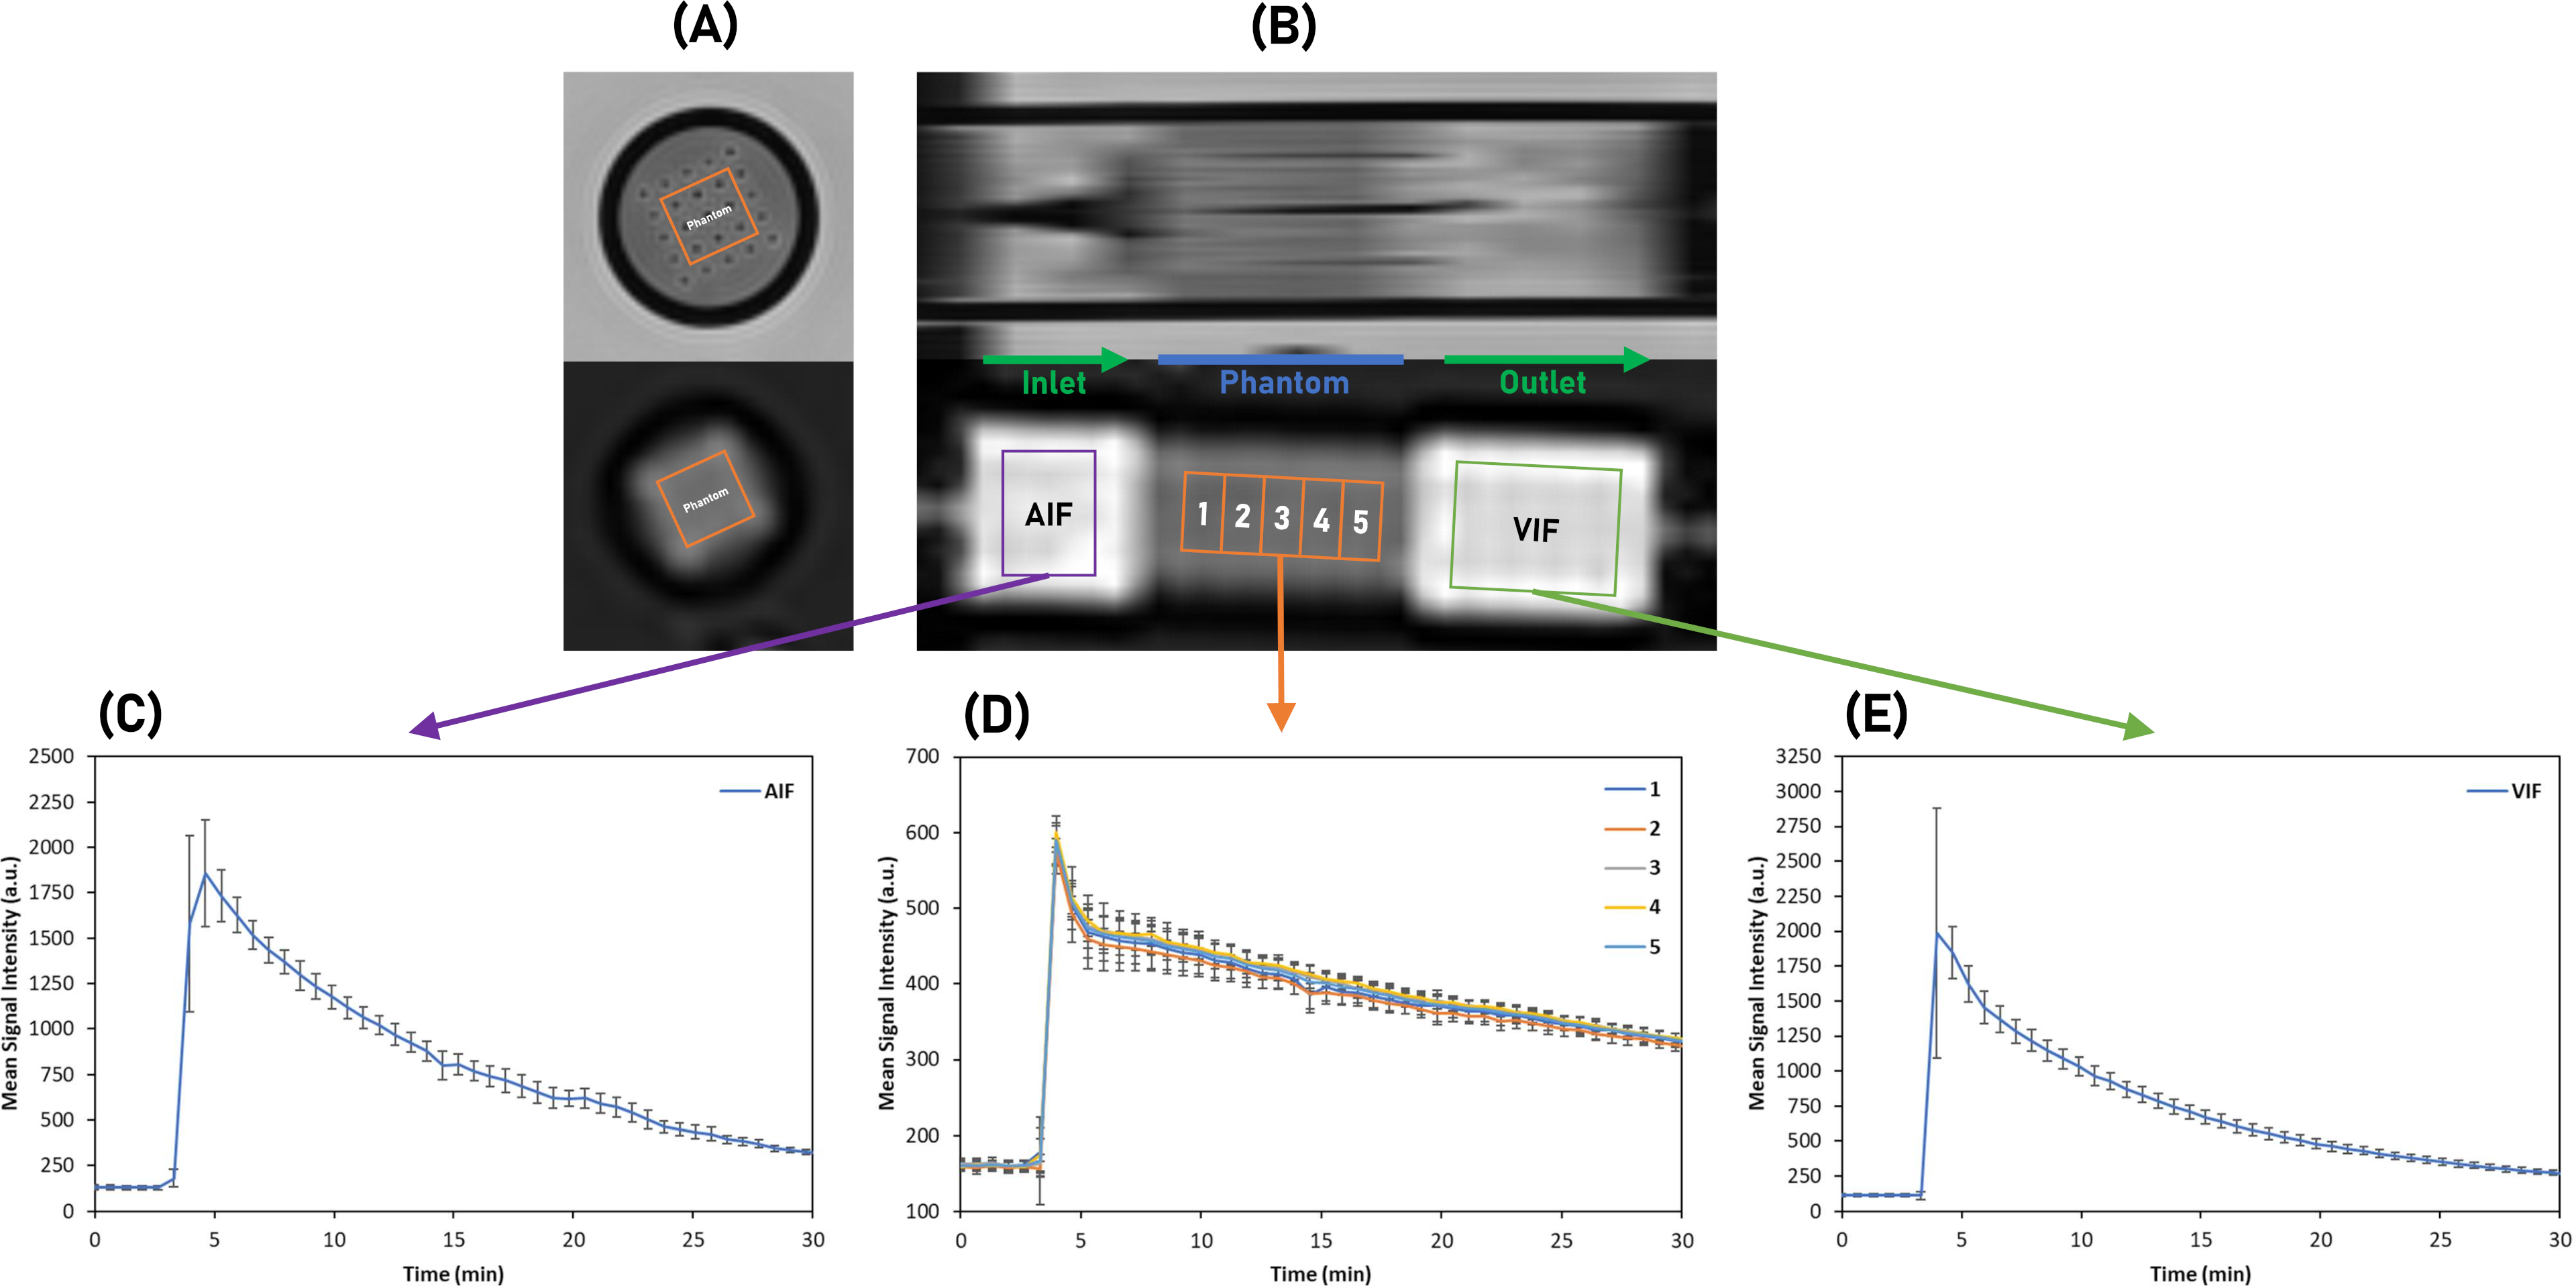
Acquisition/processing protocols: DCE phantoms were scanned using a clinical DCE-MRI protocol.8 DCE-MRI consisted of a 3D T1W spoiled gradient echo sequence performed using a 3T Siemens Prisma scanner and 32-channel phased-array head coil, TR/TE = 3.4 ms/1.7 ms, FA = 15°, 2 x 2 x 4 mm resolution, 32 volumes acquired every 39.62 s over 35 minutes. Masks were used to compute mean values for signal enhancement. VIF was used as a proxy for AIF. Calculated Gd concentration maps and fitted to Patlak and extended Tofts models.
Results
Figures 2A-B show T2W images of the DCE phantoms. vchan estimations based on T2W masks agreed with microscope measurements (Figure 1C). Figures 2C-E show AIF, VIF and phantom signal variation.Figures 3A-B shows mean AIF and VIF compared with the clinical AIF model. On average, the phantom VIFs deviate from each other by ±4 %. The area under phantom A and B VIFs was within 5% of the AIF model one.
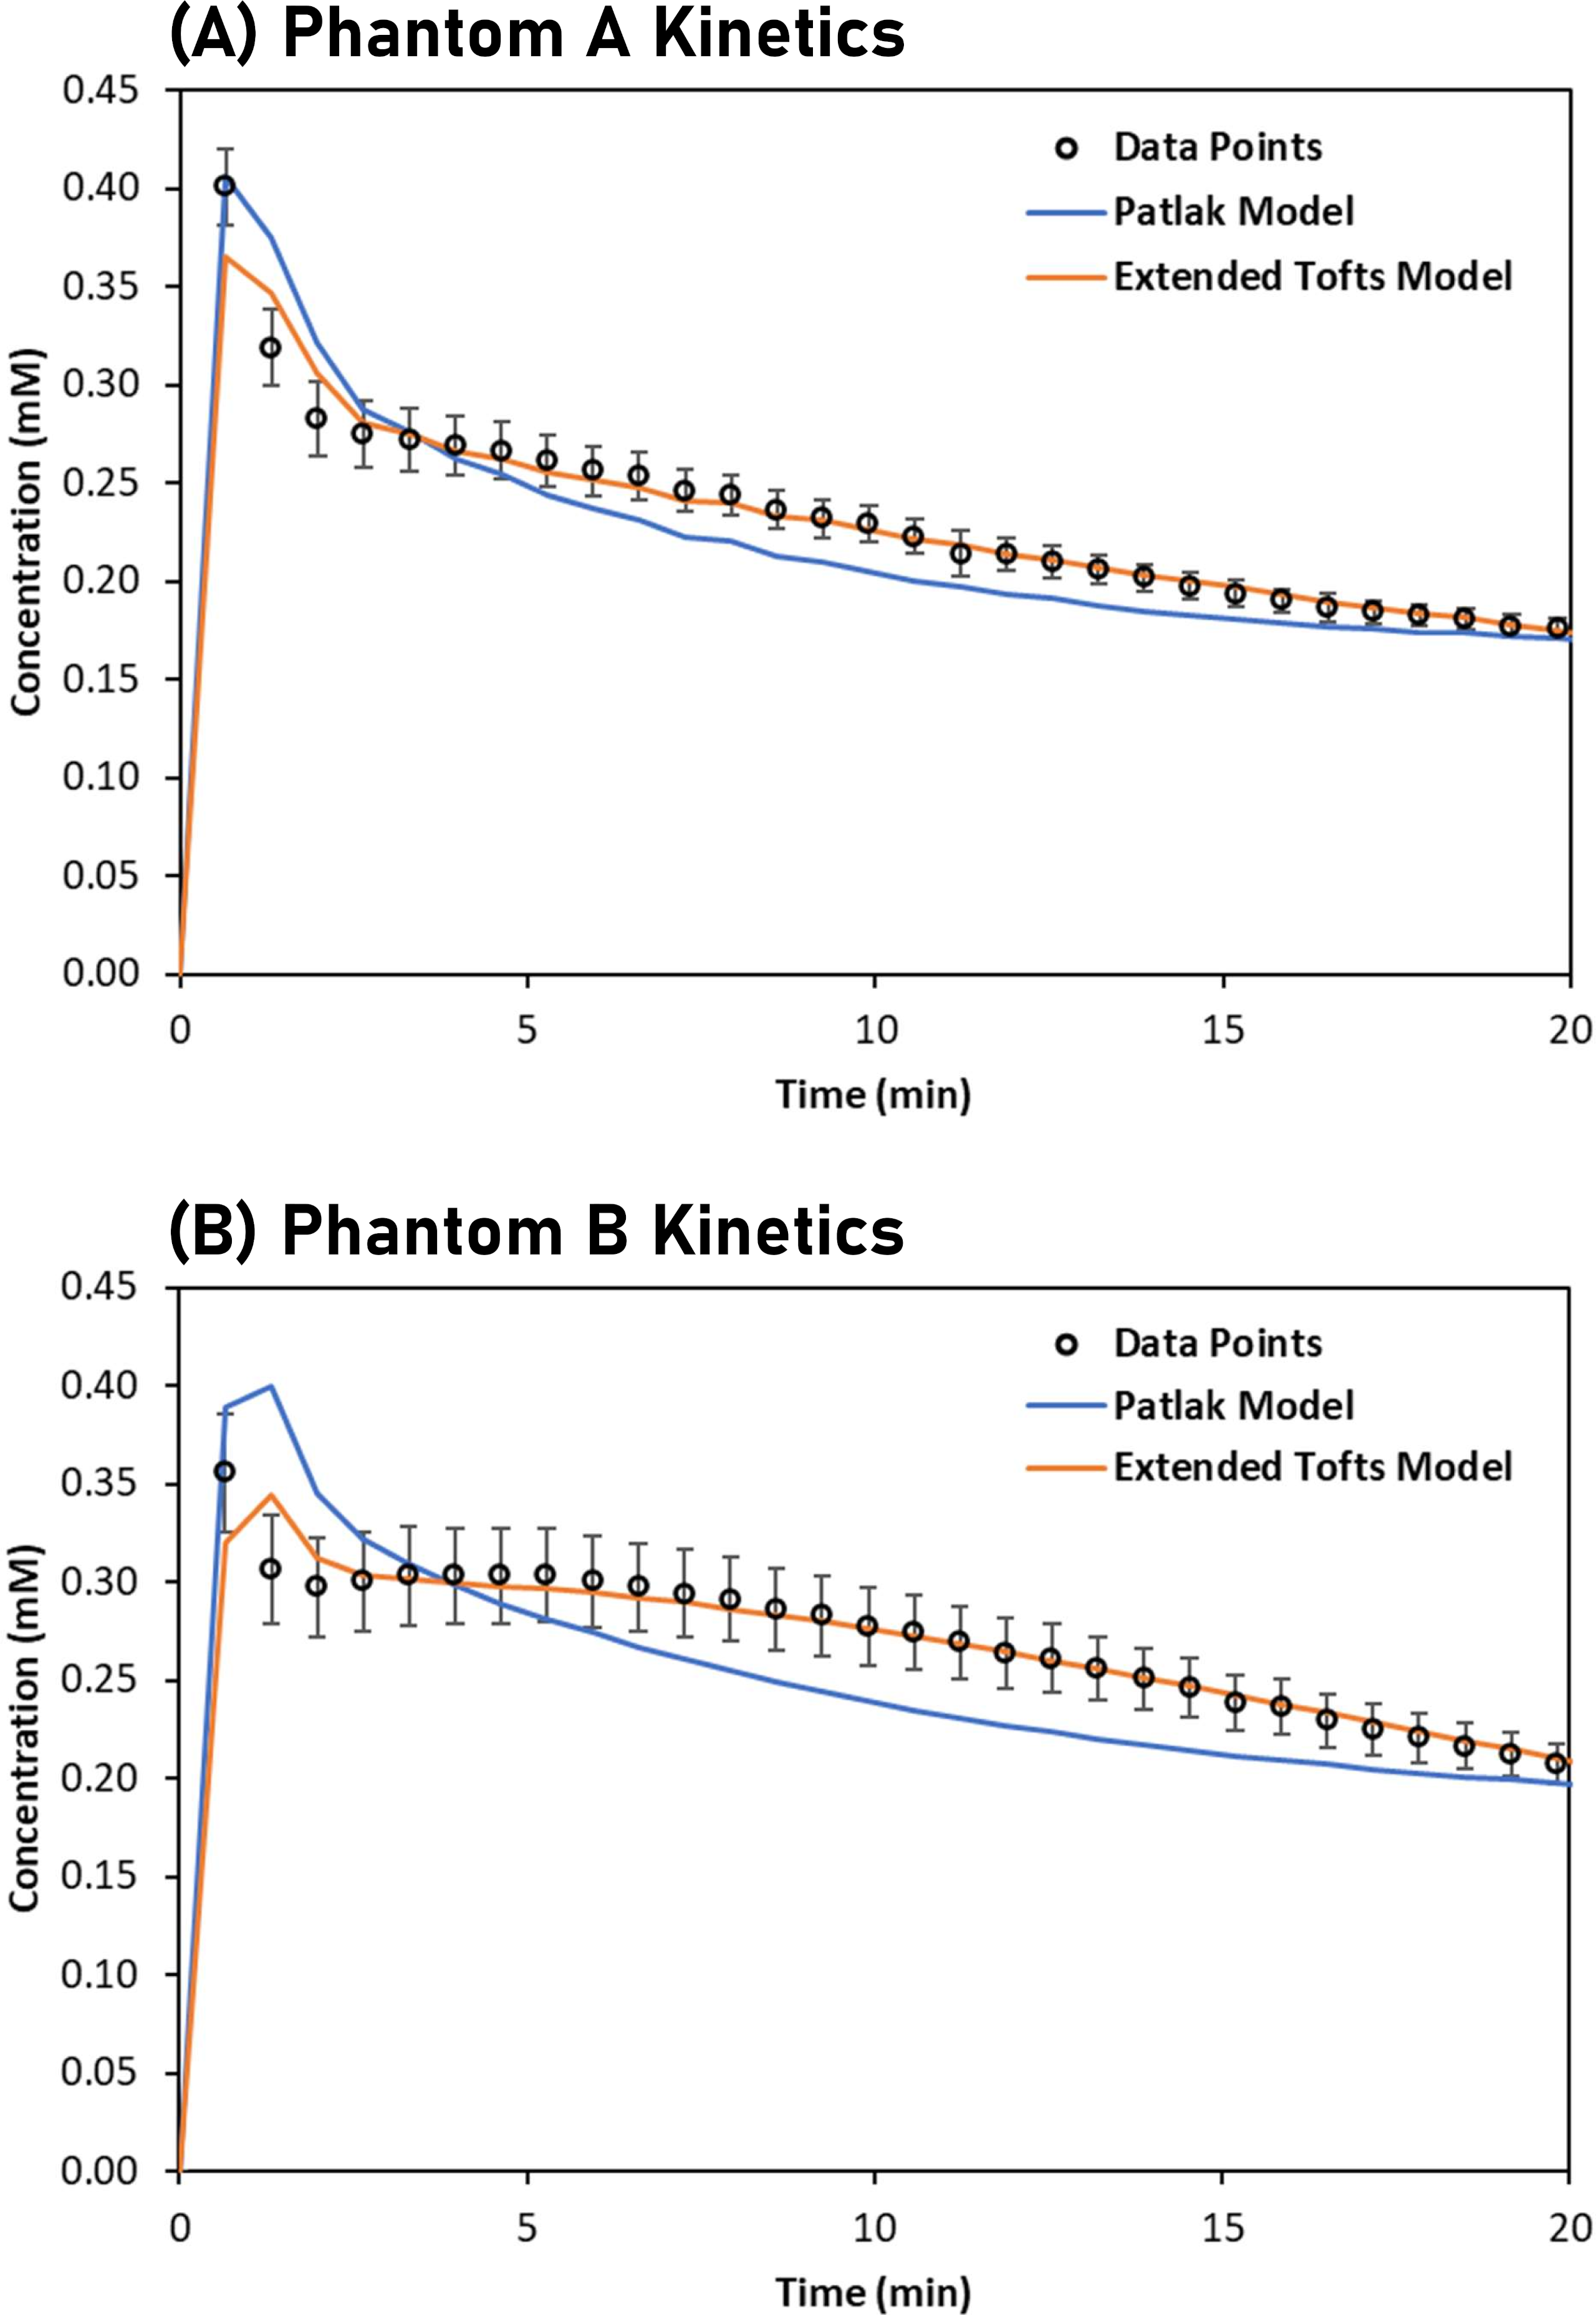
Figures 4A-B show Patlak and extended Tofts models fitted to phantoms A (vpore = 0.5) and B (vpore = 0.6). The extended Tofts model provide a good fit to most phantom data with an average deviation of ± 2 %. The fit is poor near the initial peak. The Patlak model consistently overshoots/undershoots both phantoms outside the range of error bars (± 1 SD).
Figure 5 shows model parameters obtained from fitting. With the extended Tofts model, phantoms A and B had a fitted vp of 0.21 and 0.22, ve of 0.55 and 0.65, and PS of 0.019 and 0.028, respectively.
Discussion
The optimised flow circuit generated repeatable VIFs, closely matching clinical population averaged AIF. AIFs were less homogeneous but still reproduced the expected clinical AIF features.The extended Tofts model provided a better fit for both phantoms beyond the initial peak, validating our initial hypothesis that phantom DCE-MRI signals can be modelled using a two-compartment kinetic model. As hypothesised, an increase in vpore of the phantom led to an increase in measured PS. With channel surface remaining constant that can be translated as an increase in permeability. vp was found to be constant in both phantoms, arguably reflecting the constant vchan value. ve values were in agreement with estimated ve values based on phantom material porosity. A limitation to this approach lies in the difficulty to quantitatively relate DCE parameters to phantom metrics (e.g., the relationship between vchan and vp).
Conclusions
By combining 3DP phantoms bearing controllable properties with an adapted flow circuit, we altered DCE model parameters in a controllable fashion. Further research is required to better relate the DCE phantom manufacturing parameters to the DCE model ones. Initial results suggest that 3DP phantoms have the potential to address several limitations of existing DCE phantoms, allowing the quantitative assessment of DCE permeability measurements.Acknowledgements
No acknowledgement found.References
1. Heye, A. K., Culling, R. D., Hernández, M. del C. V., Thrippleton, M. J. & Wardlaw, J. M. Assessment of blood–brain barrier disruption using dynamic contrast-enhanced MRI. A systematic review. NeuroImage Clin. 6, 262–274 (2014).
2. Thrippleton, M. J. et al. Quantifying blood-brain barrier leakage in small vessel disease: Review and consensus recommendations. Alzheimers Dement. 15, 840–858 (2019).
3. Raja, R., Rosenberg, G. A. & Caprihan, A. MRI measurements of Blood-Brain Barrier function in dementia: A review of recent studies. Neuropharmacology 134, 259–271 (2018).
4. Shukla-Dave, A. et al. Quantitative imaging biomarkers alliance (QIBA) recommendations for improved precision of DWI and DCE-MRI derived biomarkers in multicenter oncology trials. J. Magn. Reson. Imaging 49, e101–e121 (2019).
5. Sarwar, M. S., Simon, U. & Dimartino, S. Experimental investigation and mass transfer modelling of 3D printed monolithic cation exchangers. J. Chromatogr. A 1646, 462125 (2021).
6. Chan, Y. W., Kansil, T. & Ongkudon, C. M. Analytical and preparative polymethacrylate monolith fabrication: effect of porogen content and column size on pore morphology. Colloid Polym. Sci. 295, 2373–2382 (2017).
7. Georgiou, L., Wilson, D. J., Sharma, N., Perren, T. J. & Buckley, D. L. A functional form for a representative individual arterial input function measured from a population using high temporal resolution DCE MRI. Magn. Reson. Med. 81, 1955–1963 (2019).
8. Clancy, U. et al. Rationale and design of a longitudinal study of cerebral small vessel diseases, clinical and imaging outcomes in patients presenting with mild ischaemic stroke: Mild Stroke Study 3. Eur. Stroke J. 6, 81–88 (2021).
Figures