2718
CEST MRI at 7T using an optimized parallel transmission saturation scheme1NeuroSpin, CEA, Saclay, France, 2Paris-Saclay University, Gif-sur-Yvette, France
Synopsis
Compared to the traditional circular polarization (CP) transmission mode, parallel transmission (pTx) excitation allows significant gains in contrast and homogeneity for Chemical Exchange Saturation Transfer (CEST) imaging. Using an in-house developed CEST-EPI sequence incorporating a pTx optimized CEST saturation block, we show that both tailored and universal pTx pulses provide significant improvement at 7T for APT-CEST, GluCEST and GlucoCEST imaging and enable saturation powers unattainable with CP.
Introduction
The use of Chemical Exchange Saturation Transfer (CEST) for the enhanced detection of various brain metabolites has been already demonstrated1-3. To reduce artifactual spatial variations in the CEST contrast introduced by B1+ inhomogeneity, post processing algorithms4,5 or parallel transmission6,7 (pTX) solutions have been proposed. In this study, we use pTX at 7T to achieve a more intense and homogenous saturation than when using circular polarization (CP) while respecting the Specific Absorption Rate (SAR) constraints. Validated virtual observation points (VOPs) with the NOVA (Wilmington, MA, USA) pTx coil were employed to boost performance compared to the conservative power limits normally used (“protected” mode).Materials and Methods
All measurements were performed on a 7T Magnetom Scanner (Siemens Healthcare, Erlangen, Germany) with the NOVA 8Tx-32Rx channels head coil using an in-house developed 2D-CEST-EPI sequence. The CEST saturation module was composed of two interleaved8 pTx pulses (Figure 1). The optimization of the pTx modes consisted in the minimization of least square error to a target B1rms under local SAR, global SAR and RF power limitations, using previously acquired B1+ maps. For all channels, the pulses were Hanning-windowed Gaussians of 50ms duration. VOPs included several safety factors9 while imposing power limits of 3W (per channel) and 16W (total).Phantom and volunteer experiments
A realistic head phantom10 consisting of two compartments was filled with 10mM glucose (inner compartment) and 15mM creatine (outer compartment) in agarose. Both compartments contained 4g/L NaCl and 64μM gadolinium, for a relaxation time T1 of 1600ms, and were adjusted to pH 7.0. Before the experiments, the phantom was warmed up to 37°C. For the in vivo investigations, 4 healthy volunteers were recruited after providing informed written consent. The study was approved by the local IRB.
CEST acquisitions
Single slice, 4mm thick, CEST images were acquired with an in-plane resolution of 3.4x3.4mm2. Z-spectra were sampled with 41 saturation offsets from -5ppm to 5ppm and an additional one for reference at -10ppm. For in vivo experiments, circular polarization (CP), universal pulses11 (UPs) and single subject Tailored pulses (TP) were tested. UPs were designed before the acquisition on a dataset consisting of B1+maps from 15 individuals and were used as such whereas the TPs were designed using a B1+ map acquired using the interferometric turbo-FLASH method12 at the beginning of the exam.
For GlucoCEST, the saturation module consisted of 20 pulses of 1.12s saturation duration and a target B1rms of 1.5μT. The maximum reachable B1rms in CP mode was 1.2μT on the imaged slice. For GluCEST, the saturation was made with 16 pulses of 0.9s total duration and a target B1rms of 3μT. In this case the maximum attainable B1rms was 1.7μT for the CP mode. GluCEST images were only acquired in vivo.
For each dataset, a low saturation acquisition was also performed and used for WASSR13 B0 correction (21 saturation offsets from -1ppm to 1ppm, mean B1rms=0.15μT).
Data analysis
Within slice motion and distortion correction was implemented using SPM12. Subsequently, the image series was B0 corrected and MTRasym maps were calculated voxel by voxel according to
$$ MTR_{asym}(\Delta\omega)=\frac{S(-\Delta\omega)-S(\Delta\omega)}{S_{ref}} $$
Results
Phantom resultsFigure 2 shows simulated B1rms profiles for both CP and pTx-TP mode for a target mean B1rms of 1.5μT (A) and the measured GlucoCEST MTRasym maps (B) on a transversal slice located +5mm from isocenter. The MTRasym map obtained with the pTx-TP mode is more homogeneous than with CP, with a relative standard deviation across the slice of 13% vs 32%. In addition, the pTx-TP mode enables good CEST contrast at the borders of the brain, which is not the case for the CP mode. Figure 3 shows a comparison between Z-spectra obtained in two different ROIs using the CP and pTx-TP modes. The spectra acquired with pTx-TP mode are almost identical, as it is expected for a homogeneous phantom, whereas for CP, they are very different with a significant difference of the FWHM of water peak between the two ROIs (more than double).
In vivo results
Figure 4 presents GlucoCEST MTRasym maps obtained with CP, pTx-UP and pTx-TP modes in which the benefits of pTx over CP are evident. For both UP and TP, saturation with a homogenous B1rms (relative STD of 8% and 4%, respectively compared to 18% for CP) leads to an increased contrast compared to CP. We notice that TPs present a slight contrast improvement as compared to UPs, not only between brain tissue and CSF but also between gray and white matter. Similar performance was also obtained for APT-CEST and GluCEST imaging. Figure 5 presents examples of GlucoCEST, GluCEST and APT-CEST MTRasym maps fused with the anatomical image.
Discussion and conclusion
The use of pTx for CEST acquisitions provides more homogenous and contrasted images and allows levels of saturation not permitted with the CP mode. Compared to ref [6] our approach is simpler offering in the same time more flexibility than the development presented in [7]. Although the single subject tailored pulses perform slightly better than the universal pulses, the latter have the advantage of considerably simplifying the workflow while still significantly outperforming the CP mode.Acknowledgements
We acknowledge funding from ANR (project fMETAMR) and Leducq Foundation (Large Equipment ERPT program, NEUROVASC7T project).References
[1] Yadav NN, Xu J, Bar-Shir A, et al. Natural D-glucose as a biodegradable MRI relaxation agent. Magnetic Resonance in Medicine 2014;72:823–828.
[2] Cai K, Haris M, Singh A, et al. Magnetic resonance imaging of glutamate. Nat Med 2012;18:302–306.
[3] Jones CK, Schlosser MJ, van Zijl PCM, et al. Amide proton transfer imaging of human brain tumors at 3T. Magnetic Resonance in Medicine 2006;56:585–592.
[4] Windschuh J, Zaiss M, Meissner J-E, et al. Correction of B1-inhomogeneities for relaxation-compensated CEST imaging at 7 T. NMR in Biomedicine 2015;28:529–537.
[5] Sun PZ, Farrar CT, Sorensen AG. Correction for artifacts induced by B0 and B1 field inhomogeneities in pH-sensitive chemical exchange saturation transfer (CEST) imaging. Magnetic Resonance in Medicine 2007;58:1207–1215.
[6] Tse DHY, da Silva NA, Poser BA, et al. B1+ inhomogeneity mitigation in CEST using parallel transmission. Magnetic Resonance in Medicine 2017;78:2216–2225.
[7] Liebert A, Tkotz K, Herrler J, et al. Whole-brain quantitative CEST MRI at 7T using parallel transmission methods and correction. Magnetic Resonance in Medicine 2021;86:346–362.
[8] Liebert A, Zaiss M, Gumbrecht R, et al. Multiple interleaved mode saturation (MIMOSA) for B1+ inhomogeneity mitigation in chemical exchange saturation transfer. Magnetic Resonance in Medicine 2019;82:693–705.
[9] Boulant N, Gras V, Amadon A, et al. (2018) ‘Workflow proposal for defining SAR safety margins in parallel transmission’, in Proceedings of the 26th Annual Meeting of ISMRM. Paris.
[10] Jona G, Furman-Haran E, Schmidt R. Realistic head-shaped phantom with brain-mimicking metabolites for 7 T spectroscopy and spectroscopic imaging. NMR in Biomedicine 2021;34:e4421.
[11] Gras V, Vignaud A, Amadon A, et al. Universal pulses: A new concept for calibration-free parallel transmission. Magnetic Resonance in Medicine 2017;77:635–643.
[12] Amadon A, Cloos M, Boulant N, et al. Validation of a very fast B 1-mapping sequence for parallel transmission on a human brain at 7 T. 2011. In Proceedings of the 20th Annual Meeting of ISMRM, p. 3358.
[13] Kim M, Gillen J, Landman BA, et al. WAter Saturation Shift Referencing (WASSR) for chemical exchange saturation transfer experiments. Magn Reson Med 2009;61:1441–1450.
Figures
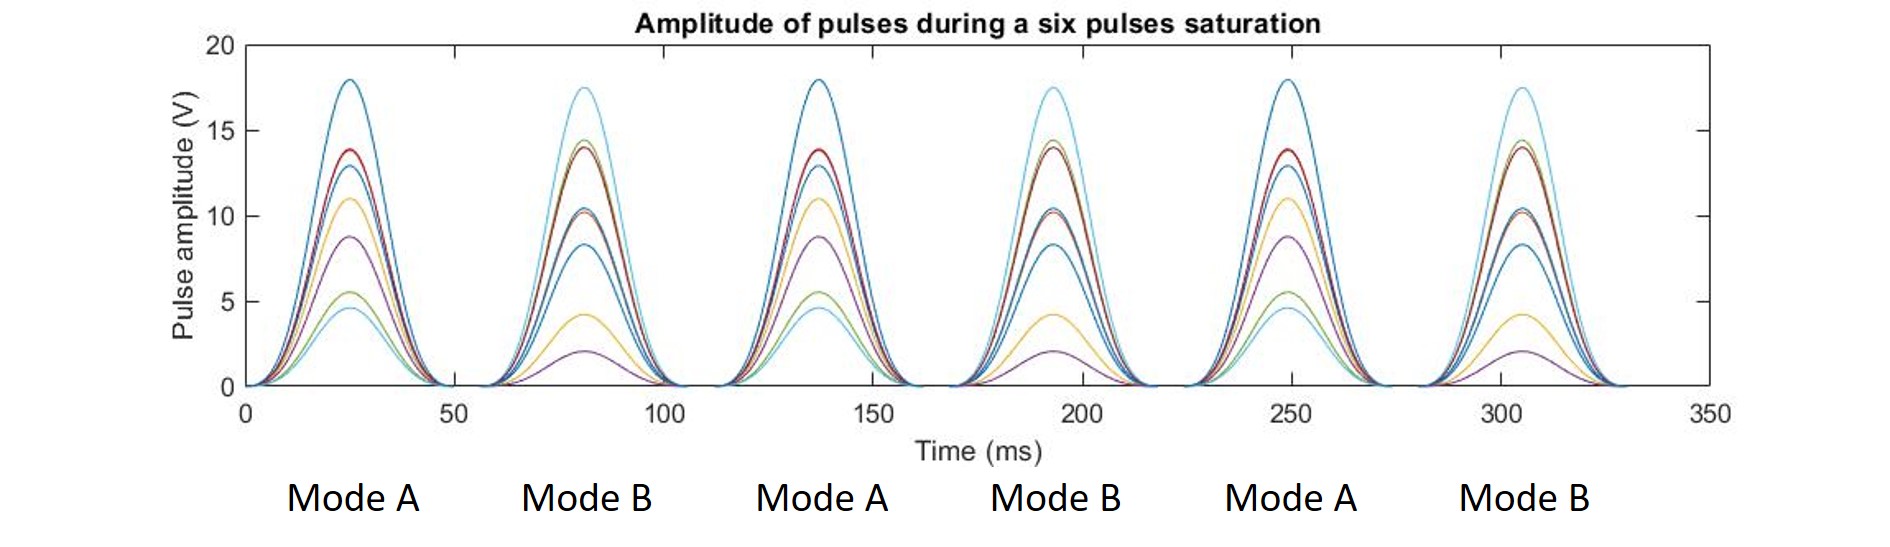
Figure 1 : Example of pulse amplitudes for a six pulse saturation module. Each color represents a different Tx-channel.
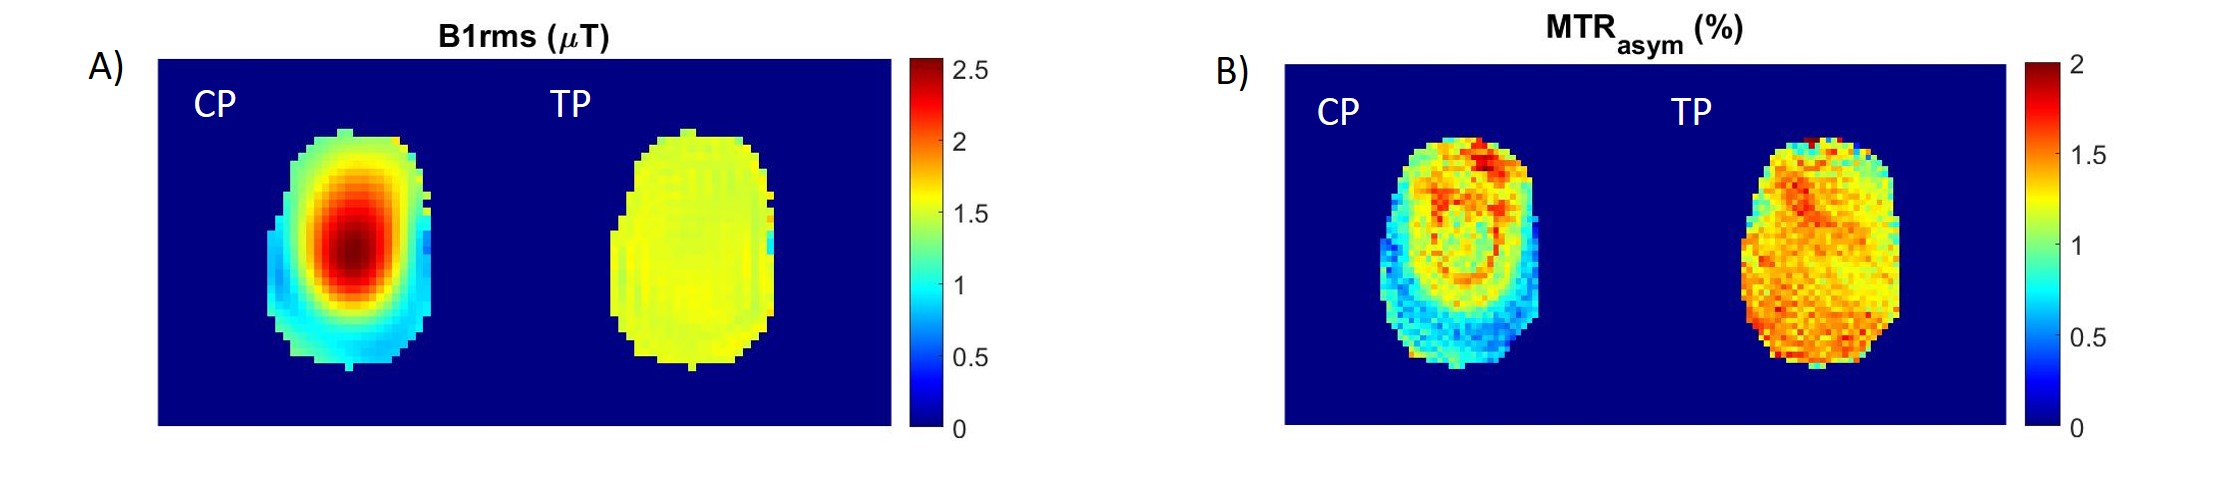
Figure 2: (A) CP (left) and pTx TP (right) simulated B1rms maps for a target mean B1rms of 1.5 μT. (B) Measured GlucoCEST MTRasym (δ=1.25 ±0.25ppm) maps using the CP mode (left) and the pTx TP mode (right).
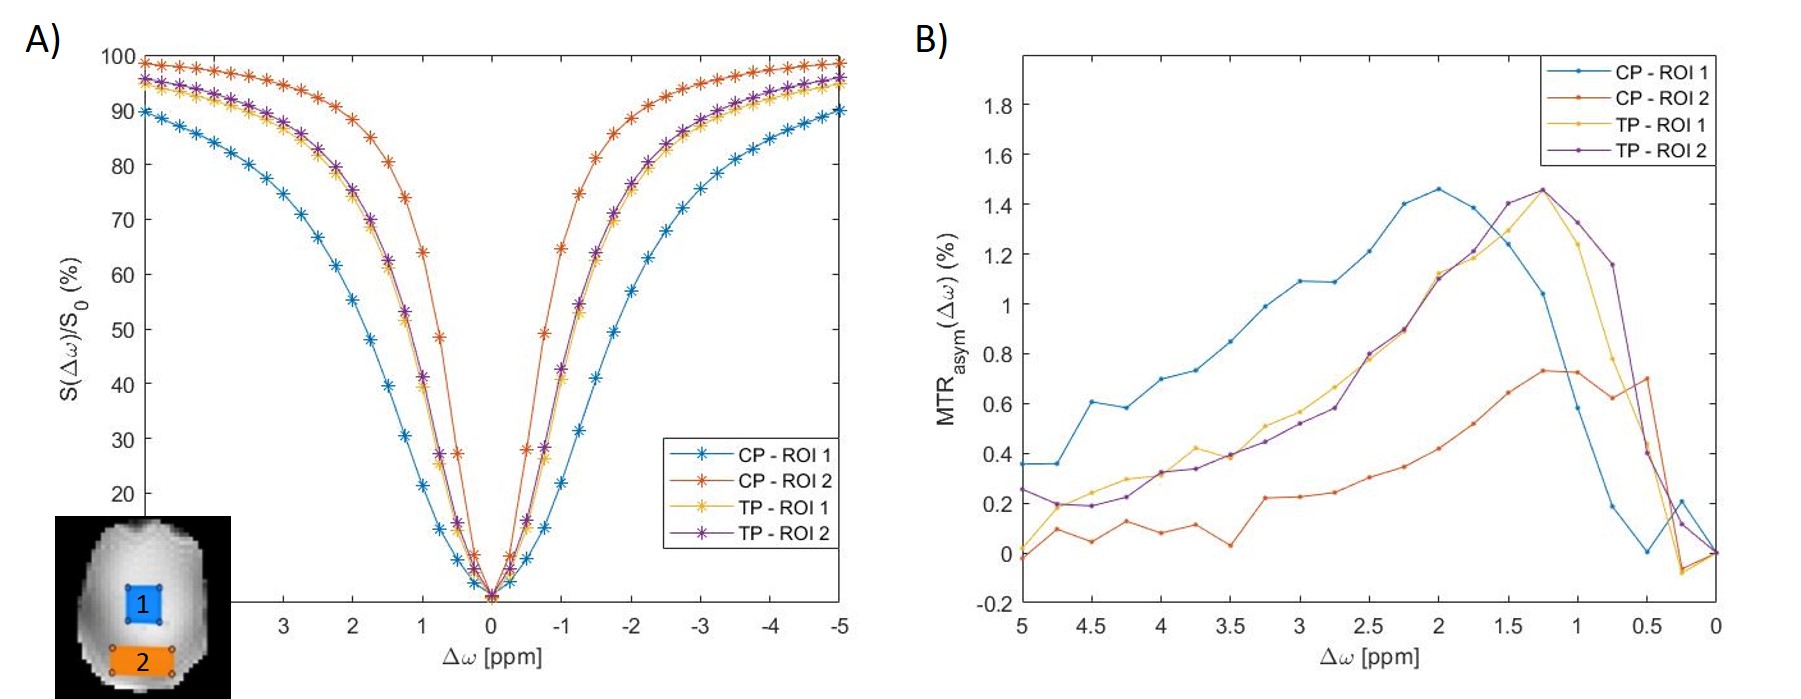
Figure 3: (A) Averaged Z-spectra over the blue and red ROIs obtained with the CP and pTx-TP modes and (B) corresponding MTRasym spectra.
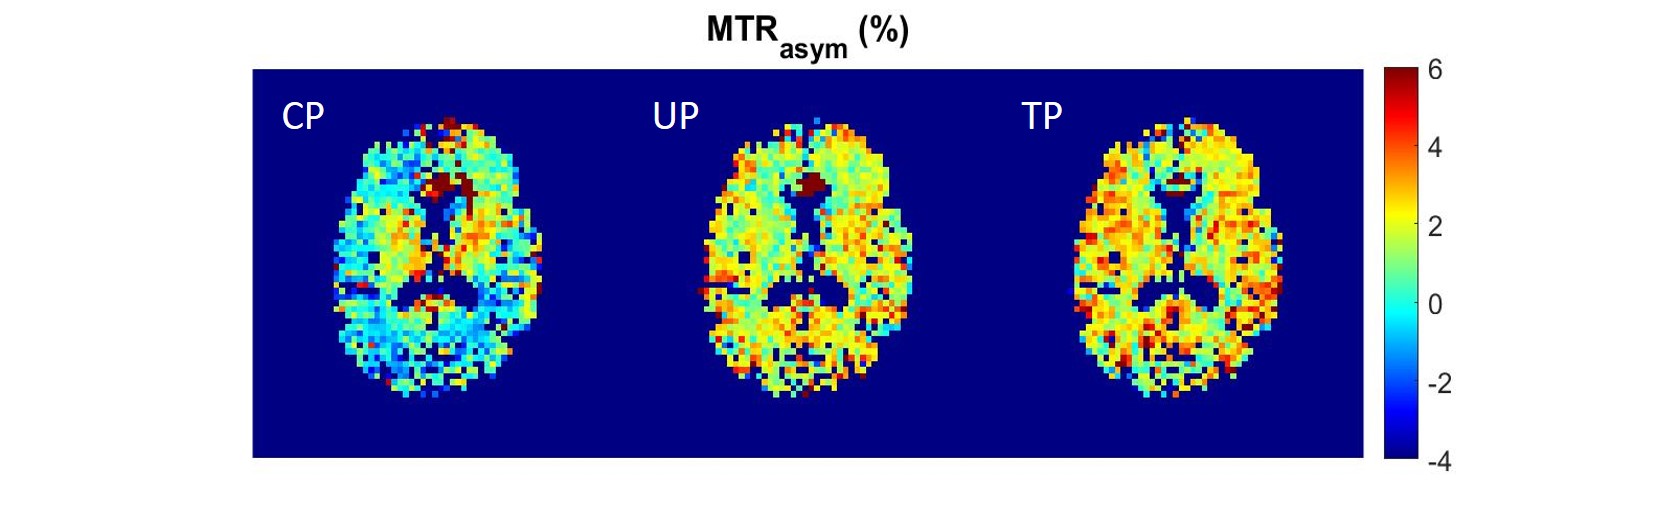
Figure 4: GlucoCEST MTRasym (δ=1.25 ±0.25ppm) maps for CP, pTx-UP and pTx-TP saturation modes.
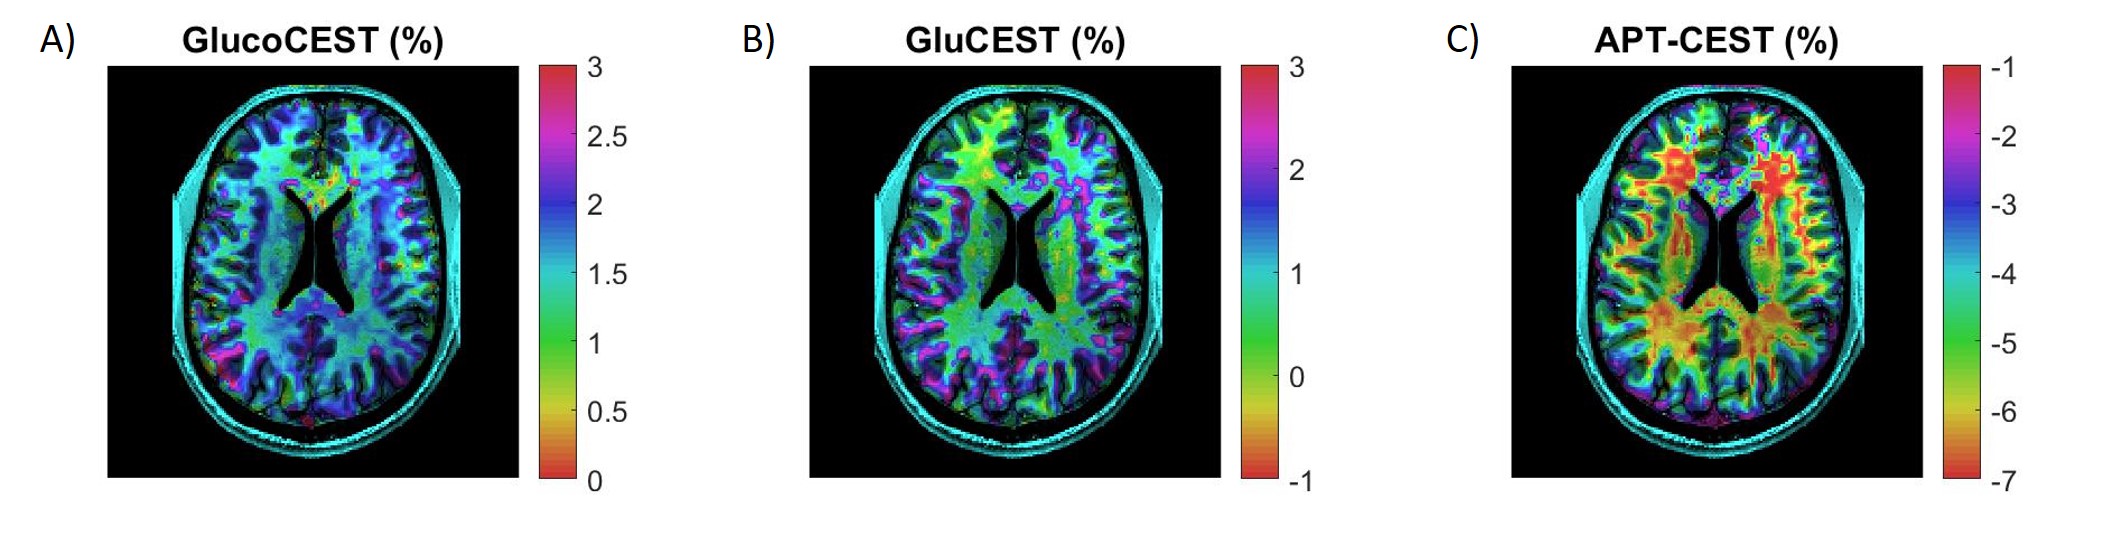
Figure 5: Fusion of (A) GlucoCEST (δ=1.25± 0.25ppm), (B) GluCEST (δ=3.0± 0.25ppm) and (C) APT-CEST (δ=3.5± 0.25ppm) MTRasym maps with anatomical images acquired using pTx single subject TP. The MTRasym maps were linearly interpolated to fit the resolution of the anatomical image. 2D-CEST-EPI parameters for GlucoCEST and APT-CEST: TR/TE=2500/34, CEST saturation module duration: 1.12s. For GluCEST: TR/TE=5000/34, CEST saturation module duration: 0.9s.