2717
Fast WASAB1 post-processing for simultaneous B0 and B1 mapping for CEST imaging use in clinical routine1Department of Research & Innovation, Olea Medical, La Ciotat, France, 2School of Health Sciences, College of Health, Medicine and Wellbeing,, University of Newcastle, Newcastle, Australia, 3Hunter Medical Research Institute, Newcastle, Australia, 4College of Applied Medical Sciences, University of Jeddah, Jeddah, Saudi Arabia, 5School of Psychology, College of Engineering, Science and Environment, University of Newcastle, Newcastle, Australia, 6Department of Neurology, John Hunter Hospital, New Lambton Heights, Australia, 7School of Medicine and Public Health, College of Health, Medicine and Wellbeing, University of Newcastle, Newcastle, Australia, 8CSIRO Health and Biosecurity, Brisbane, Australia, 9The Florey Institute of Neuroscience and Mental Health, Victoria, Australia, 10Murdoch Children's Research Institute, Royal Children's Hospital, University of Melbourne, Victoria, Australia, 11Siemens Healthcare GmbH, Erlangen, Germany, 12Department of Neuroradiology, University Clinic Erlangen, Friedrich-Alexander Universität Erlangen-Nürnberg (FAU), Erlangen, Germany
Synopsis
This work provides a new method for fast post-processing of MRI data acquired using the WASAB1 sequence for simultaneous B0 and B1 mapping, used in CEST imaging for field inhomogeneity corrections. We are proposing a new processing method with outstanding acceleration of the parameter estimation procedure, without compromising the stability of the estimation. The stability of the method is demonstrated on phantom data and in vivo 3 Tesla clinical data.
Introduction
Inhomogeneities of the static magnetic field and radiofrequency transmit is unavoidable in MRI, causing distortions in the intensity of the acquired MR images. To increase the quality of the obtained intensities, accurate determination of the spatial distribution of those fields is required. Chemical Exchange Saturation Transfer (CEST) imaging1, a molecular MRI technique nowadays available also on clinical 3T MRI scanners, is also affected by inhomogeneities of the static magnetic (B0) and radiofrequency (RF) transmit (B1) fields.Some sequences have been proposed for separate B02,3 and B14 mapping, but in5,a unique sequence is described for mapping both inhomogeneity maps, called “Simultaneous mapping of Water Shift And B1 (WASAB1)” (Figure1A,Figure1B).
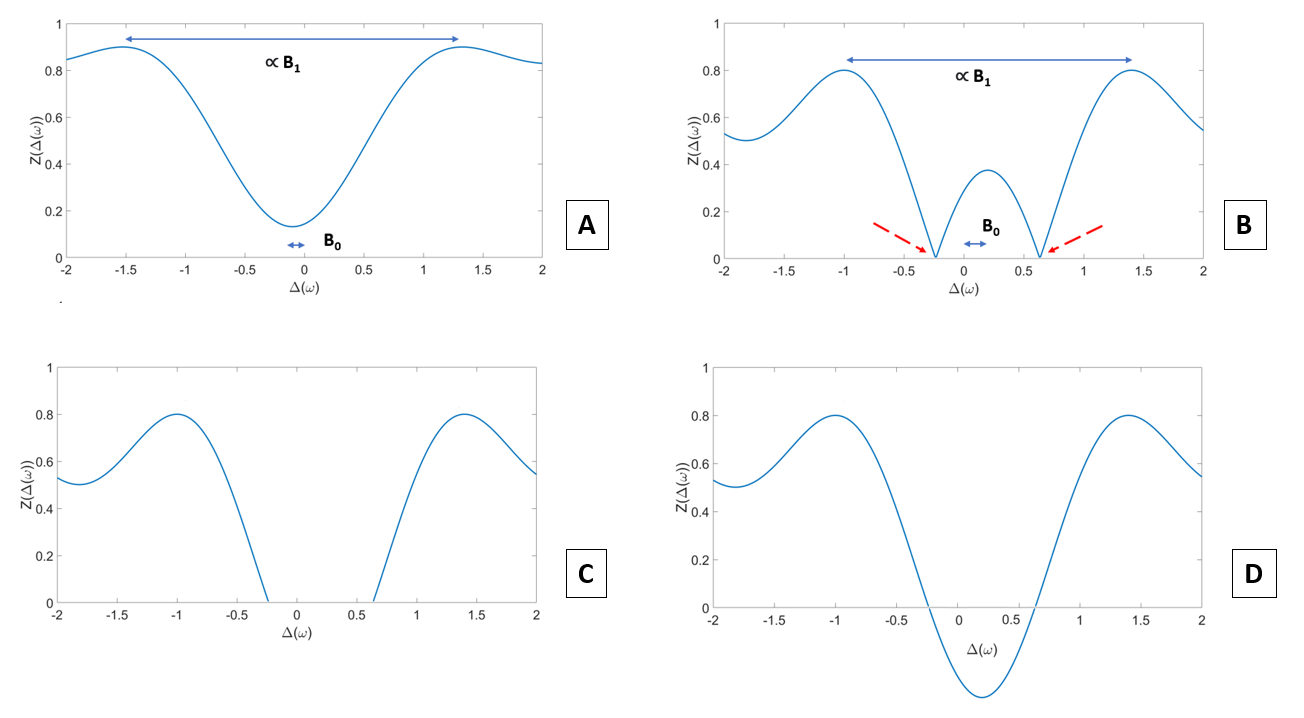
Sampling of several frequency offsets $$$\Delta(\omega)$$$ around the water resonance frequency, a WASAB1-Spectrum is acquired and normalized using a M0 image whose frequency is far from the water one. The WASAB1 normalized intensities Z(Δω) of a single voxel can be modelled based on the Bloch equations as5,6 :
$$ Z(\Delta\omega)=|c-d\cdot f(B_0,B_1,\Delta(\omega))| \;\;\;\;\;\;\;\;\;\; (1)$$
with
$$f(B_0,B_1,\Delta(\omega))=\sin^2\left(\tan^{-1}\left(\frac{\bar\gamma \cdot B_1}{freq\cdot(\Delta\omega-B_0)}\right)\right) \cdot sin^2\left(\left(\left ( \frac{\bar\gamma \cdot B_1}{freq}\right)+(\Delta\omega-B_0)^2\right)^{\frac{1}{2}} \cdot\frac{t_p}{2}\right) \;\;\;\;\;\;\;\;\;\;(2)$$
where parameters c and d describe WASAB1-Spectra amplitude, B1 its periodicity, B0 its symmetry axis ($$$freq=123MHz$$$ at 3T, $$$\bar\gamma=42.578MHz/T,t_p=5.12ms$$$) (see Figure1A).
B0 and B1 are estimated by fitting this model for every voxel of the WASAB1 images. However, the parameter estimation is difficult and unstable due to the presence of the absolute value in Equation1, that models the acquired MRI-magnitude and introduces discontinuity in the model.
The classical WASAB1 postprocessing method proposed in5 consists of two steps: i) exhaustive search on a coarse parameter grid; ii) refinement of the solution with a nonlinear optimization algorithm. However, it significantly increases the computational time of the model fitting, that is prohibitive in clinical use.
Methods
Technical Solution:Our proposed method is divided in two steps. For each voxel: i) retrieve the sign of some data points of the WASAB1-Spectra to generate a polarized dataset, ii) knowing the sign of the signal, the absolute value in Equation1 can be removed and the model becomes linear in parameters c and d. Hence, the variable projection method7 can be applied to reduce the dimensionality of the nonlinear estimation problem. This makes the estimate of B0 and B1 faster by two orders of magnitude, more robust, and less sensitive to local minima.
The polarized dataset is constructed by removing the data points that are unlikely to be positive (Figure1C). It is an iterative process that starts at the extremities of the WASAB1-Z-spectra. Moving toward the central frequency offsets of the spectrum, it extrapolates the WASAB1-Z-spectra at the next frequency offset and checks if the predicted value is likely to be positive or negative. The extrapolated value at the ith offset is constructed as $$$Z_i=Z_{i-1}-\delta$$$, where $$$\delta$$$ is the maximum signal variation between two offsets in the current spectra. This yields a partial polarized WASAB1-Z-spectrum, from which first guess of B0 and B1 can be estimated. Those approximations are then used to refine the sign of the signal on the whole spectra, which is eventually used to derive the definitive estimate of B0 and B1 (Figure1D).
Data Simulation:
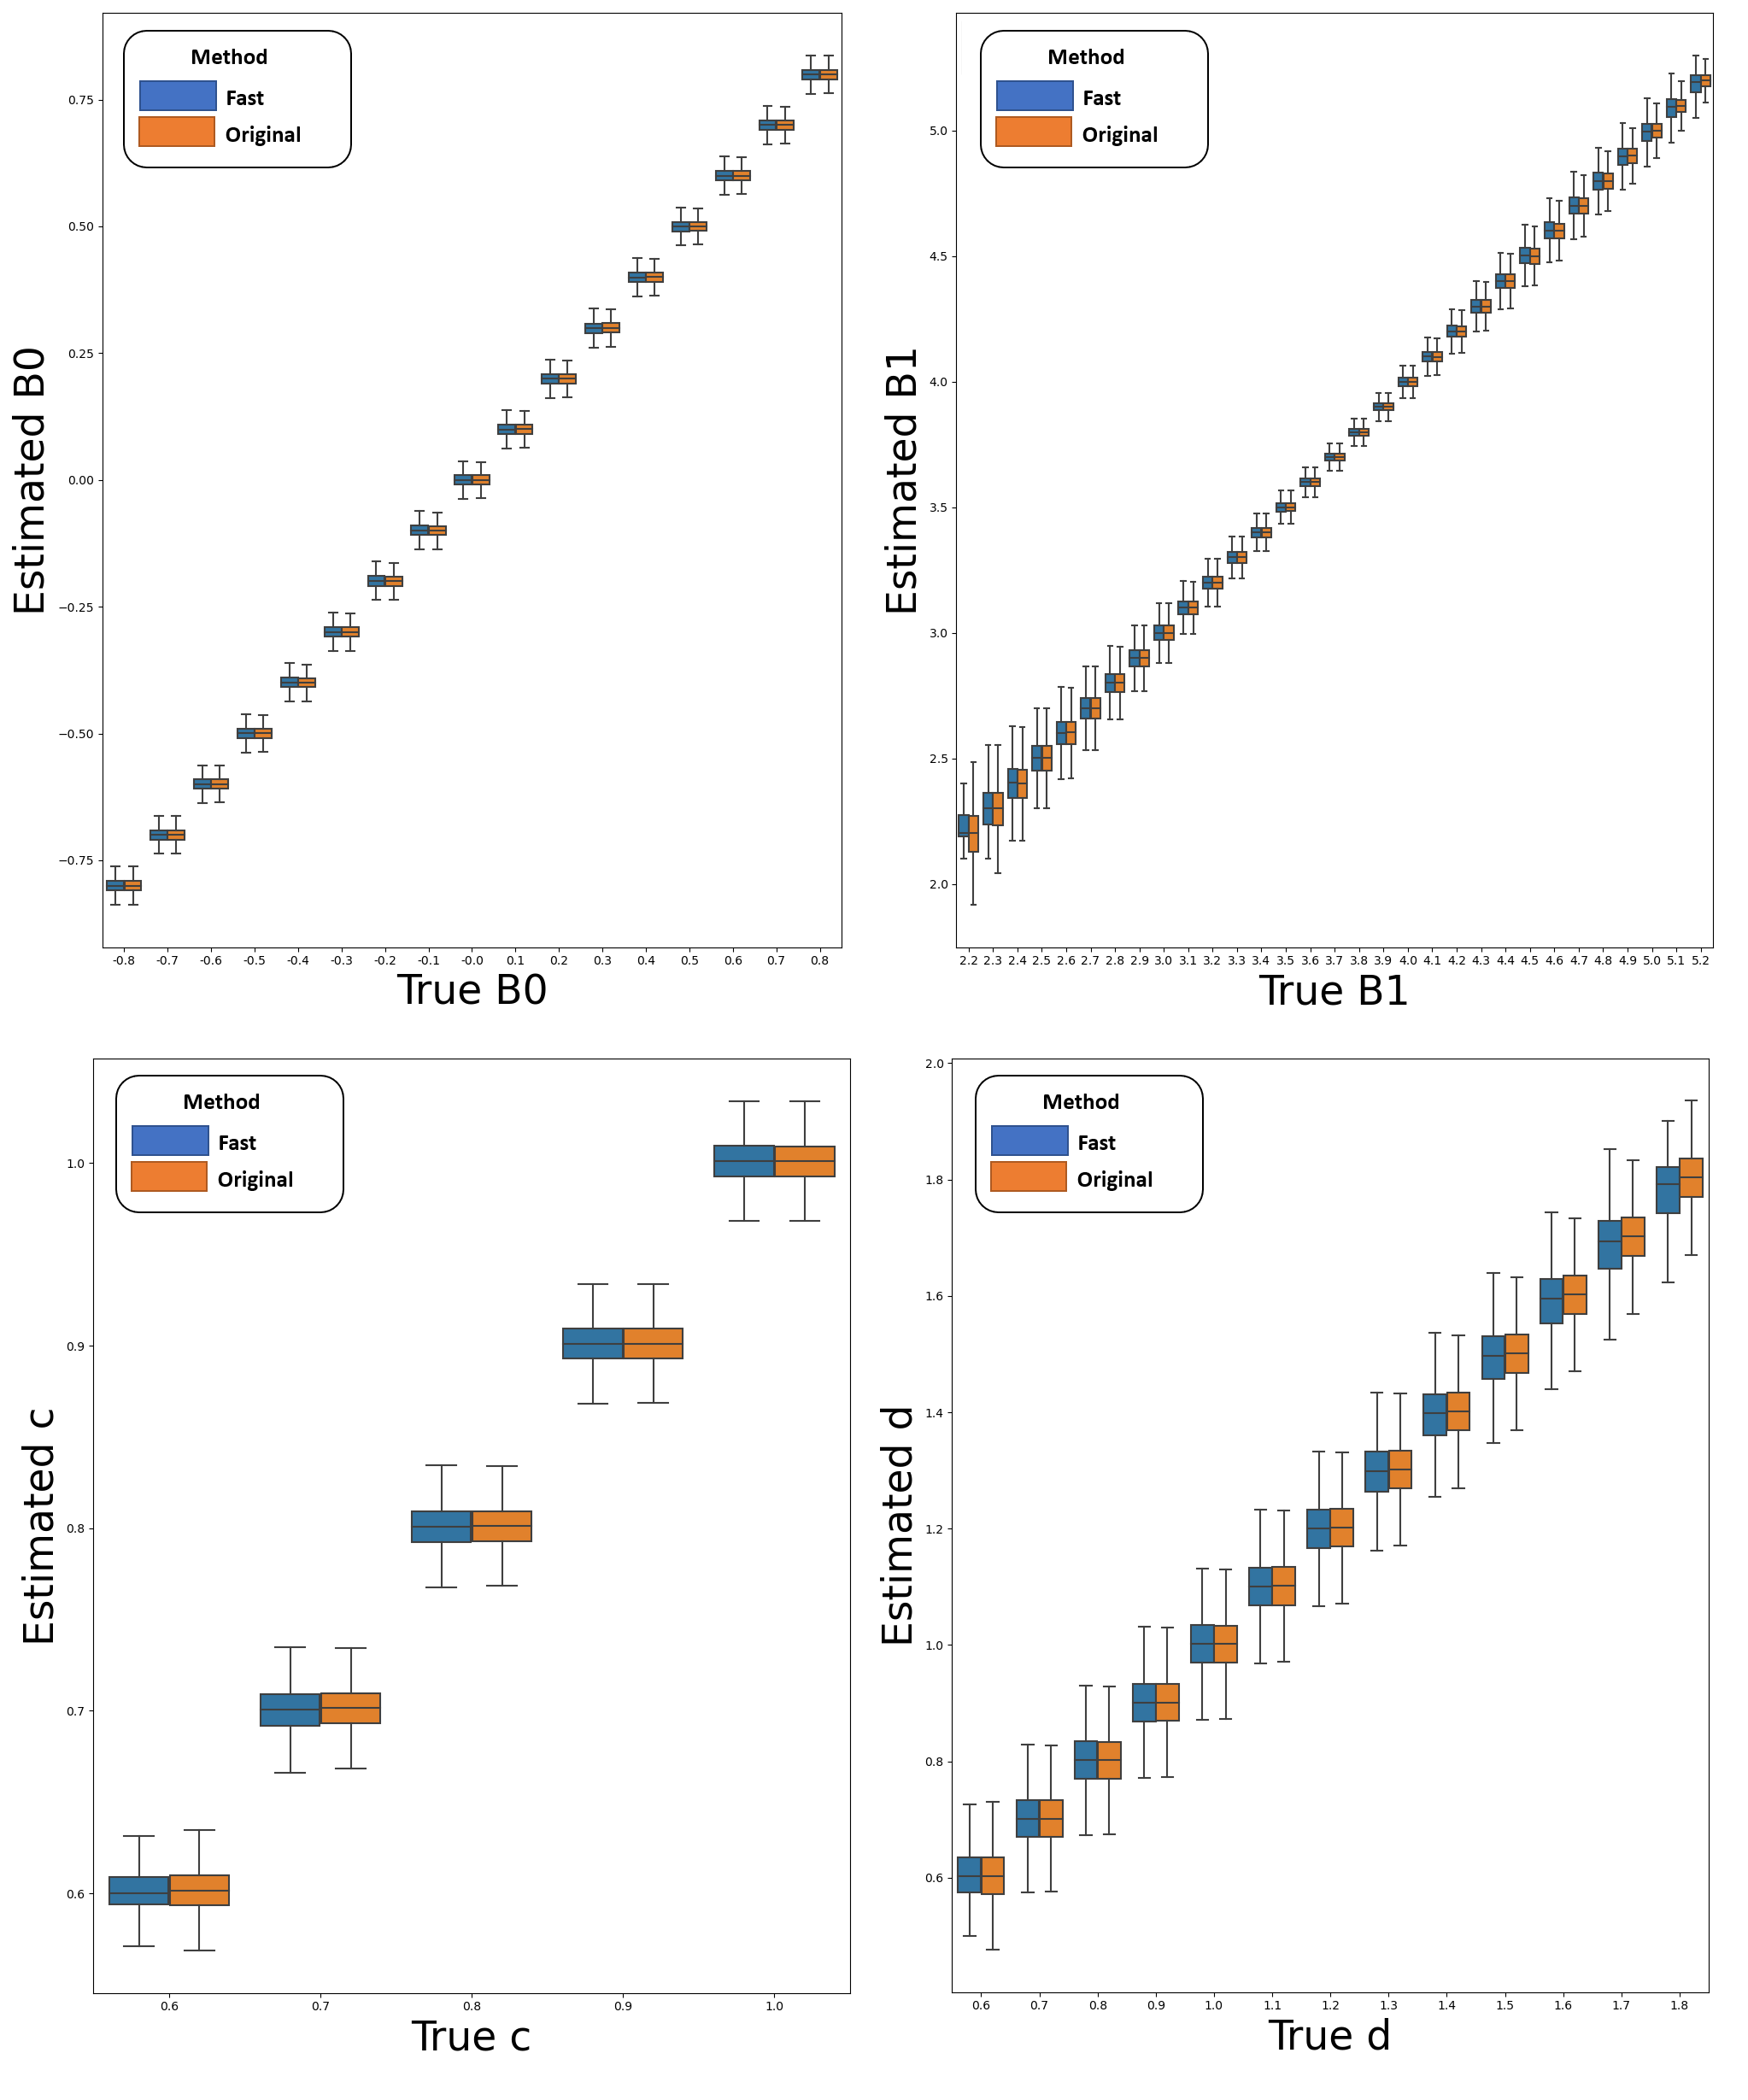
To evaluate the robustness of the proposed method, WASAB1-Z-Spectra were generated applying Equation1 for the following parameter space: $$$c=[0.6:0.1:1]$$$, $$$d=[0.6:0.1:1.8]$$$, $$$B_1=[2.2:0.1:5.2]$$$ and $$$B_0=[-0.8:0.1:0.8]$$$. Rician noise was added to the generated WASAB1-Z-Spectra with $$$SNR=30$$$. Finally, the parameter estimation was performed for each voxel of the generated phantom data, using the original5 and the proposed method.
Patient Data Acquisition:
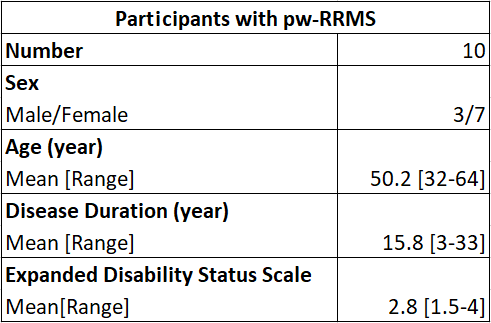
The WASAB1 data were acquired on a 3 Tesla MRI scanner (Prisma, Siemens Healthineers, Germany) equipped with a 64-channel head and neck coil, on 10 persons with relapsing-remitting multiple sclerosis (pw-RRMS), in the framework of a clinical CEST study (Figure2). The WASAB1 sequence (WIP816B) used a 3D snapshot-GRE with the following parameters: FOV=220×180mm2; matrix=128×104; voxel size=1.7×1.7×5mm3; slices=12; TE=2.00ms; TR=4.5ms; bandwidth=700 Hz/pixel; flip angle=6°; 23 WASAB1-volumes acquired at $$$\Delta\omega_i=-1.8ppm:0.16ppm:1.8ppm+M_0$$$ with 1 rectangular preparation pulse tp/tdelay=5.12/100ms; acquisition time=123sec.
Processing:
The acquired WASAB1 sequences were motion-corrected using SimpleElastix8, skull-stripped, normalized by M0, then processed by self-written Python code for the classic5,6 and our proposed method.
Results
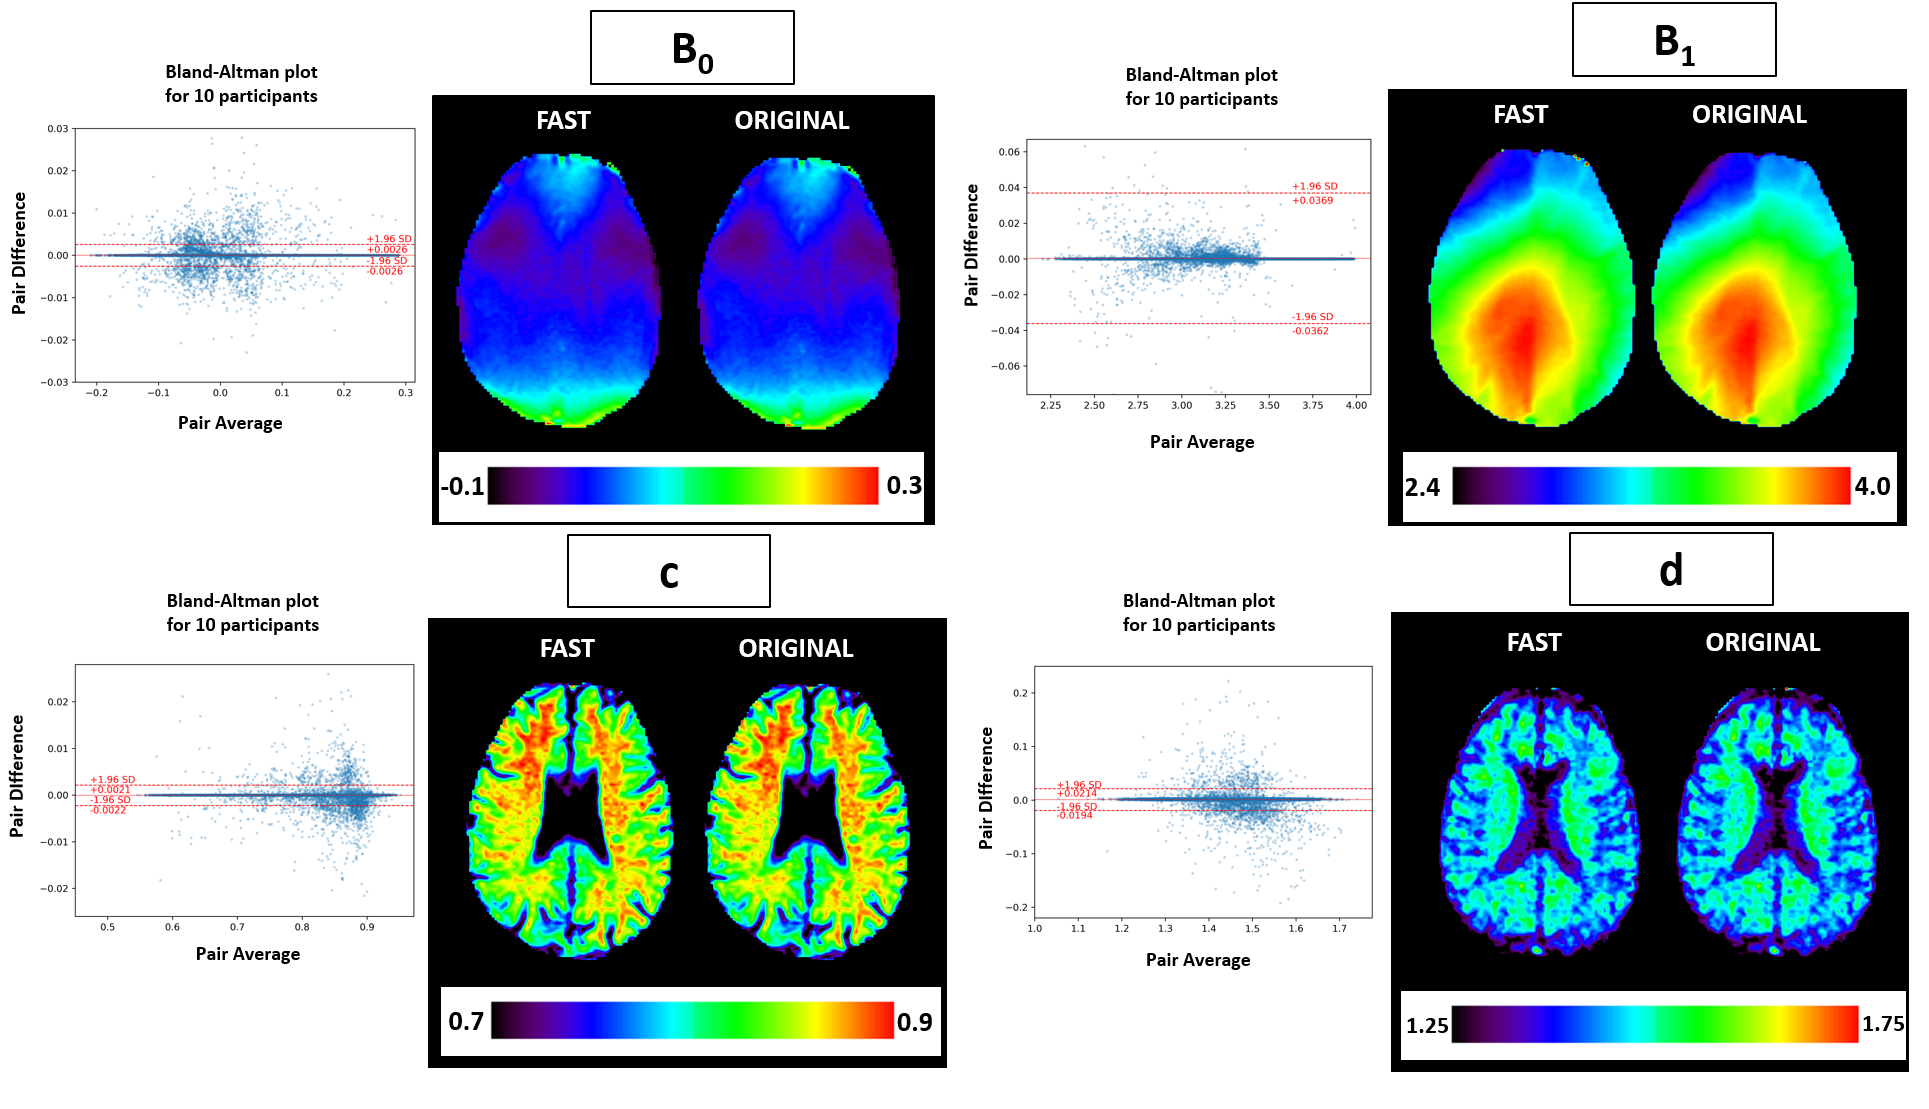
Both the evaluation on the generated phantom data (Figure3) and on the in vivo 3 Tesla data (Figure4) showed that our proposed method is in good agreement with the original WASAB1 method5, with Figure4 showing differences between the estimated values of maps of each method below 0.02 for the majority of pairs in the Bland-Altman plots.Figure5 shows a clinical Amide Proton Transfer weighted (APTw)1 CEST map, B0-B1 corrected9 with the inhomogeneity maps processed with our method, of one person with pw-RRMS.
Discussion
Our method led to an average computation time of 0.0007 seconds for a single WASAB1-Z-Spectrum compared to 18.3 seconds for the reference method. Using parallel execution on the same 8-core processor an entire WASAB1 clinical multi-volume was processed in less than 5 seconds in Olea Sphere 3.0 (Olea Medical, La Ciotat, France).Conclusion
A new accelerated post-processing method has been proposed for simultaneous B0 and B1 mapping based on the WASAB1 sequence. Its outstanding acceleration permits its use in clinical routine for CEST inhomogeneity correction, without compromising the stability of the estimated B0 and B1 maps.Acknowledgements
The clinical study was kindly supported by MS Research Australia. I.Khormi was supported by a PhD scholarship with annual grant support from the University of Jeddah, Saudi Arabia.References
1-Wu B, Warnock G, Zaiss M, Lin C, Chen M, Zhou Z, Mu L, Nanz D, Tuura R, Delso G. An overview of CEST MRI for non-MR physicists. EJNMMI physics. 2016 Dec;3(1):1-21.
2-Togao, O., Keupp, J., Hiwatashi, A., Yamashita, K., Kikuchi, K., Yoneyama, M., & Honda, H. (2017). Amide proton transfer imaging of brain tumors using a self-corrected 3D fast spin-echo dixon method: Comparison with separate B0 correction. Magnetic Resonance in Medicine, 77(6), 2272–2279.
3-Kim, M., Gillen, J., Landman, B. A., Zhou, J., & van Zijl, P. C. M. (2009). Water saturation shift referencing (WASSR) for chemical exchange saturation transfer (CEST) experiments. Magnetic Resonance in Medicine, 61(6), 1441–1450.
4-Insko, E. K., & Bolinger, L. (1993). Mapping of the Radiofrequency Field. Journal of Magnetic Resonance, Series A, 103(1), 82–85.
5-Schuenke, P., Windschuh, J., Roeloffs, V., Ladd, M. E., Bachert, P., & Zaiss, M. (2017). Simultaneous mapping of water shift and B 1 (WASABI)—Application to field-Inhomogeneity correction of CEST MRI data. Magnetic Resonance in Medicine, 77(2), 571–580.
6-https://www.cest-sources.org/doku.php
7-Golub G, Pereyra V. Separable nonlinear least squares: the variable projection method and its applications. Inverse problems. 2003 Feb 14;19(2):R1.
8-Marstal, K., Berendsen, F., Staring, M., & Klein, S. (2016). SimpleElastix: A user-friendly, multi-lingual library for medical image registration. Proceedings of the IEEE Conference on Computer Vision and Pattern Recognition Workshops, 134–142.
9-Windschuh J, Zaiss M, Meissner JE, Paech D, Radbruch A, Ladd ME, Bachert P. Correction of B1‐inhomogeneities for relaxation‐compensated CEST imaging at 7 T. NMR in biomedicine. 2015 May;28(5):529-37.
Figures
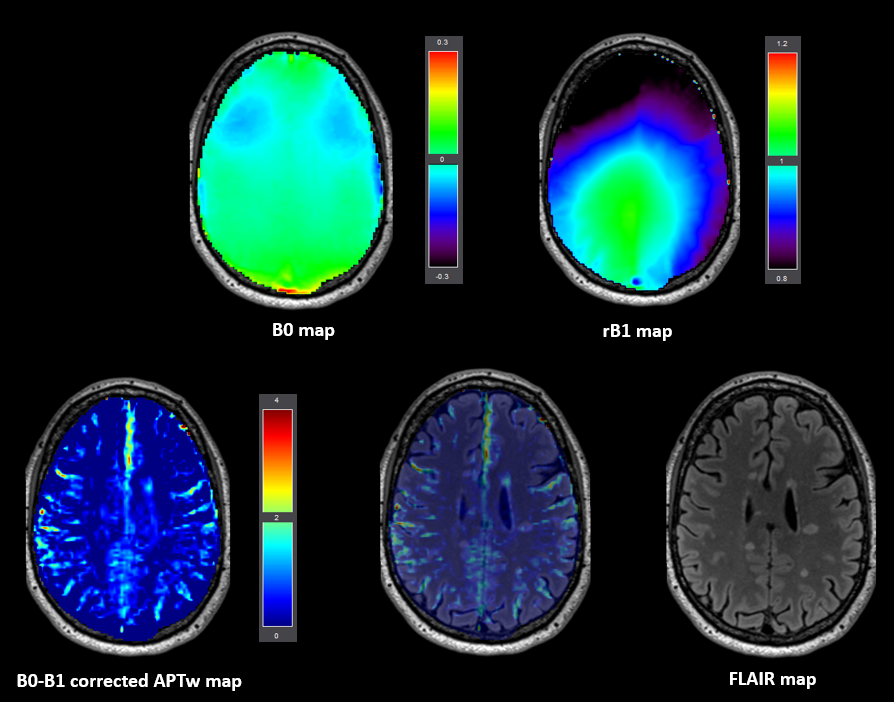
APTw map was corrected9 by B0 and B1 inhomogeneities using B0 and rB1 maps. rB1 was obtained by diving B1 map by WASAB1 sequence RF nominal B1 value (3.7$$$\mu T$$$).