2715
Free-breathing 3D CEST MRI of Human Liver at 3T Using MR Multitasking1Biomedical Imaging Research Institute, Cedars-Sinai Medical Center, Los Angeles, CA, United States, 2Department of Bioengineering, UCLA, Los Angeles, CA, United States, 3Siemens Healthineers, Los Angeles, CA, United States, 4Department of Radiology, Stanford University, Stanford, CA, United States
Synopsis
We developed a 3D abdominal CEST MRI technique at 3T using MR Multitasking, which enables entire-liver coverage with free-breathing acquisition. By exploiting the correlation among images throughout the spatial, time, frequency offset, and respiration dimensions, the low-rank tensor framework shows the possibility to acquire the whole Z-spectrum of 53 frequency offsets within 11 min.
Introduction
Chemical exchange saturation transfer (CEST) imaging is a novel MRI technique that allows indirect detection of exchangeable protons in the water pool. In recent years, several studies have explored various CEST applications in the liver, such as amide proton transfer weighted (APTw) imaging1-4, glycogen CEST (glycoCEST) imaging2,3, and glycogen NOE (glygoNOE) imaging5. However, CEST MRI of the liver in human studies is still challenging. Breath-holding is currently needed to reduce motion artifacts1-4, limiting spatial resolution and coverage. Even with multiple breath holds, 3D coverage would require an impractically long scan time.Steady-state CEST (ss-CEST) is a method that performs pre-saturation and k-space sampling in an interleaved pattern with repeated modules6. Recently, we developed a ss-CEST method in the brain using MR Multitasking to accelerate image acquisition and enhance image quality7,8. In this work, we propose a novel respiration-resolved 3D abdominal Multitasking ss-CEST technique at 3.0 T, which enables whole-liver coverage with free-breathing acquisition. The feasibility of APTw and glycoCEST imaging were evaluated in healthy volunteers.
Methods
Image acquisitionFig. 1 illustrates the proposed pulse sequence and k-space sampling pattern7. Each ss-CEST module contains a single-lobe Gaussian saturation pulse (tsat = 30 ms, effective B1 = 0.93 μT), followed by a spoiler gradient and eight 5° FLASH readouts. The center k-space line in the superior-inferior direction was acquired as training data.
Image reconstruction
The abdominal CEST image is modeled as a 6D image $$$a(\textbf{x},z,\tau,r)$$$, with voxel location $$$\textbf{x}$$$, pre-saturation frequency offset $$$z$$$, time within each frequency offset $$$\tau$$$, and respiratory motion phase $$$r$$$. Due to high correlation along all dimensions, it can be modeled as a 4-way low-rank tensor $$$\mathcal{A}$$$: $$\mathcal{A}=\mathcal{G}\times_1{\textbf{U}_{\textbf{x}}}\times_2\textbf{U}_{z}\times_3\textbf{U}_{\tau}\times_4\textbf{U}_{r}$$ where columns of each $$$\textbf{U}_{\textbf{x}}$$$, $$$\textbf{U}_{z}$$$, $$$\textbf{U}_{\tau}$$$ and $$$\textbf{U}_{r}$$$ contain basis functions for space, frequency offset, approach to steady-state, and respiratory motion respectively. $$$\mathcal{G}$$$ denotes the core tensor.
The respiratory motion was binned into 5 states with the help of recorded PMU data extracted from Siemens raw data files. $$$\textbf{U}_{\tau}$$$ was predetermined from a Bloch-simulated dictionary. The core tensor $$$\mathcal{G}$$$ and remaining non-spatial basis matrices $$$\textbf{U}_{z}$$$ and $$$\textbf{U}_{r}$$$ were recovered by low-rank tensor completion of the training data7. Then, the spatial bases $$$\textbf{U}_{\textbf{x}}$$$ were reconstructed using the remaining imaging data by wavelet-regularized least-squares fitting to the measured data.
For respiratory motion state $$$i$$$, 3D images of the last time point within each offset frequency (closest to steady-state), i.e., $$$\tilde{a}_{i}(\textbf{x},z)=a(\textbf{x},z,\tau_\max, i)$$$, were extracted for further analysis.
CEST analysis
The central part (|Δω| < 1.0 ppm) of the Z-spectrum was first used to correct for the B0 field inhomogeneity. The CEST effect was quantified with the magnetization transfer asymmetry ratio (MTRasym): $$MTR_{asym}(\Delta\omega) = Z(-\Delta\omega) - Z(\Delta\omega)$$ APTw and glycoCEST values were quantified as MTRasym at 3.5 ppm and 1.0 ppm respectively.
In-vivo experiments
Data were acquired in three healthy volunteers on a 3T MR system (MAGNETOM Vida, Siemens Healthineers). Imaging parameters were: FOV = 384 x 320 x 192 mm3, matrix size = 192 x 160 x 32, spatial resolution = 2.0 x 2.0 x 6.0 mm3. The acquisition time was 11.2 s for each frequency. Images of 53 frequency offsets (from -100 to 100 ppm) were acquired, with prolonged unsaturated acquisition (S0) at the beginning and the end. The total imaging time was 11 min.
Results
Fig. 2 and Fig. 3 represent (A) CEST image at 3.5 ppm, (B) B0 map, (C) APTw map (MTRasym at 3.5 ppm) and (D) glycoCEST map (MTRasym at 1.0 ppm) at the end-expiration state in a healthy volunteer. The axial view and coronal view are displayed in Fig. 2 and Fig. 3 respectively.Fig. 4 shows the distribution of APTw and glycoCEST values within the liver region of the central slice in all three volunteers. The APTw was consistent among different volunteers, but there was more intra-subject variance in glycoCEST values.
Discussion
The Multitasking ss-CEST technique was able to acquire 3D liver CEST images without breath-holds, unlike previous liver CEST methods. The in-plane spatial resolution of 2.0 mm was comparable with previous 2D studies1-3, but the Multitasking 3D slice coverage of 192 mm was much larger, covering the whole liver. APTw values were consistent across healthy volunteers. GlycoCEST values were variable, potentially due to B0 inhomogeneities, since 1.0 ppm is very close to the water frequency. An averaging method with denser frequency offset sampling around 1.0 ppm may reduce glycoCEST variability.These results establish the feasibility of free-breathing 3D CEST in the liver at 3.0 T. Future work will focus on optimizing the saturation power B1, evaluating non-Cartesian readout trajectories to reduce artifacts, incorporating fat suppression modules, and developing application-specific frequency offset sampling patterns. Advanced CEST quantification methods, such as multi-pool fitting or the Lorentzian difference method, will be investigated. Further reduction of total scan time and improvement of the spatial resolution will also be explored.
Conclusion
In conclusion, the proposed 3D abdominal steady-state CEST method using MR Multitasking can generate CEST images of the entire liver during free breathing. It has the potential to push the liver CEST technique towards practical clinical use.Acknowledgements
This work was supported in part by NIH R01 EB028146, R01 AR066517, and R01 HL156818.References
1. Seo N, Jeong HK, Choi JY, Park MS, Kim MJ, Chung YE. Liver MRI with amide proton transfer imaging: feasibility and accuracy for the characterization of focal liver lesions. European Radiology. 2021 Jan;31(1):222-31.
2. Chen SZ, Yuan J, Deng M, Wei J, Zhou J, Wáng YX. Chemical exchange saturation transfer (CEST) MR technique for in-vivo liver imaging at 3.0 tesla. European Radiology. 2016 Jun 1;26(6):1792-800.
3. Deng M., Chen SZ, Yuan J, Chan Q, Zhou J, Wáng YX. Chemical exchange saturation transfer (CEST) MR technique for liver imaging at 3.0 Tesla: an evaluation of different offset number and an after-meal and over-night-fast comparison. Molecular imaging and biology. 2016; 18(2):274-282.
4. Cai K, Singh A, Grasley K, Haris M, Reddy D, Hariharan H, Reddy R. CEST MRI of Human Liver at 3T. In Proceedings of the 19th Annual Meeting of ISMRM, 2011 (p. 2773).
5. Zhou Y, van Zijl PC, Xu X, Xu J, Li Y, Chen L, Yadav NN. Magnetic resonance imaging of glycogen using its magnetic coupling with water. Proceedings of the National Academy of Sciences. 2020 Feb 11;117(6):3144-9.
6. Jones CK, Polders D, Hua J, Zhu H, Hoogduin HJ, Zhou J, Luijten P, Van Zijl PC. In vivo three-dimensional whole-brain pulsed steady-state chemical exchange saturation transfer at 7 T. Magnetic resonance in medicine. 2012 Jun;67(6):1579-89.
7. Han P, Cheema K, Lee H, Zhou Z, Cao T, Ma S, Wang N, Han H, Christodoulou AG, Li D. Whole-Brain Steady-State CEST at 3T Using MR Multitasking. Magnetic resonance in medicine (in press).
8. Christodoulou AG, Shaw JL, Nguyen C, Yang Q, Xie Y, Wang N, Li D. Magnetic resonance multitasking for motion-resolved quantitative cardiovascular imaging. Nature Biomedical Engineering. 2018 Apr;2(4):215-226.
Figures
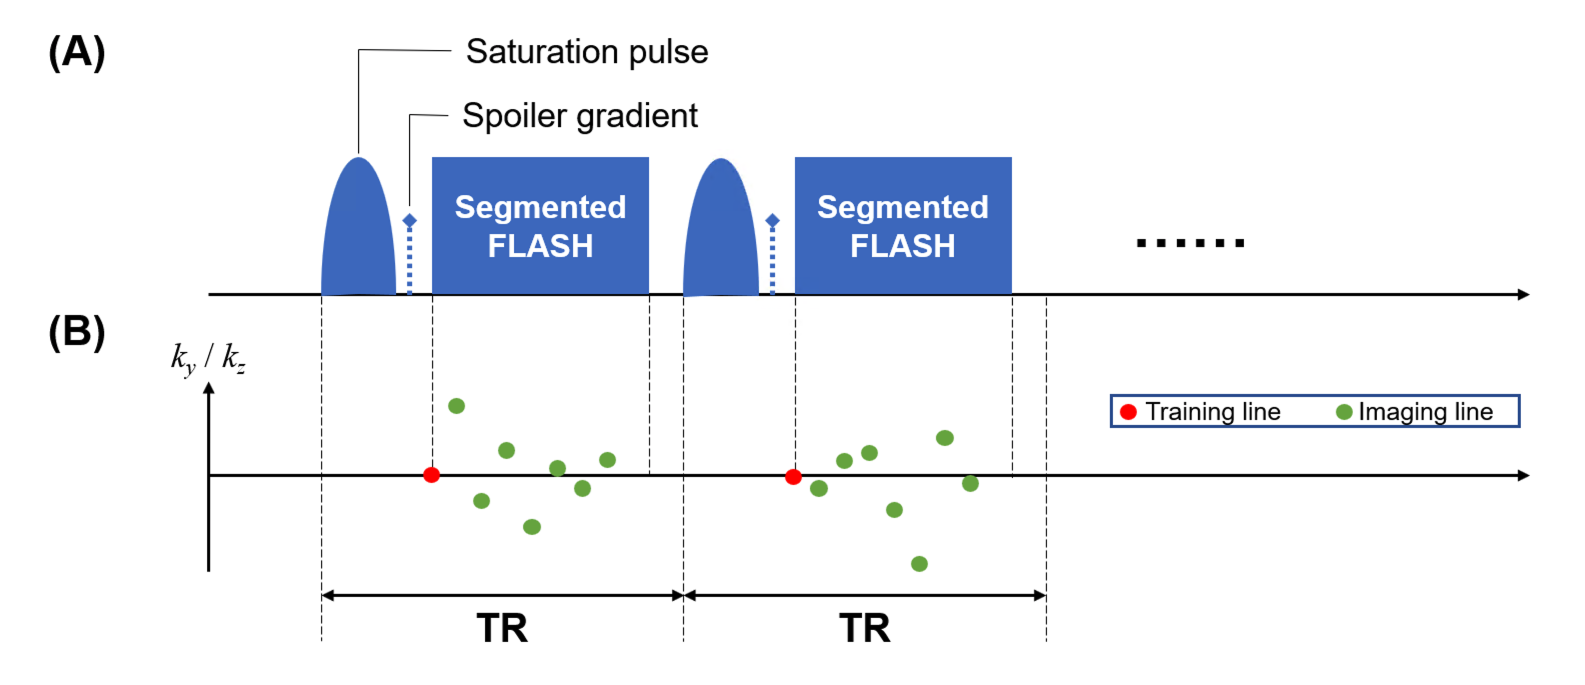
Fig. 1: (A) Sequence design: Each module (TR = 70ms) contains a single-lobe Gaussian saturation pulse (tsat = 30 ms, effective B1 = 0.93 μT) followed by a spoiler gradient and 8 FLASH readout lines (flip angle = 5°). The module repeats at a specific frequency offset and then switches to another. (B) k-space sampling pattern: In each module, the “training line” (center k-space line in SI direction) is first acquired, followed by 7 “imaging lines” (pseudo-randomly sampled lines with Gaussian distribution in ky and kz directions).
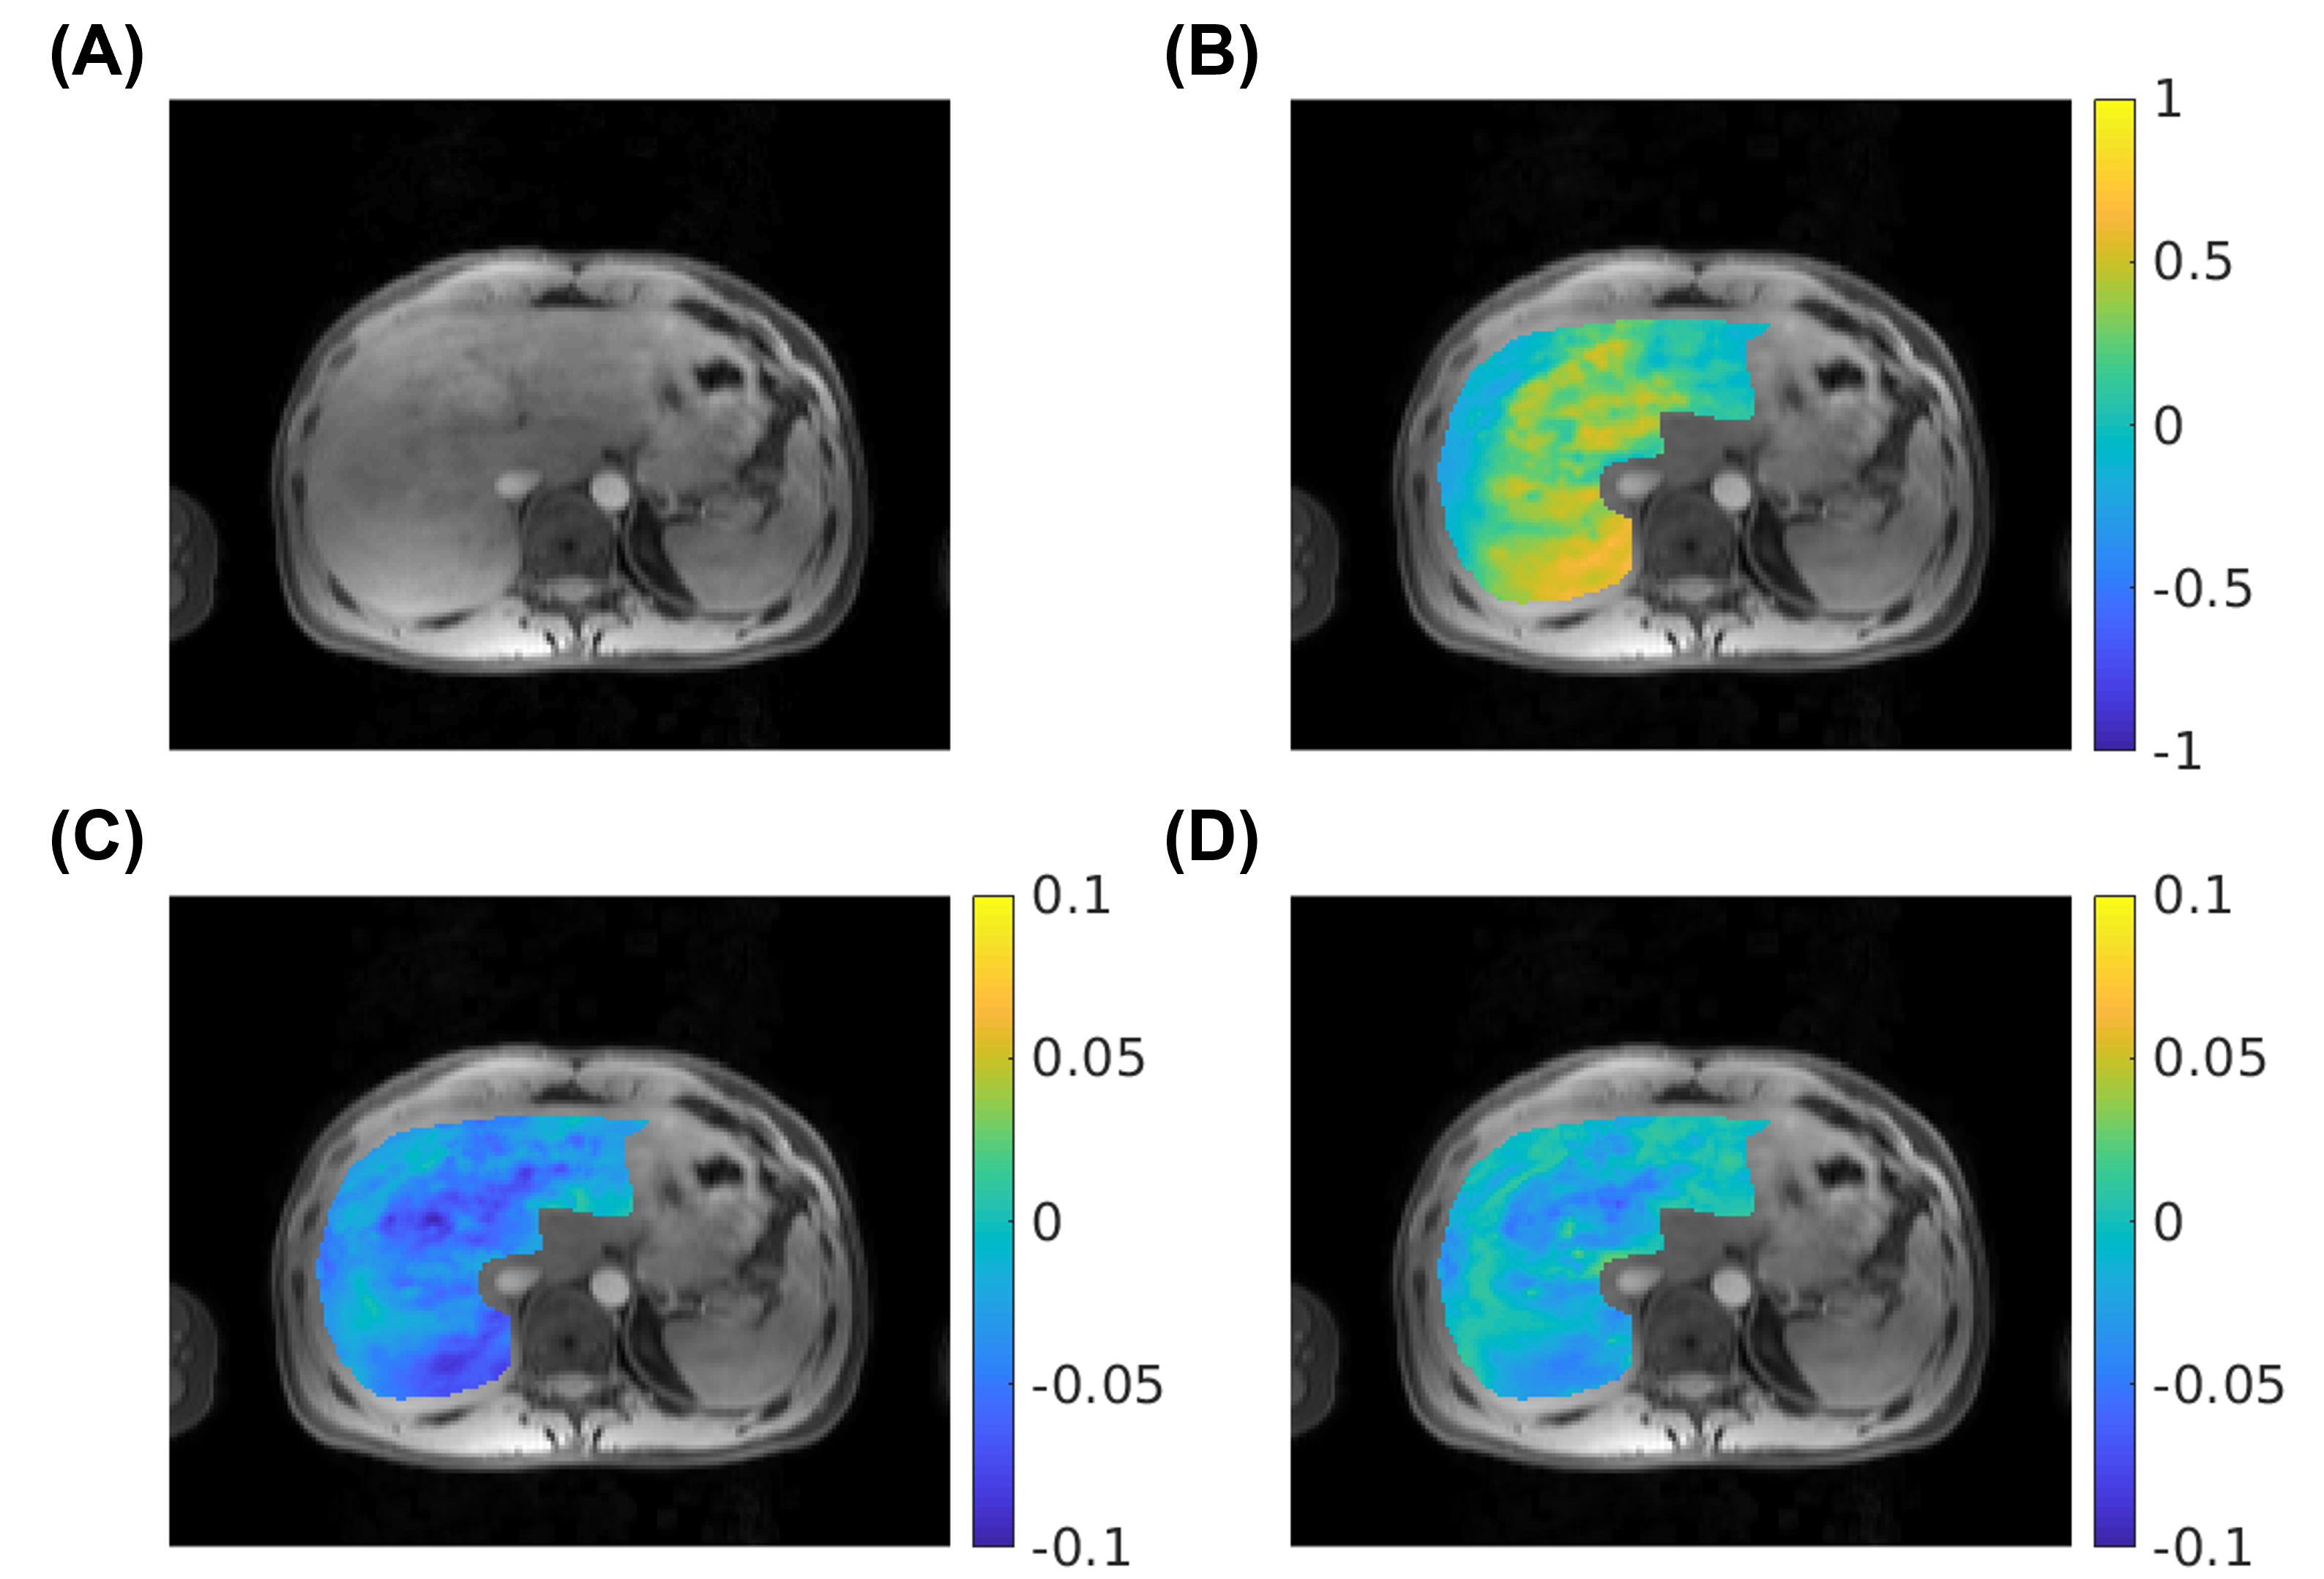
Fig. 2: Representative axial CEST images and maps from the proposed method. (A) CEST image at 3.5 ppm, (B) B0 map (in ppm), (C) APTw map (MTRasym at 3.5 ppm), (D) glycoCEST map (MTRasym at 1.0 ppm).
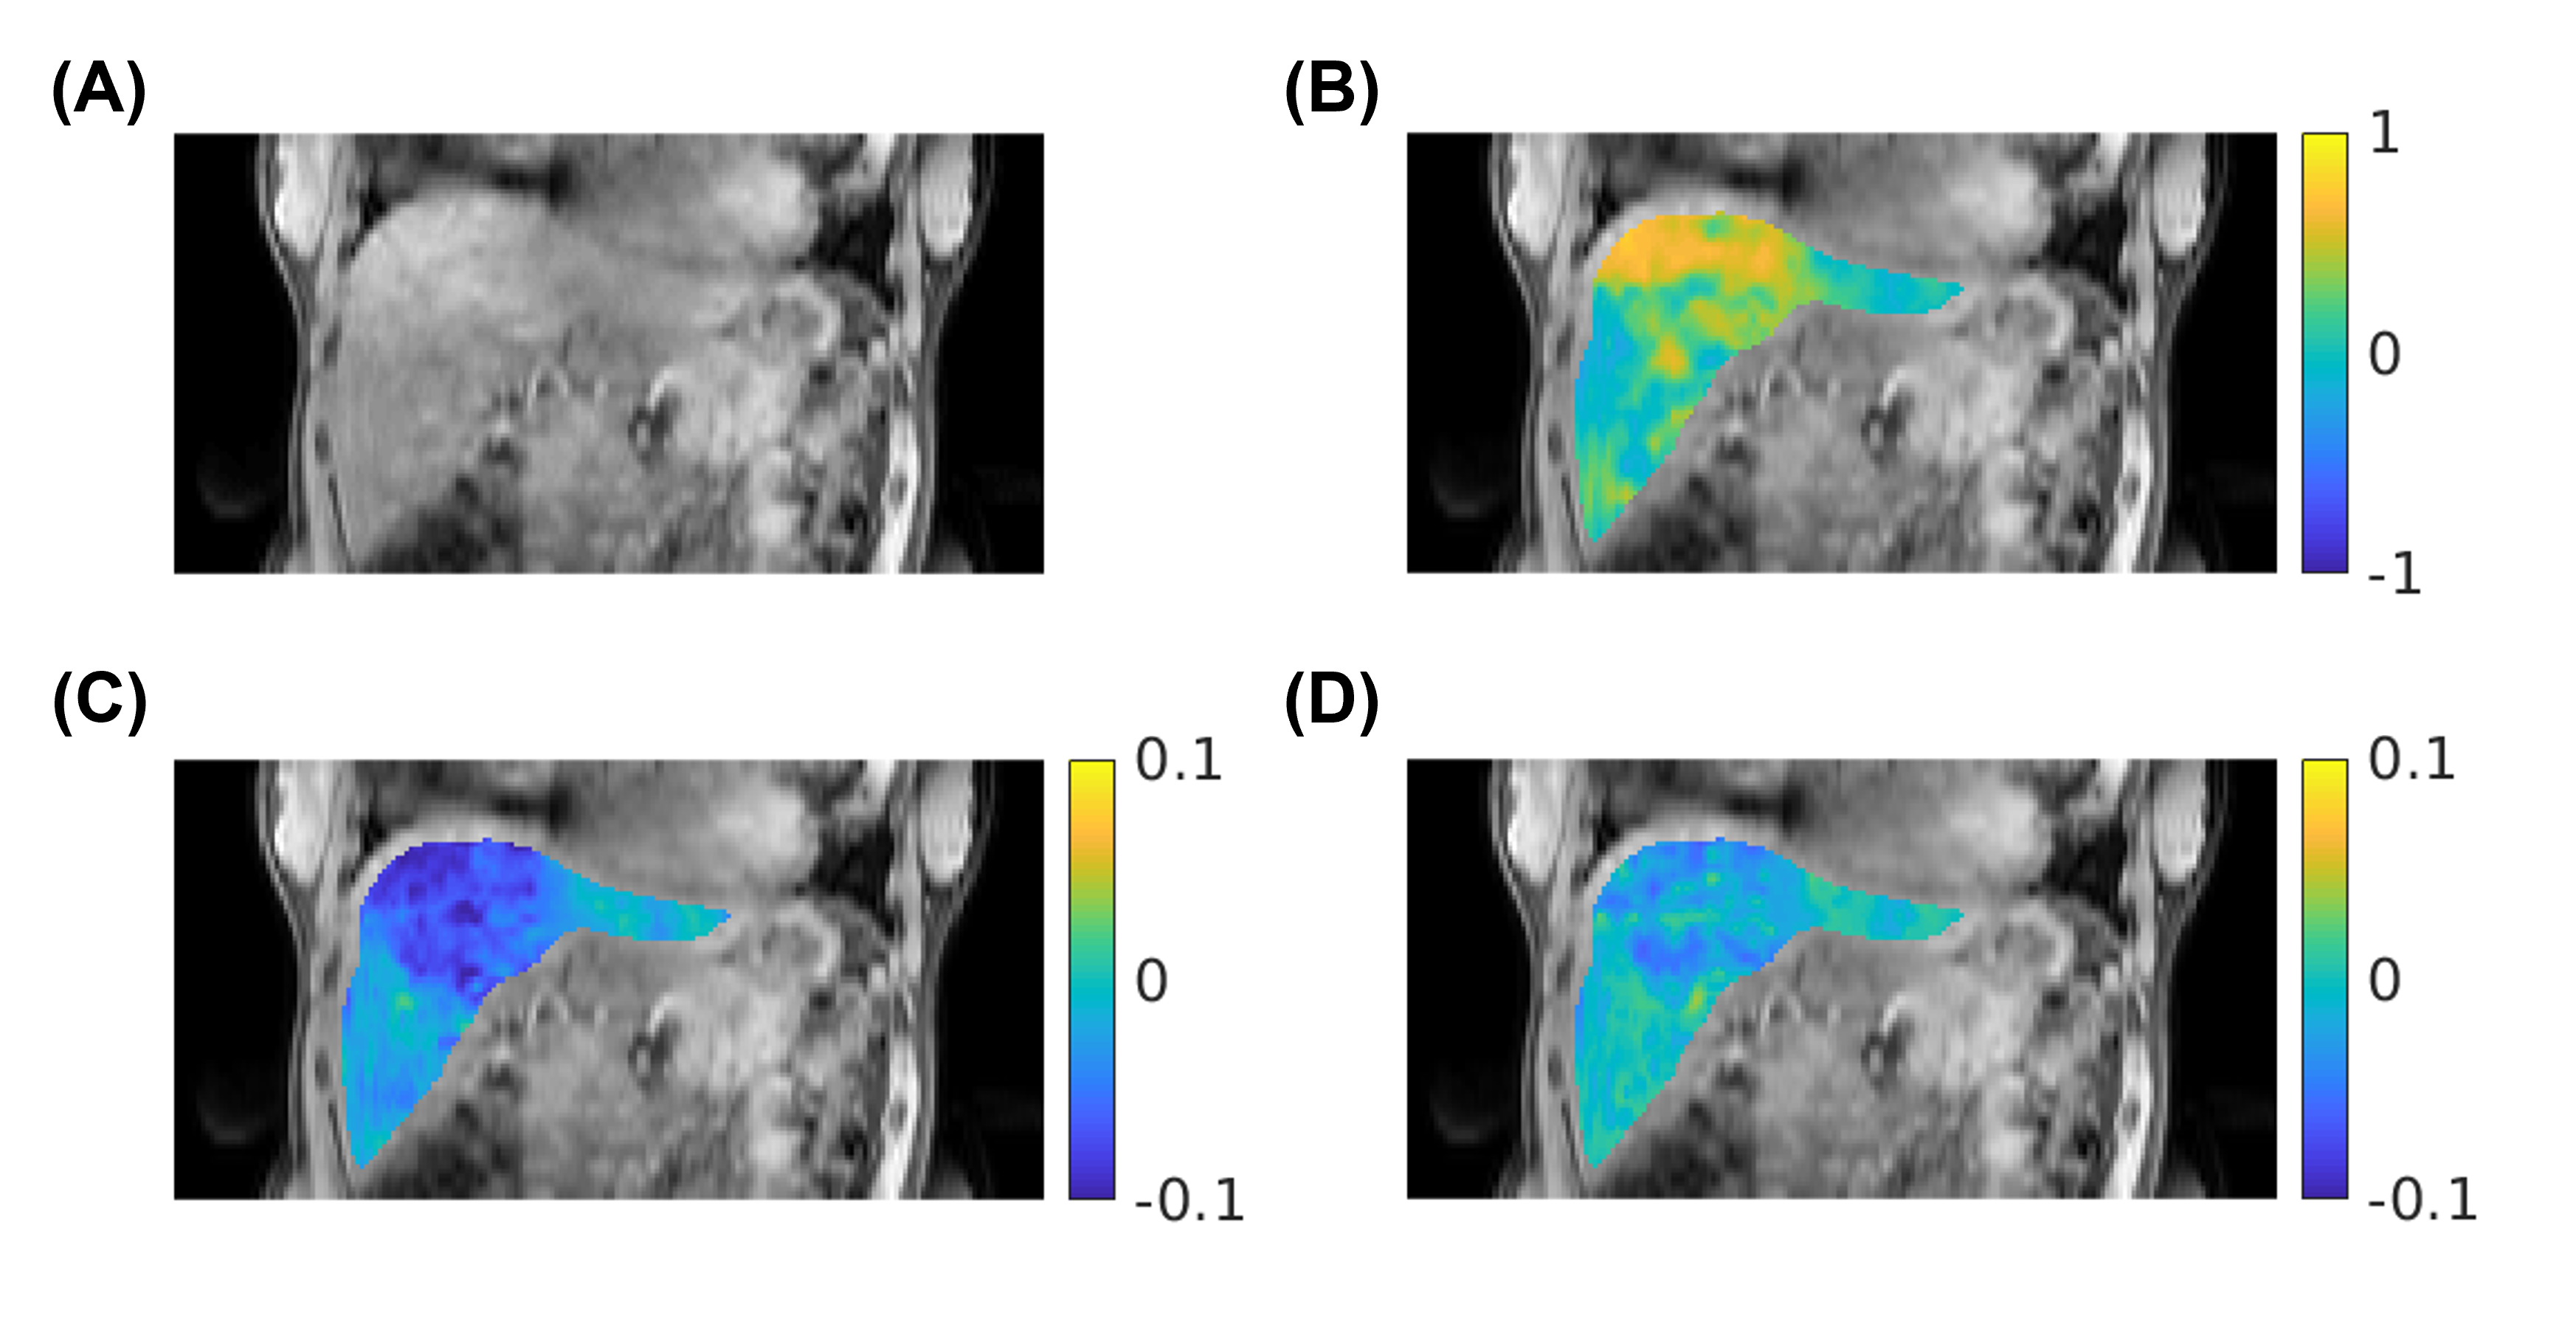
Fig. 3: Representative coronal CEST images and maps from the proposed method. (A) CEST image at 3.5 ppm, (B) B0 map (in ppm), (C) APTw map (MTRasym at 3.5 ppm), (D) glycoCEST map (MTRasym at 1.0 ppm).
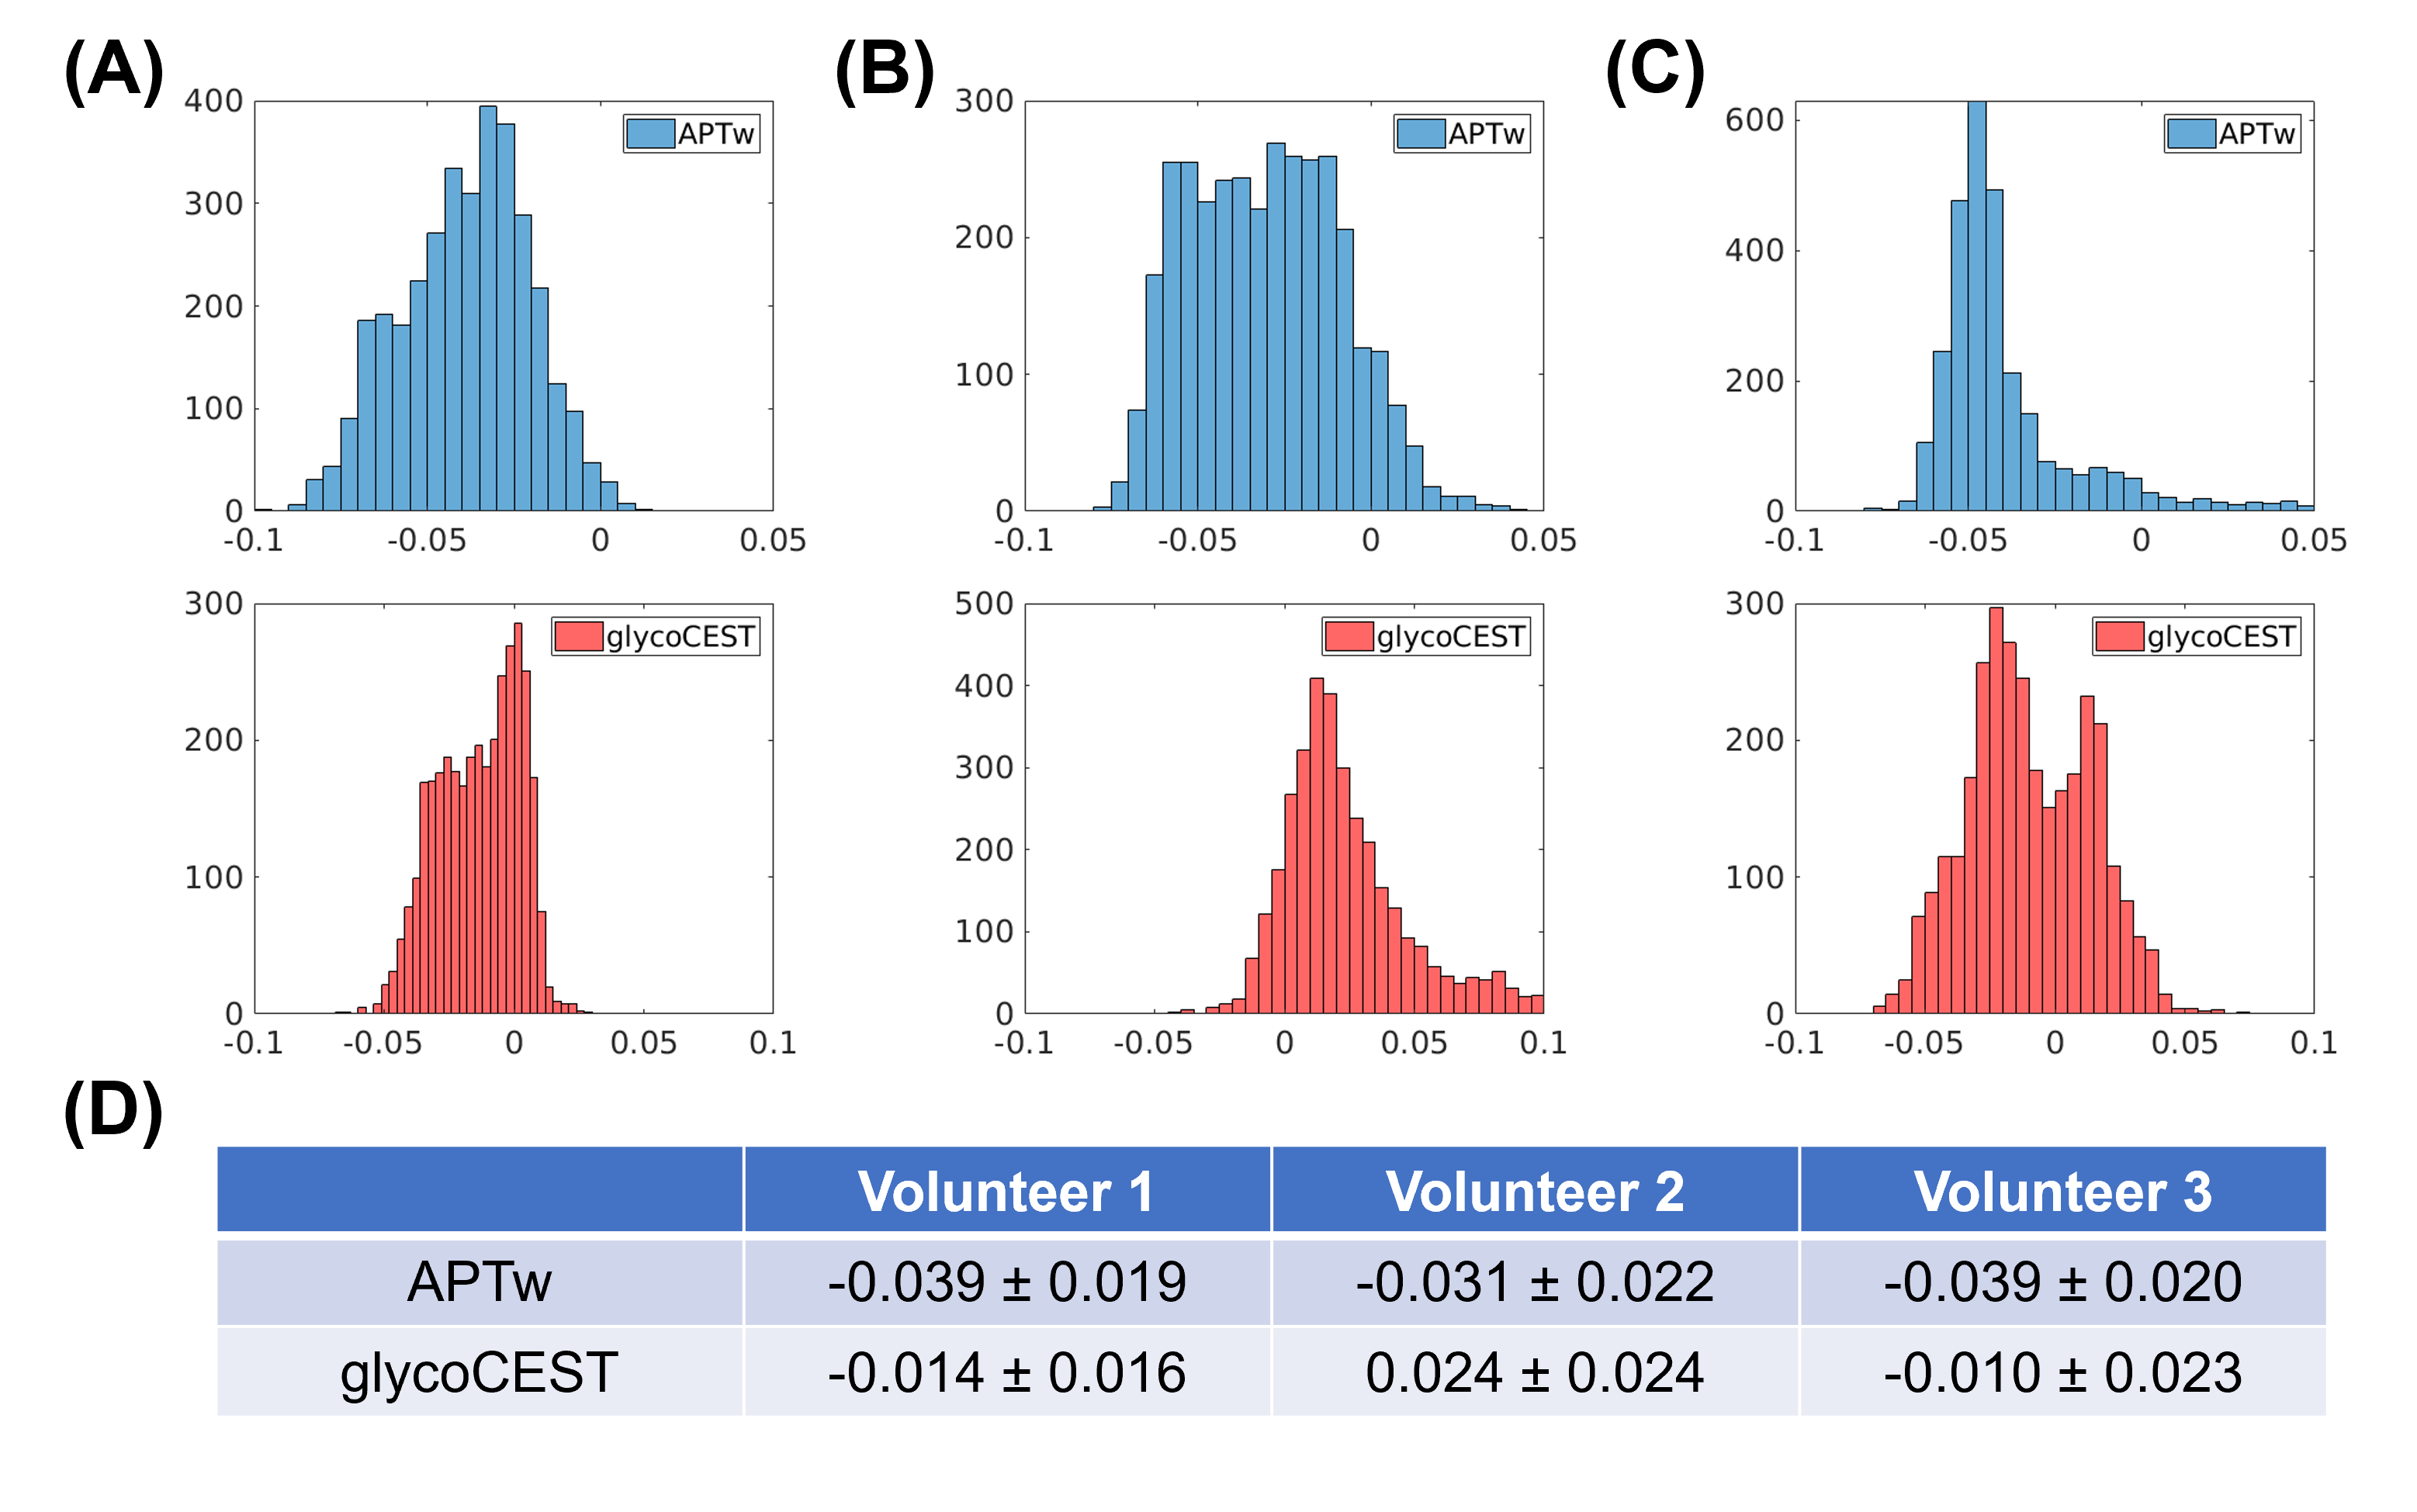
Fig. 4: Distribution of APTw and glycoCEST values in the liver (within the liver region in the central slice of the axial view). (A-C) Histograms of the APTw and glycoCEST MTRasym values in volunteer 1-3. (D) Means and standard deviations.