2714
Simultaneous Mapping of B0, B1 and T1 Using a CEST-like Pulse Sequence and Neural Network Analysis1Physikalisch-Technische Bundesanstalt (PTB), Braunschweig and Berlin, Germany, 2Department of Neuroradiology, Friedrich- Alexander Universität Erlangen- Nürnberg, University Hospital Erlangen, Erlangen, Germany
Synopsis
Obtaining isolated effects in Chemical Exchange Saturation Transfer (CEST) MRI requires the correction for the influence of B0- and B1-inhomogeneities and the T1 relaxation time during post-processing. We present an extended approach for simultaneous mapping of B0, B1 and T1 using a CEST-like pulse sequence and a regularized neural network-based analysis that provides additional uncertainty estimations. We demonstrate the in vitro and in vivo applicability of the proposed approach, which is trained using simulated data and confirm its accordance with established reference methods.
Introduction
One of the bottlenecks in Chemical Exchange Saturation Transfer (CEST) MRI is its susceptibility to B0- and B1-field inhomogeneities, and its dependency on the T1 relaxation time. To obtain isolated CEST effects, it is crucial to correct for the influence of all three parameters [1-4]. Quantitative mapping of B0, B1 and T1 usually requires three separate scans, which is inefficient and time-consuming. Thus, we extended our previous simulation-based work [5] and present an optimized approach for simultaneous mapping of B0, B1 and T1 using a CEST-like pulse sequence.Methods
The Water Shift and B1 (WASABI) approach enables the simultaneous mapping of B0 and B1 [1]. We previously extended this method by adding a preceding T1 preparation block [5] and now introduced frequency offset-dependent recovery delays to further enhance its intrinsic sensitivity to T1 (Fig. 1). For the prediction of the three parameters B0, B1 and T1 and the estimation of corresponding uncertainties, a deep neural network (NN) similar to deepCEST [6] and an adapted version optimized for B0, B1 and T1 quantification were implemented. In contrast to deepCEST, an analytical approximation of the underlying physical model (Bloch-(McConnell) equations) is added as an additional regularization term in the Gaussian negative log-likelihood (GNLL) loss function during training to make the optimized network more robust. Further modifications are an increase to 4 hidden layers with 128 neurons, each and the utilization of a softplus activation function after the last layer to enforce positive parameter predictions. Furthermore, only simulated data (about 20 million spectra with varying B0, B1, T1, T2 and SNR values generated using the pulseq-CEST [7] framework) were used for supervised training. MRI measurements were performed on a 3T whole body MRI scanner. Conventional WASABI and T1 saturation recovery methods were used as reference. A 2D centric-reordered GRE sequence was used as MRI readout. All preparation schemes and the MRI readout were created and played out at the scanner using the pulseq framework [8,9].Results
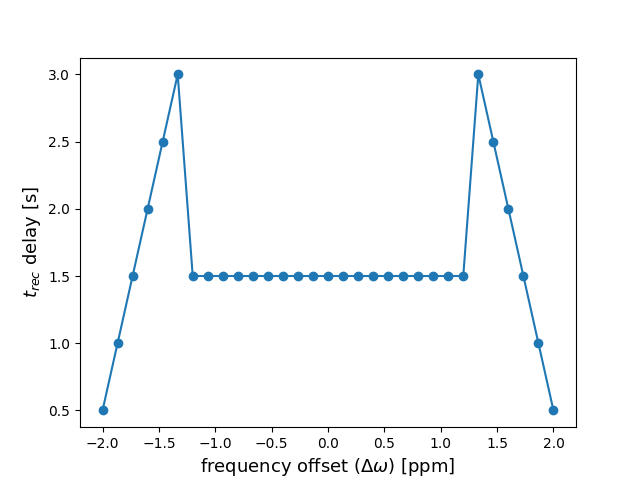
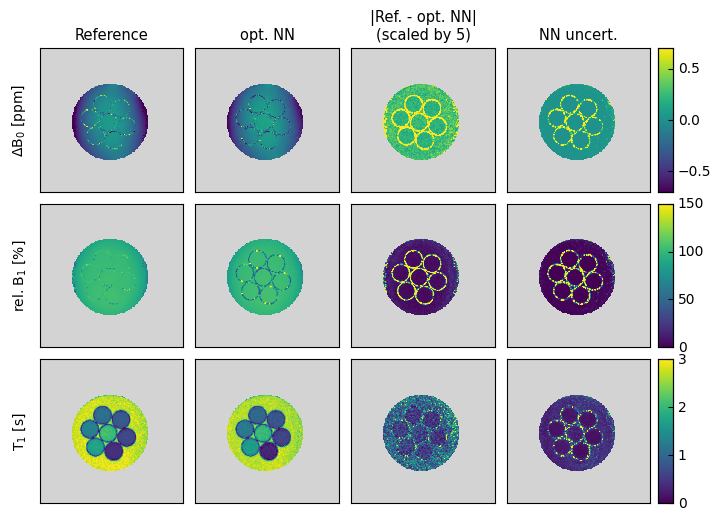
Various T1 prep. blocks were investigated with the aim to reduce the residual longitudinal magnetization over a broad range of B0 and B1 field inhomogeneities, while keeping the duration and power deposition as low as possible. An optimized 6-pulse train as published by Chow et al. [10] was found to perform best. Furthermore, different frequency offset-dependent delay time schemes including linearly in- and/or decreasing values and combinations of constant and linearly in- and decreasing values were tested. The scheme shown in Fig. 2 performed best and was used for all measurements.Fig. 3 shows the results of a comparison between our optimized and the non-optimized NN. Both are compared to the reference measurements of an MR phantom consisting of various model solutions. All predicted parameter maps are in good agreement with the reference maps. Larger differences are observed mainly in pixels located within the walls of the seven tubes. However, the noise level in the parameter maps is reduced and the match with the reference values is increased for the optimized compared to the non-optimized NN. This is most prominent in the surrounding water and at the borders off the tubes - especially for the tube with the lowest T1 value at the bottom.
Fig. 4 shows the results of the uncertainty estimation of the optimized NN for the same in vitro data as shown in Fig. 3. Importantly, the uncertainty estimations match the difference maps well, displaying higher uncertainties for regions with higher differences (e.g., in the walls of the tubes) and vice versa.
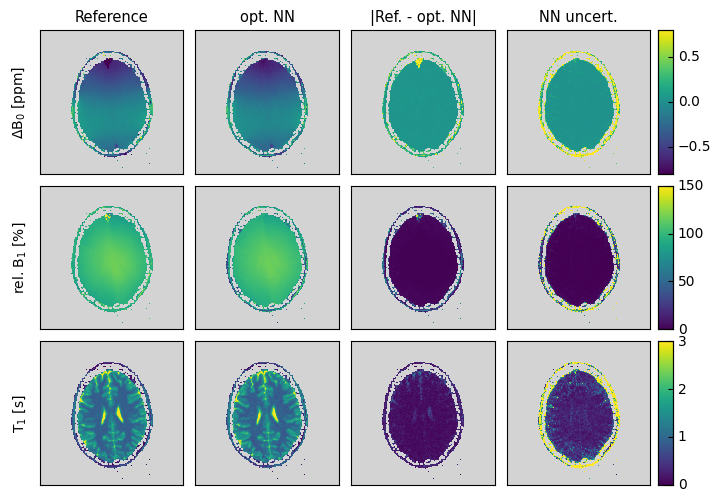
Finally, the modified WASABI approach and optimized NN evaluation was tested in vivo. Figure 5 shows the results of a brain scan of a healthy volunteer. The good match between the NN and reference maps confirms the in vivo applicability of the proposed approach. Highest differences for ΔB0 and rel. B1 are observed in regions where the reference maps show strong discontinuities, which most probably result from local minima in the fitting process employed in the original WASABI approach. The NN-based analysis seems to be superior in these regions.
Discussion and Conclusion
We demonstrated the feasibility of simultaneous mapping of the static magnetic field (B0), the RF excitation field (B1) and the longitudinal relaxation time (T1) using a modified WASABI sequence in combination with an optimized NN-based analysis. The predicted parameter maps and the reference maps agree well and the introduced regularization term increased the robustness. The observed small remaining differences and the estimated uncertainties match well, which indicates that the standard deviations of the assumed Gaussian distributions are an appropriate measure for the uncertainty of the proposed approach and thus enable the identification of regions where the predicted parameter values should be treated with caution. This is of high importance when the proposed approach is transferred to clinical setups where the generated parameter maps might be used for the correction of CEST-MRI contrasts. The similarity between the proposed sequence and conventional CEST-sequences enables the utilization of optimized 3D readouts like Snapshot-CEST [11] and thus allows for quantitative mapping of B0, B1 and T1 in 3D in about one minute.Acknowledgements
This research was funded by the Deutsche Forschungsgemeinschaft (DFG, German Research Foundation) – Grant No. 446320579, 372486779References
1) Schuenke P, Windschuh J, Roeloffs V, Ladd ME, Bachert P, Zaiss M. Simultaneous mapping of water shift and B1 (WASABI) - Application to field-Inhomogeneity correction of CEST MRI data. Magn. Reson. Med. 2017;77:571–580 doi: 10.1002/mrm.26133.
2) Kim M, Gillen J, Landman B a, Zhou J, van Zijl PCM. Water saturation shift referencing (WASSR) for chemical exchange saturation transfer (CEST) experiments. Magn. Reson. Med. 2009;61:1441–50 doi: 10.1002/mrm.21873.
3) Windschuh J, Zaiss M, Meissner J-E, et al. Correction of B1-inhomogeneities for relaxation-compensated CEST imaging at 7 T. NMR Biomed. 2015;28:529–37 doi: 10.1002/nbm.3283.
4) Zaiss M, Xu J, Goerke S, et al. Inverse Z-spectrum analysis for spillover-, MT-, and T1 -corrected steady-state pulsed CEST-MRI--application to pH-weighted MRI of acute stroke. NMR Biomed. 2014;27:240–52 doi: 10.1002/nbm.3054.
5) Heinecke, K, et al.: Simultaneous mapping of B0, B1 and T1 for the correction of CEST-MRI. In: ISMRM & SMRT Annual Meeting & Exhibition, 15-20 May 2021. Abstract 1452
6) Glang F, Deshmane A, Prokudin S, et al. DeepCEST 3T: Robust MRI parameter determination and uncertainty quantification with neural networks-application to CEST imaging of the human brain at 3T. Magn. Reson. Med. 2019:1–17 doi: 10.1002/mrm.28117.
7) Herz K, Mueller S, Perlman O, et al. Pulseq-CEST: Towards multi-site multi-vendor compatibility and reproducibility of CEST experiments using an open-source sequence standard. Magn. Reson. Med. 2021:1–14 doi: 10.1002/mrm.28825.
8) Layton KJ, Kroboth S, Jia F, et al. Pulseq: A rapid and hardware-independent pulse sequence prototyping framework. Magn. Reson. Med. 2017;77:1544–1552 doi: 10.1002/mrm.26235.
9) Ravi K, Geethanath S, Vaughan J. PyPulseq: A Python Package for MRI Pulse Sequence Design. J. Open Source Softw. 2019;4:1725 doi: 10.21105/joss.01725.
10) Chow K, Kellman P, Spottiswoode BS, et al. Saturation pulse design for quantitative myocardial T1 mapping. J. Cardiovasc. Magn. Reson. 2015;17:1–15 doi: 10.1186/s12968-015-0187-0.
11) Zaiss M, Ehses P, Scheffler K. Snapshot-CEST: Optimizing spiral-centric-reordered gradient echo acquisition for fast and robust 3D CEST MRI at 9.4 T. NMR Biomed. 2018;31:e3879 doi: 10.1002/nbm.3879.Figures