2711
Reproducibility of 3D NOE-MTR in a in vivo healthy human brain at 7T1CAMIPM, Department of Radiology, University of Pennsylvania, Philadelphia, PA, United States
Synopsis
Nuclear Overhauser Effect (NOE) is an emerging technique to study mobile macromolecules such as lipids in the gray (GM) and white matter (WM) of the brain. In this work, we optimized the saturation pulse parameters of NOE Magnetization Transfer Ratio (MTR) MRI and investigated its reproducibility on a healthy human volunteer at 7 Telsa. We found that NOE-MTR of GM and WM regions of the brain was highly reproducible (COV<10%) over a three year time span. In addition, a saturation length of 3 to 4 sec provided optimal NOE-MTR contrast from both GM and WM regions of the brain.
Introduction
An emerging technique to probe lipids and other macromolecules in the brain uses contrast arising from magnetization transfer due to the Nuclear Overhauser Effect (NOE)1,2 . NOE phenomenon is a cross-relaxation which occurs through space, likely between aliphatic moieties and bulk water, giving rise to a Z-spectrum signal (indicating magnetization transfer) 3.5ppm upfield from bulk water. Imaging based on this NOE contrast mechanism has been investigated in both animal and human studies, at 3T, 7T and 9.4T3-7. These studies have shown in general that low power radiofrequency (RF) pulses and longer saturation lengths can saturate slower-tumbling protons with minimal direct effect on water1,8,10,12,13,14. However, no comprehensive studies to date have characterized the dependence of the in vivo NOE contrast on varying saturation power/length, while correcting for B0 and B1 inhomogeneities, particularly at 7T. Furthermore, the reproducibility of NOE-MTR and contributions of WM and GM proportions to NOE maps are unknown. NOE in WM has been shown to differentiate tumor grades in animals model and in humans. So there is a need to develop a standardized protocol to accurately measure NOE, which would be useful for these clinical studies 2,3,4,5,8,9. The purpose of this study was to do an extensive characterization of the NOE contrast dependence on saturation parameters and demonstrate reproducibility of the technique with optimized parameters, yielding robust 7T NOE maps of the human brain, corrected for B0 and B1 inhomogeneities.Methods
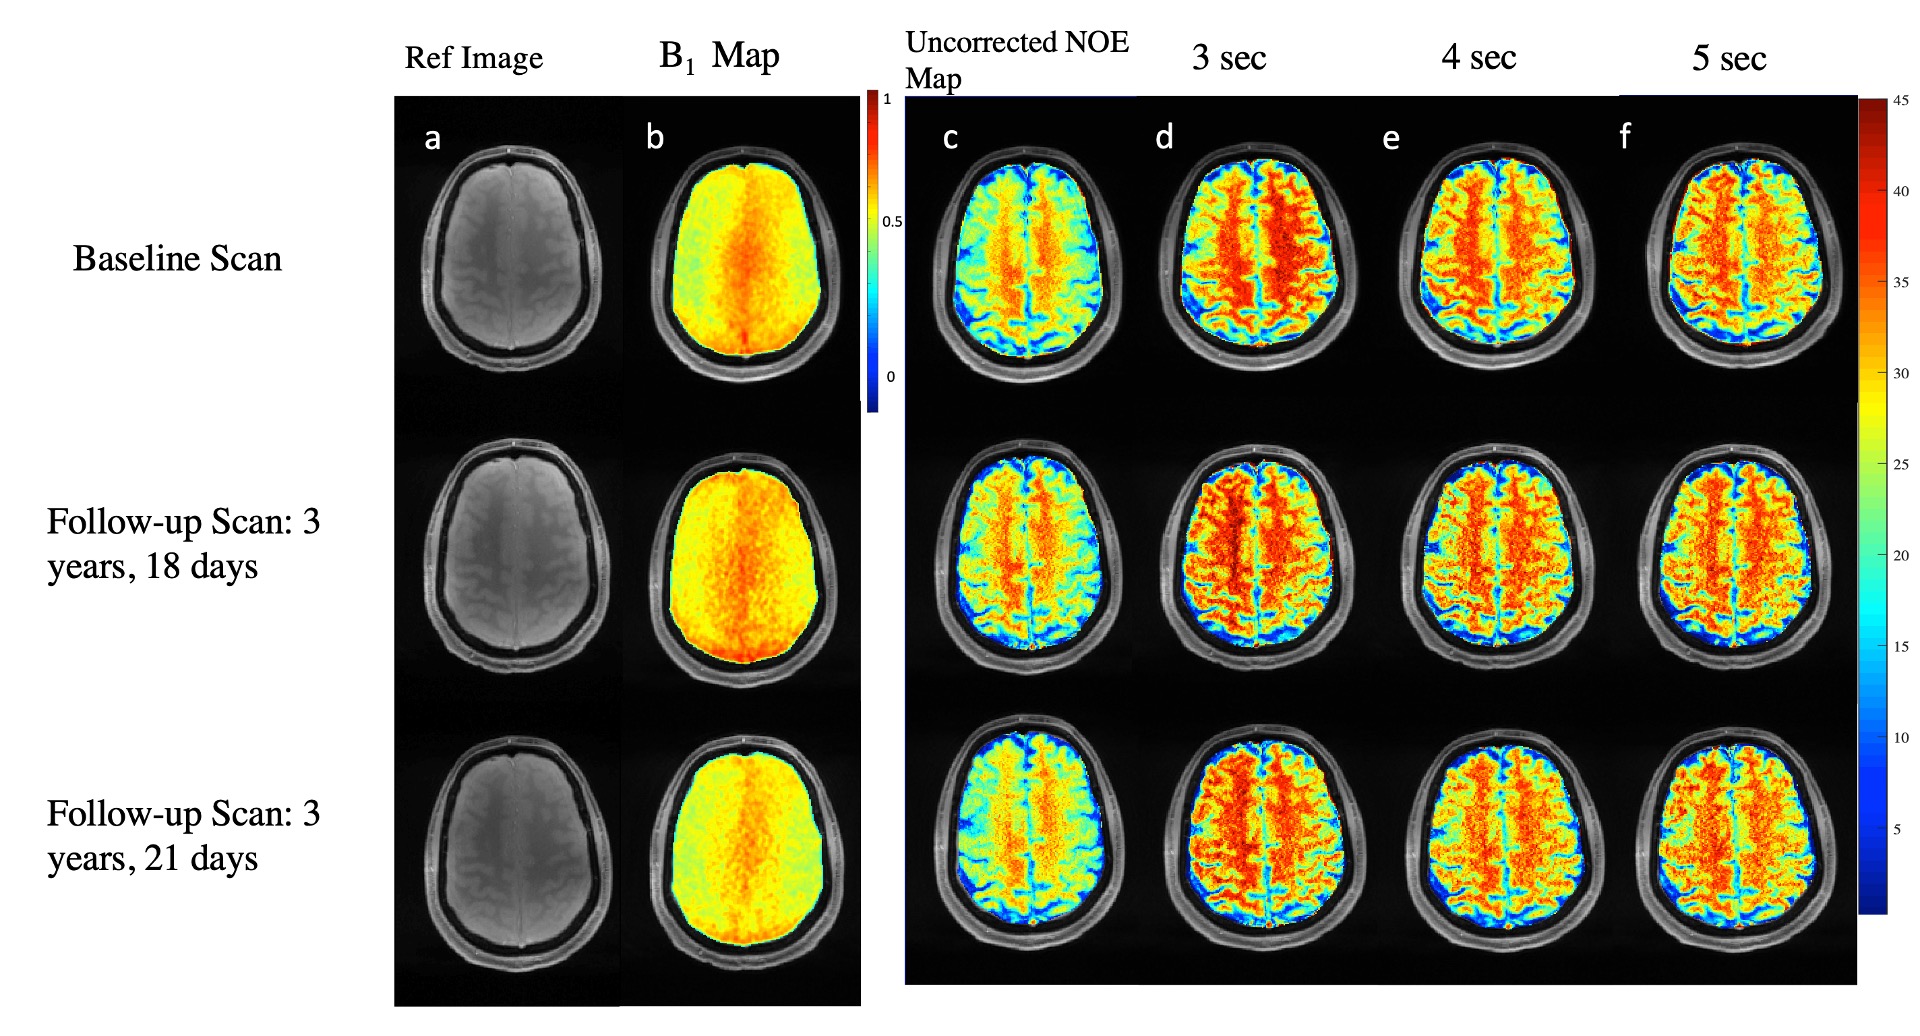
A healthy volunteer (male; age 41 years old) was scanned for reproducibility in a longitudinal study. Imaging was performed on a 7T whole body scanner (MAGNETOM Terra , Siemens Healthcare, Erlangen, Germany) with a Nova Medical volume coil transmit/32-channel receive proton head phased-array coil. Three scans were acquired on this subject (n = 3). The first scan was acquired on October 18, 2018, and the subsequent scans were done on November 5th and 8th 2021. The B0 and B1 corrected NOE-MTR contrast maps were averaged over the subject's gray matter (GM) and white matter (WM) (covering the 3D volume) to compute the coefficient of variation (COV) for the reproducibility studies. To accurately obtain consistent slice locations between imaging sessions, we used a coregistration program, ImScribe (accessible at https://www.med.upenn.edu/cmroi/imscribe.html). It uses high-resolution T1 weighted images and the slice information from a subject’s initial scan as a target template for subsequent scans and performs affine coregistration that provides information for slice placement. An axial slice located about 3 to 4 mm above the corpus callosum for adequate gray/white matter separation was selected. For every subsequent scan, ImScribe was used to identify slice coordinates to maintain consistent slice positioning.Data Acquisition
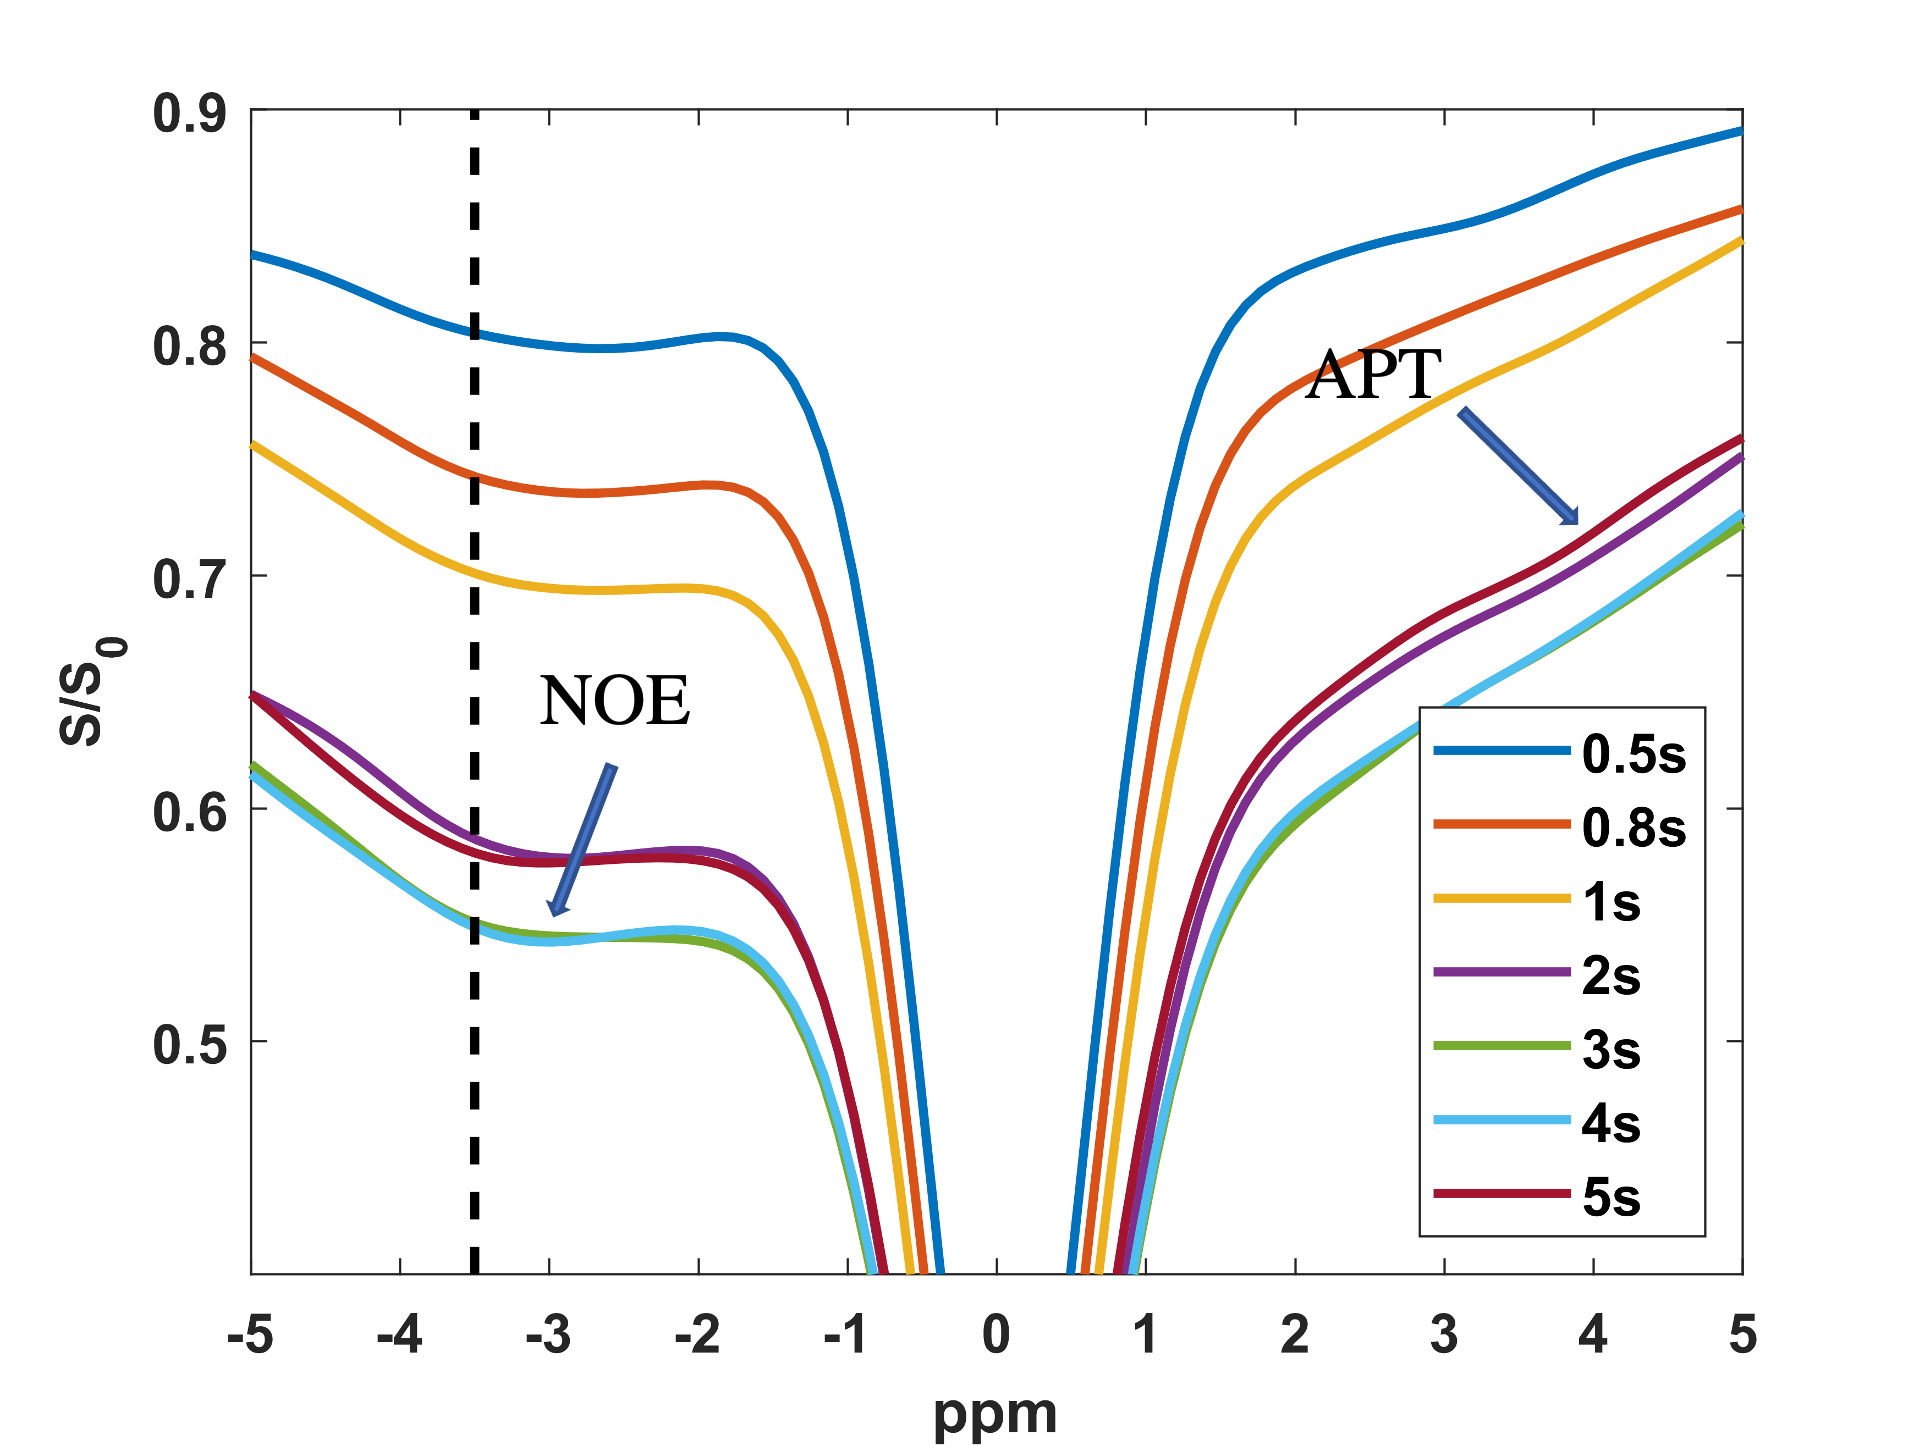
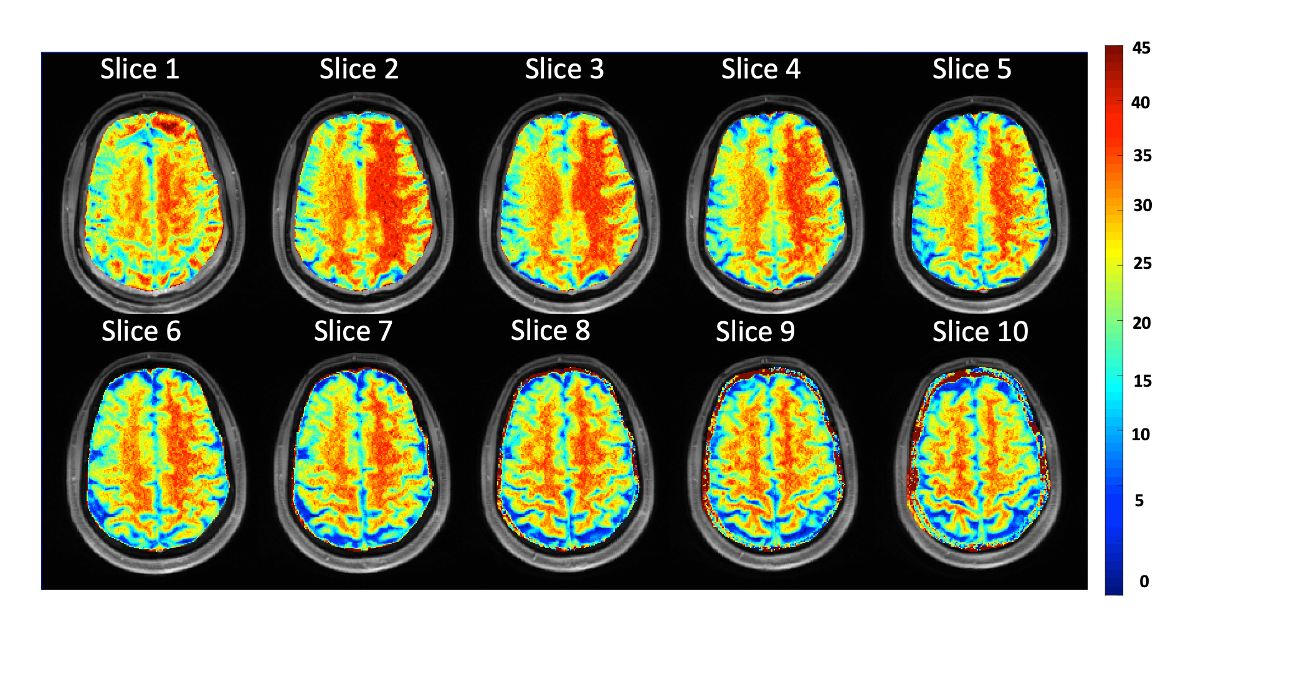
The 3D NOE imaging parameters were slice thickness = 2 mm, number of slices = 12, in-plane resolution = 1 x 1 mm2, size = 256 x 256, gradient-echo readout TR/TE = 6.6/1.79 ms, read-out flip angle = 4°, averages = 1, SHOT TR = 6600 ms, shots per slice = 1, and a saturation pulse of B1,rms = 0.72 µT with varied pulse lengths 0.5, 0.8, 1, 2, 3, 4, and 5s (pulse train of 100ms pulses with a small delay). The NOE images were acquired at varying saturation offset frequencies from -5 to 5 ppm (relative to the water resonance set to 0 ppm) with a step size of 0.2 ppm.
Data Processing
Data processing was performed using in-house written MATLAB (version R2020b) scripts, as described in Cai et al [15]. First, the NOE-MTR was computed at a frequency offset (ω = -3.5 ppm) using the following equation:
$$$\begin{equation} NOE_{MTR} = \frac{S(ref) - S(\omega =-3.5 ppm)}{S(ref)}\end{equation}$$$
where S(ref) is the reference image and S(ω = -3.5 ppm) is the image acquired following saturation applied at ω = -3.5 ppm relative to water peak. To compute B0 maps for correction of B0 field inhomogeneity, water saturation shift referencing (WASSR) images were collected from ± 0 to ± 1 ppm (step size = 0.1 ppm) with a saturation pulse of B1,rms = 0.29 µT with 200-ms duration and imaging parameters identical to those used for CEST [16]. B1 correction was performed with linear scaling as described previously [14].
Results
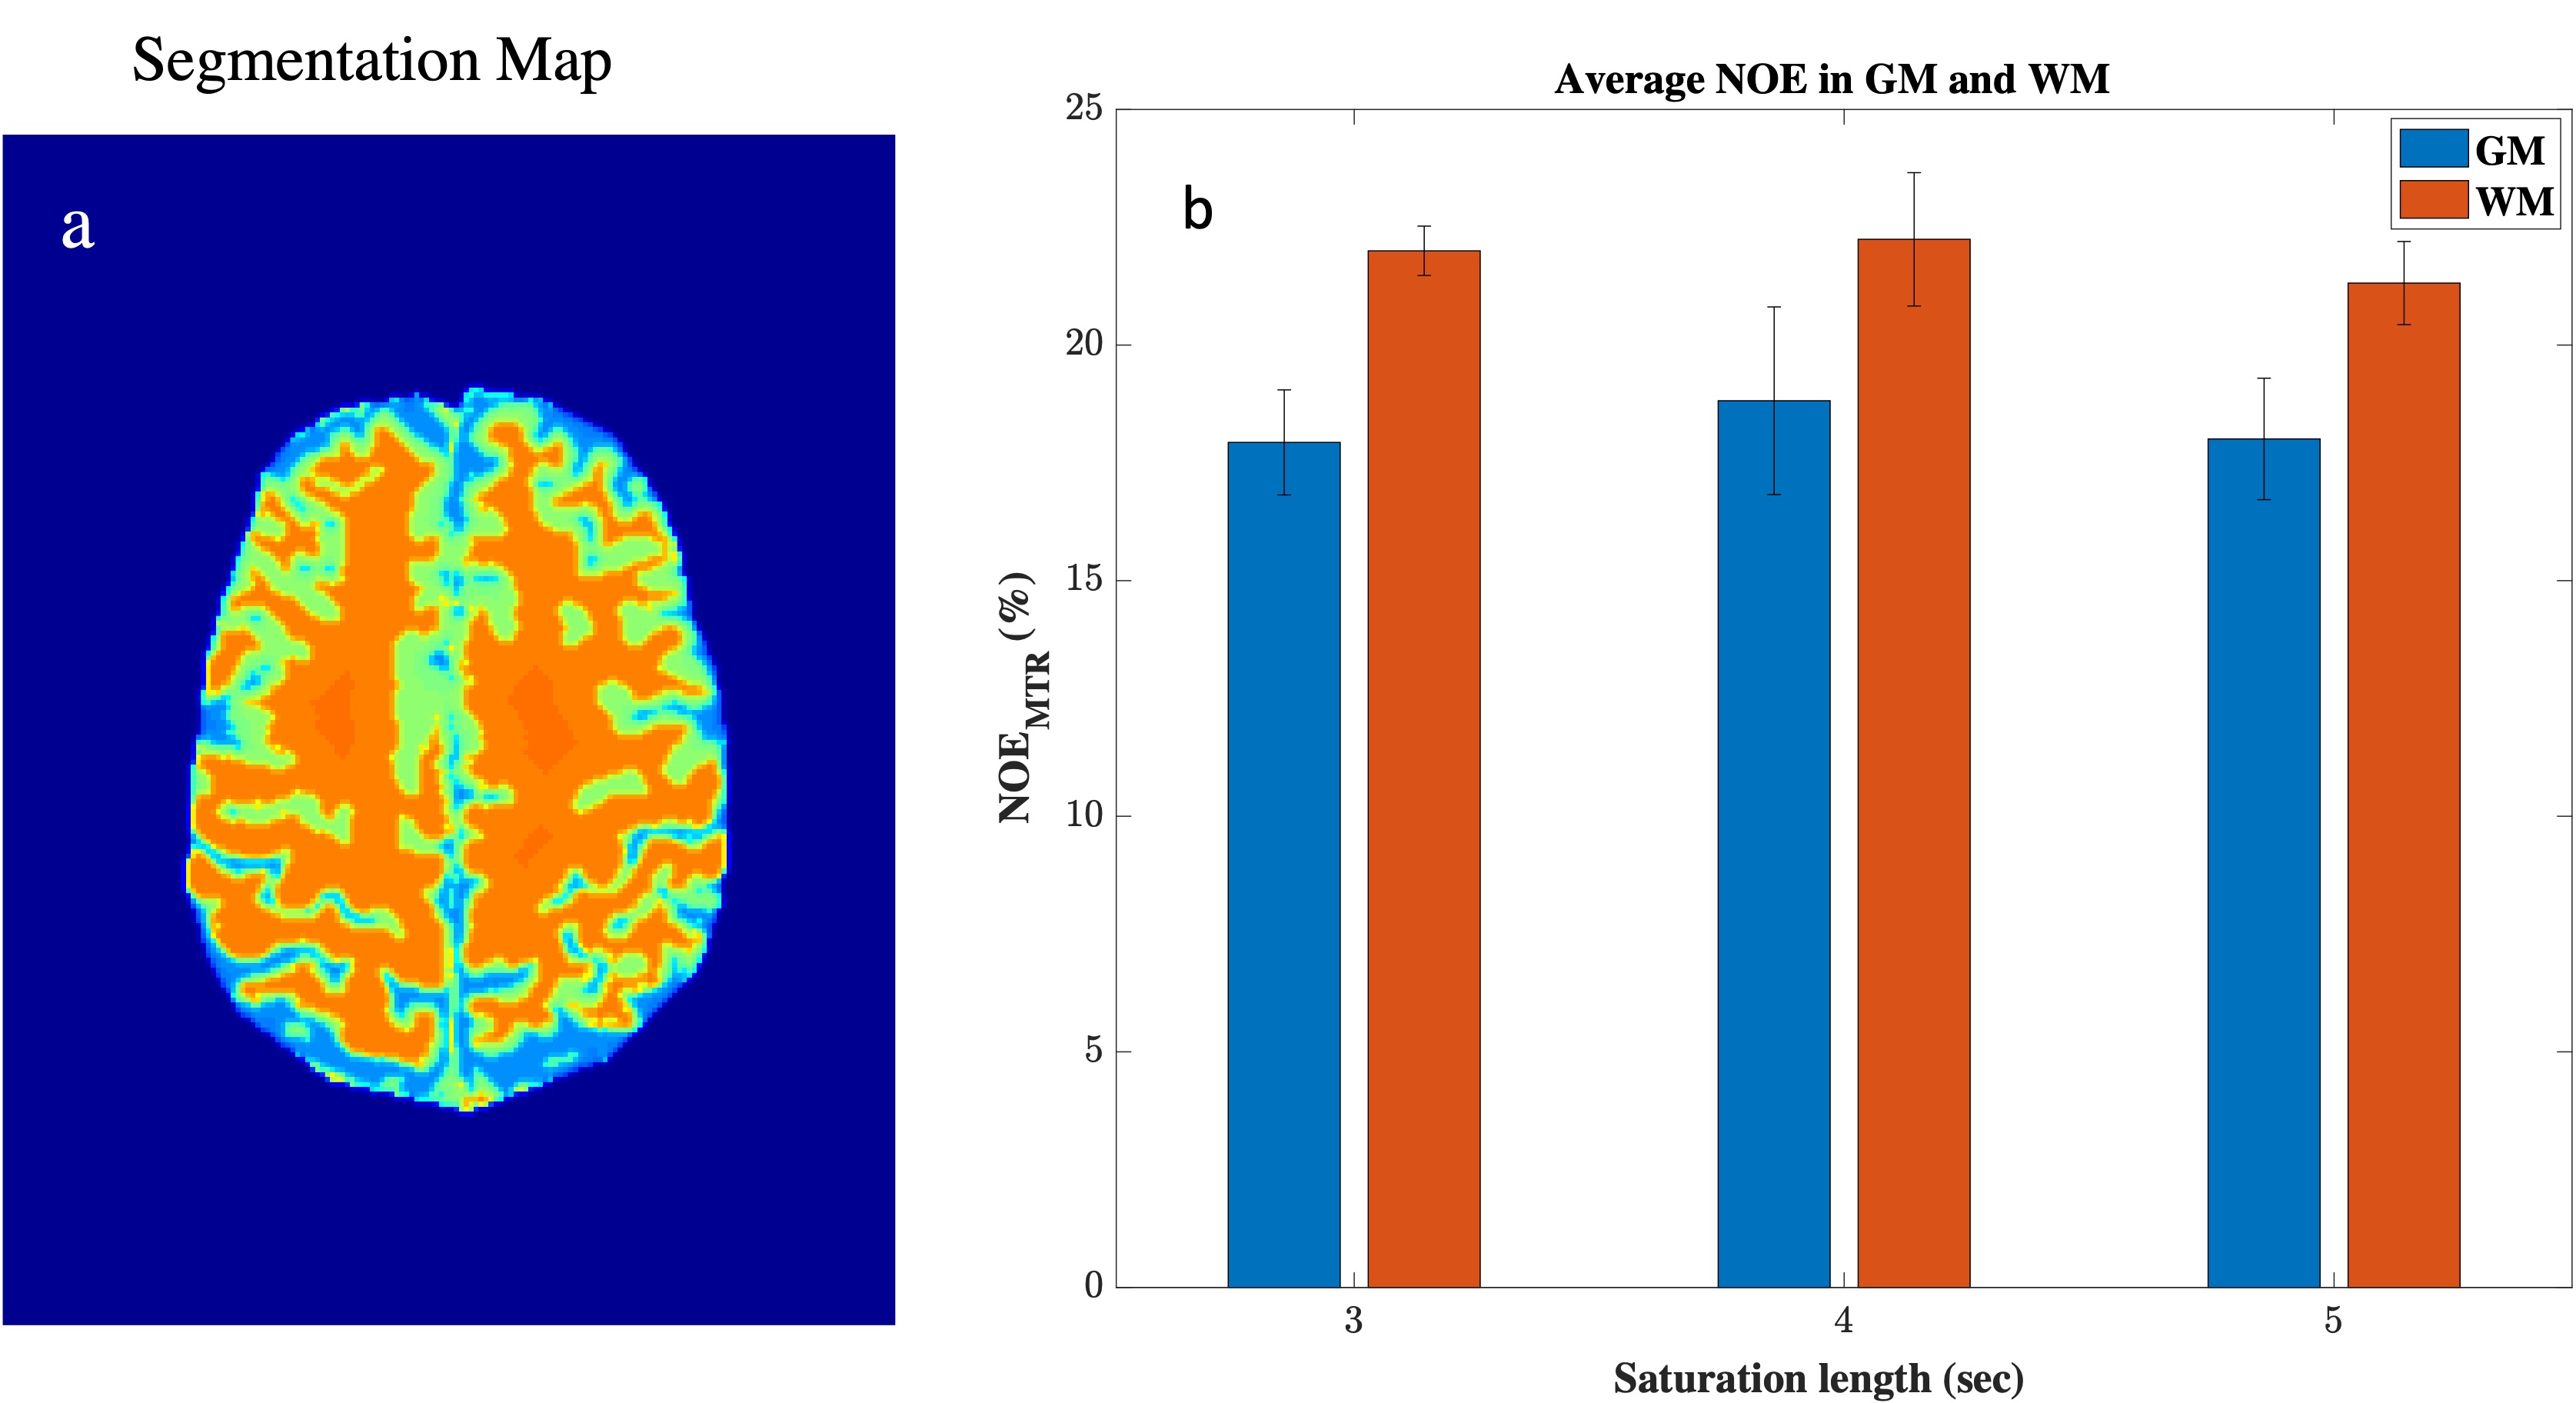
The NOE-MTR values were highly reproducible in the gray and white matter regions of the brain (Figure 3) over a three-year span. The statistical differences were not significant in the GM and WM regions between scans, with a COV less than 10% (Figure 4). From the MTR values, it shows that a saturation length of three and four seconds provide comparable NOE-MTR and yielded the higher contrast in the WM than in the GM (Figure 4). A visual observation of this is shown in the Z-spectrum (Figure 1).Discussion & Conclusion
In this longitudinal study, a healthy human volunteer was scanned for reproducibility for NOE-MTR in the GM and WM. In this work, we show that NOE-MTR is highest with saturation lengths of three and four seconds in the WM with a value of 21.99% and 22.24%, respectively. We also show that NOE-MTR is reproducible over a three-year span within 10% uncertainty. Studies involving more subjects will not only confirm this but also improve the reproducibility measurement at 7T. Further studies are ongoing in this direction.Acknowledgements
Research reported in this publication was supported by the National Institute of Biomedical Imaging and Bioengineering of the National Institutes of Health under award Number P41EB029460. Research reported in this publication was supported by the National Institute of Biomedical Imaging and Bioengineering of the National Institutes of Health under award Number T32EB020087.References
[1] Jin T, Wang P, Zong X, Kim SG. MR imaging of the amide-proton transfer effect and the pH-insensitive nuclear overhauser effect at 9.4 T. Magn Reson Med. 2013;69(3):760-770. doi:10.1002/mrm.24315
[2] Jones CK, Huang A, Xu J, et al. Nuclear Overhauser enhancement (NOE) imaging in the human brain at 7T. Neuroimage. 2013;77:114-124. doi:10.1016/j.neuroimage.2013.03.04
[3] Heo H-Y, Zhang Y, Lee D-H, Hong X, Zhou J. Quantitative assessment of amide proton transfer (APT) and nuclear overhauser enhancement (NOE) imaging with extrapolated semi-solid magnetization transfer reference (EMR) signals: Application to a rat glioma model at 4.7 tesla. Magn Reson Med. 2016;75(1):137-149. doi:10.1002/mrm.2558
[4] Zhou J, Hong X, Zhao X, Gao JH, Yuan J. APT-weighted and NOE-weighted image contrasts in glioma with different RF saturation powers based on magnetization transfer ratio asymmetry analyses. Magn Reson Med. 2013;70(2):320-327. doi:10.1002/mrm.24784
[5] Zaiss M, Windschuh J, Paech D, et al. Relaxation-compensated CEST-MRI of the human brain at 7T: Unbiased insight into NOE and amide signal changes in human glioblastoma. Neuroimage. 2015;112:180-188. doi:10.1016/j.neuroimage.2015.02.040
[6] Khlebnikov V, Windschuh J, Siero JCW, et al. On the transmit field inhomogeneity correction of relaxation-compensated amide and NOE CEST effects at 7 T. NMR Biomed. 2017;30(5):e3687. doi:10.1002/nbm.3687
[7] Mougin O, Clemence M, Peters A, Pitiot A, Gowland P. High-resolution imaging of magnetisation transfer and nuclear Overhauser effect in the human visual cortex at 7 T. NMR Biomed. 2013;26(11):1508-1517. doi:10.1002/nbm.2984
[8] Liu D, Zhou J, Xue R, Zuo Z, An J, Wang DJJ. Quantitative characterization of nuclear overhauser enhancement and amide proton transfer effects in the human brain at 7 Tesla. Magn Reson Med. 2013;70(4):1070-1081. doi:10.1002/mrm.24560
[9] Mehrabian, H., Desmond, K. L., Soliman, H., Sahgal, A., & Stanisz, G. J. (2017). Differentiation between Radiation Necrosis and Tumor Progression Using Chemical Exchange Saturation Transfer. Clinical Cancer Research, 23(14), 3667 LP – 3675.
[10] Zhang XY, Wang F, Jin T, et al. MR imaging of a novel NOE‐mediated magnetization transfer with water in rat brain at 9.4T. Magn Reson Med. 2017;78(2):588‐597
[11] Zhang XY, Wang F, Li H, et al. Accuracy in the quantification of chemical exchange saturation transfer(CEST) and relayed nuclear Overhauser enhancement (rNOE) saturation transfer effects. NMRBiomed. 2017;30(7):e3716.
[12] Luijten, P., & Zijl, P. C. M. Van. (2013). Saturation Transfer at 7T. 67(6), 1579–1589. https://doi.org/10.1002/mrm.23141.In
[13] Fonslow, B. R., Stein, B. D., Webb, K. J., Xu, T., Choi, J., Kyu, S., & Iii, J. R. Y. (2014). Variable Delay Multi-Pulse Train for Fast Chemical Exchange Saturation Transfer and Relayed-Nuclear Overhauser Enhancement MRI. Magnetic Resonance in Medicine, 71(5), 1798–1812. https://doi.org/10.1002/mrm.24850.Variable
[14] Windschuh, J., Zaiss, M., Meissner, J. E., Paech, D., Radbruch, A., Ladd, M. E., & Bachert, P. (2015). Correction of B1-inhomogeneities for relaxation-compensated CEST imaging at 7T. NMR in Biomedicine, 28(5), 529–537. https://doi.org/10.1002/nbm.3283
[15] Cai K, Haris M, Singh A, Kogan F, Greenberg JH, Hariharan H, Detre JA, Reddy R. Magnetic resonance imaging of glutamate. Nat Med. 2012 Jan 22;18(2):302-6. doi: 10.1038/nm.2615. PMID: 22270722; PMCID: PMC3274604.
[16] Kim, M., Gillen, J., Landman, B.A., Zhou, J. and van Zijl, P.C. (2009), Water saturation shift referencing (WASSR) for chemical exchange saturation transfer (CEST) experiments. Magn. Reson. Med., 61: 1441-1450. https://doi.org/10.1002/mrm.2187
Figures