2709
Quantitative Magnetization Transfer parametric mapping unbiased by on-resonance saturation and dipolar order contributions
Lucas Soustelle1,2, Thomas Troalen3, Andreea Hertanu1,2, Maxime Guye1,2, Jean-Philippe Ranjeva1,2, Gopal Varma4, David C. Alsop4, Olivier M. Girard1,2, and Guillaume Duhamel1,2
1Aix Marseille Univ, CNRS, CRMBM, Marseille, France, 2APHM, Hôpital Universitaire Timone, CEMEREM, Marseille, France, 3Siemens Healthcare SAS, Saint-Denis, France, Paris, France, 4Division of MR Research, Radiology, Beth Israel Deaconess Medical Center, Harvard Medical School, Boston, MA, United States
1Aix Marseille Univ, CNRS, CRMBM, Marseille, France, 2APHM, Hôpital Universitaire Timone, CEMEREM, Marseille, France, 3Siemens Healthcare SAS, Saint-Denis, France, Paris, France, 4Division of MR Research, Radiology, Beth Israel Deaconess Medical Center, Harvard Medical School, Boston, MA, United States
Synopsis
Two major biases in the current qMT methodology arise from i) on-resonance saturation effects induced by readout pulses used in variable flip angle SPGR experiments, and ii) dipolar order effects induced by single-frequency off-resonance saturation pulses leading to a reduced saturation efficiency. In this work, we evaluate these two biases by performing experiments and analyses by accounting for on-resonance saturation in the qMT model and using simultaneous symmetric dual-offset frequency saturation pulses to cancel out dipolar order effects. Results show improvement in the fitting procedure and more accurate estimation of T1,f and MPF values in white and grey matter structures.
Introduction
Quantitative Magnetization Transfer (qMT) imaging aims at quantitatively characterizing the macromolecules exchanging with surrounding water. The most relevant quantitative parameter among those classically estimated using the established two-pool model and MT-prepared spoiled gradient-recalled (SPGR) experiments is the macromolecular proton fraction (MPF), which presents a fair sensitivity to brain tissue changes1,2.Two major drawbacks in the current qMT methodology can however bias the MPF value.
First, the free water longitudinal relaxation rate (R1,f=1/T1,f) is typically estimated using the Variable Flip Angle (VFA) method, with which it is most often assumed that R1,f=R13,4. However, VFA experiments are also sensitive to MT effects (both chemical exchange and on-resonance saturation5,6).
Second, dipolar order effects are generally ignored in the two-pool qMT model in the scope of MT-SPGR sequences with long and single-offset frequency saturation (SOFS) pulses7,8 (Figure 1a). However, given the saturation pulse durations and powers used in current qMT-SPGR studies along with relatively long dipolar order relaxation time (T1D) values in the central nervous system9–11, dipolar order contributions can be expected in SOFS-based acquisitions. Dipolar order effects can be cancelled out using simultaneous symmetric dual-offset frequency saturation (DOFS) pulses that fully decouple the dipolar order from its associated macromolecular Zeeman order12,13 (Figure 1b).
In this work, we evaluate the bias of on-resonance saturation and dipolar order effects on T1,f and MPF derived from qMT analyses of VFA- and MT-SPGR data in the human brain.
Methods
Experiments were performed on one healthy volunteer on a 3T clinical system (MAGNETOM Vida, Siemens Healthcare, Erlangen, Germany) with body coil transmission and a 32-channel receive head coil. The protocol included anatomical MPRAGE, B1+ mapping14, and prototype 3D non-selective VFA-/MT-SPGR sequences (Table 1).The two-pool model was adapted into general matrix equations in steady-state15 accounting for any on/off-resonance saturation, relaxation and exchanges, and allows for a joint fitting of VFA- and MT-SPGR data. On-/off-resonance saturation rates of the bound pool were calculated using the super-Lorentzian absorption lineshape including a residual broadening term as proposed by Pampel et al.16, which is a more suitable lineshape model as compared to the extrapolation method for on-resonance saturation rate estimations17,18.
Quantitative MT parameters T2,f, T2,b, R1,f (assuming R1,b=R1,f), MPF and exchange rate R were estimated from joint B1+-corrected VFA and Z-spectra data19 using three distinct frameworks: (A) SOFS data and neglecting on-resonance saturation (similar to the framework from Mossahebi et al.19), (B) SOFS data and accounting for on-resonance saturation, and (C) DOFS data and accounting for on-resonance saturation.
To assess the quantitative parameters in selected regions of interest (ROI), the MPRAGE image was used to retrieve white matter (WM) masks from the JHU probabilistic atlas20 using ANTs21 and deep grey matter (DGM) masks using FreeSurfer. Linear regressions and Bland-Altman analyses were performed, and average parameter values and root-mean-square error (RMSE) of the fit were reported.
Results
Representative axial views of T1,f and MPF maps derived from the three frameworks are presented in Figure 2.Figure 3 shows agreements and Bland-Altman plots comparing T1,f and MPF estimated from the three frameworks. First, not accounting for on-resonance saturation leads to an over-estimation of T1,f and an under-estimation of MPF, especially in WM (Figure 3a/b). Second, whereas the type of MT saturation pulse has minimal impact on the T1,f outcome (~9.3 to 14.5 ms absolute difference in average between SOFS and DOFS; Figure 3c), the use of DOFS enhances the MPF value prominently in WM (up to 3.4%-MPF increase in absolute value; Figure 3d).
Quantitative MT parameters in selected WM and DGM structures are reported in Table 2. Accounting for on-resonance saturation and using DOFS-prepared data improve the fitting procedure as emphasized by the decreasing RMSE of the fit (Table 2).
Discussion and conclusion
We demonstrated the importance of using DOFS pulses and accounting for on-resonance saturation effects to derive more accurately T1,f and MPF from the two-pool qMT model applied jointly on VFA- and MT-SPGR data.Since DOFS pulses remove the coupling between Zeeman and dipolar orders, DOFS data are adequately described by the classical two-pool qMT model, which does not include any dipolar order reservoir12. This is particularly evident in WM and translated into an increase of the MPF value. For a dipolar order effect to exist, a SOFS pulse power such that RRFB×T1D>0.01 is required22 (with RRFB the saturation rate of the preparation pulse, proportional to the pulse peak B1). Hence, long and relatively low-power SOFS pulses predominantly create dipolar order effects in WM, associated with long T1Ds10,11. Conversely, SOFS pulses induce less dipolar order effects in GM as it is characterized by shorter T1D values, and hence a lower difference between MPF values derived from SOFS and DOFS data was observed.
Modelling on-resonance saturation remains complex because the super-Lorentzian absorption lineshape varies rapidly around the resonance. Readout pulse durations typically do not exceed one millisecond in 3D non-selective SPGR experiments, corresponding to a large spectral profile. It hence leads to a varying macromolecular saturation as a function of the pulse duration at fixed power6. As such, the assumption of a unique frequency saturation may not be highly accurate, calling for further investigations on the modelling of such feature for the establishment of a general model.
Acknowledgements
This work was supported by the French National Research Agency, ANR [ANR‐17‐CE18‐0030] and ARSEP 2020.References
1. Yarnykh VL, Bowen JD, Samsonov A, et al. Fast Whole-Brain Three-dimensional Macromolecular Proton Fraction Mapping in Multiple Sclerosis. Radiology. 2015;274(1):210-220. doi:10.1148/radiol.141405282. Corrigan NM, Yarnykh VL, Hippe DS, et al. Myelin development in cerebral gray and white matter during adolescence and late childhood. Neuroimage. 2021;227(August 2020):117678. doi:10.1016/j.neuroimage.2020.117678
3. Yarnykh VL. Fast macromolecular proton fraction mapping from a single off-resonance magnetization transfer measurement. Magn Reson Med. 2012;68(1):166-178. doi:10.1002/mrm.23224
4. Yarnykh VL. Time-efficient, high-resolution, whole brain three-dimensional macromolecular proton fraction mapping. Magn Reson Med. 2016;75(5):2100-2106. doi:10.1002/mrm.25811
5. A.G. Teixeira RP, Malik SJ, Hajnal J V. Fast quantitative MRI using controlled saturation magnetization transfer. Magn Reson Med. 2019;81(2):907-920. doi:10.1002/mrm.27442
6. Soustelle L, Troalen T, Hertanu A, et al. On the variability of single-point MPF mapping in the human brain using different Variable Flip Angle T1 mapping protocols. In: Proceedings 29th Annual Meeting of ISMRM. Virtual meeting; 2021:498.
7. Morrison C, Mark Henkelman R. A Model for Magnetization Transfer in Tissues. Magn Reson Med. 1995;33(4):475-482. doi:10.1002/mrm.1910330404
8. Sled JG, Pike GB. Quantitative Interpretation of Magnetization Transfer in Spoiled Gradient Echo MRI Sequences. J Magn Reson. 2000;145(1):24-36. doi:10.1006/jmre.2000.2059
9. Carvalho VND, Hertanu A, Grélard A, et al. MRI assessment of multiple dipolar relaxation time (T 1D) components in biological tissues interpreted with a generalized inhomogeneous magnetization transfer (ihMT) model. J Magn Reson. 2020;311:106668. doi:10.1016/j.jmr.2019.106668
10. Varma G, Girard OM, Prevost VH, Grant AK, Duhamel G, Alsop DC. In vivo measurement of a new source of contrast, the dipolar relaxation time, T 1 D , using a modified inhomogeneous magnetization transfer (ihMT) sequence. Magn Reson Med. 2017;78(4):1362-1372. doi:10.1002/mrm.26523
11. Swanson SD, Malyarenko DI, Fabiilli ML, Welsh RC, Nielsen J-F, Srinivasan A. Molecular, dynamic, and structural origin of inhomogeneous magnetization transfer in lipid membranes. Magn Reson Med. 2017;77(3):1318-1328. doi:10.1002/mrm.26210
12. Varma G, Girard OM, Prevost VH, Grant AK, Duhamel G, Alsop DC. Interpretation of magnetization transfer from inhomogeneously broadened lines (ihMT) in tissues as a dipolar order effect within motion restricted molecules. J Magn Reson. 2015;260:67-76. doi:10.1016/j.jmr.2015.08.024
13. Lee J-S, Khitrin AK, Regatte RR, Jerschow A. Uniform saturation of a strongly coupled spin system by two-frequency irradiation. J Chem Phys. 2011;134(23):234504. doi:10.1063/1.3600758
14. Yarnykh VL, Kisel AA, Khodanovich MY. Scan–Rescan Repeatability and Impact of B 0 and B 1 Field Nonuniformity Corrections in Single‐Point Whole‐Brain Macromolecular Proton Fraction Mapping. J Magn Reson Imaging. 2020;51(6):1789-1798. doi:10.1002/jmri.26998
15. Malik SJ, Teixeira RPAG, West DJ, Wood TC, Hajnal J V. Steady‐state imaging with inhomogeneous magnetization transfer contrast using multiband radiofrequency pulses. Magn Reson Med. 2020;83(3):935-949. doi:10.1002/mrm.27984
16. Pampel A, Müller DK, Anwander A, Marschner H, Möller HE. Orientation dependence of magnetization transfer parameters in human white matter. Neuroimage. 2015;114:136-146. doi:10.1016/j.neuroimage.2015.03.068
17. Gloor M, Scheffler K, Bieri O. Quantitative magnetization transfer imaging using balanced SSFP. Magn Reson Med. 2008;60(3):691-700. doi:10.1002/mrm.21705
18. Malik SJ, Teixeira RPAG, Hajnal J V. Extended phase graph formalism for systems with magnetization transfer and exchange. Magn Reson Med. 2018;80(2):767-779. doi:10.1002/mrm.27040
19. Mossahebi P, Yarnykh VL, Samsonov A. Analysis and correction of biases in cross-relaxation MRI due to biexponential longitudinal relaxation. Magn Reson Med. 2014;71(2):830-838. doi:10.1002/mrm.24677
20. Wakana S, Caprihan A, Panzenboeck MM, et al. Reproducibility of quantitative tractography methods applied to cerebral white matter. Neuroimage. 2007;36(3):630-644. doi:10.1016/j.neuroimage.2007.02.049
21. Avants BB, Tustison NJ, Song G, Cook PA, Klein A, Gee JC. A reproducible evaluation of ANTs similarity metric performance in brain image registration. Neuroimage. 2011;54(3):2033-2044. doi:10.1016/j.neuroimage.2010.09.025
22. Manning AP, Chang KL, MacKay AL, Michal CA. The physical mechanism of “inhomogeneous” magnetization transfer MRI. J Magn Reson. 2017;274:125-136. doi:10.1016/j.jmr.2016.11.013
Figures
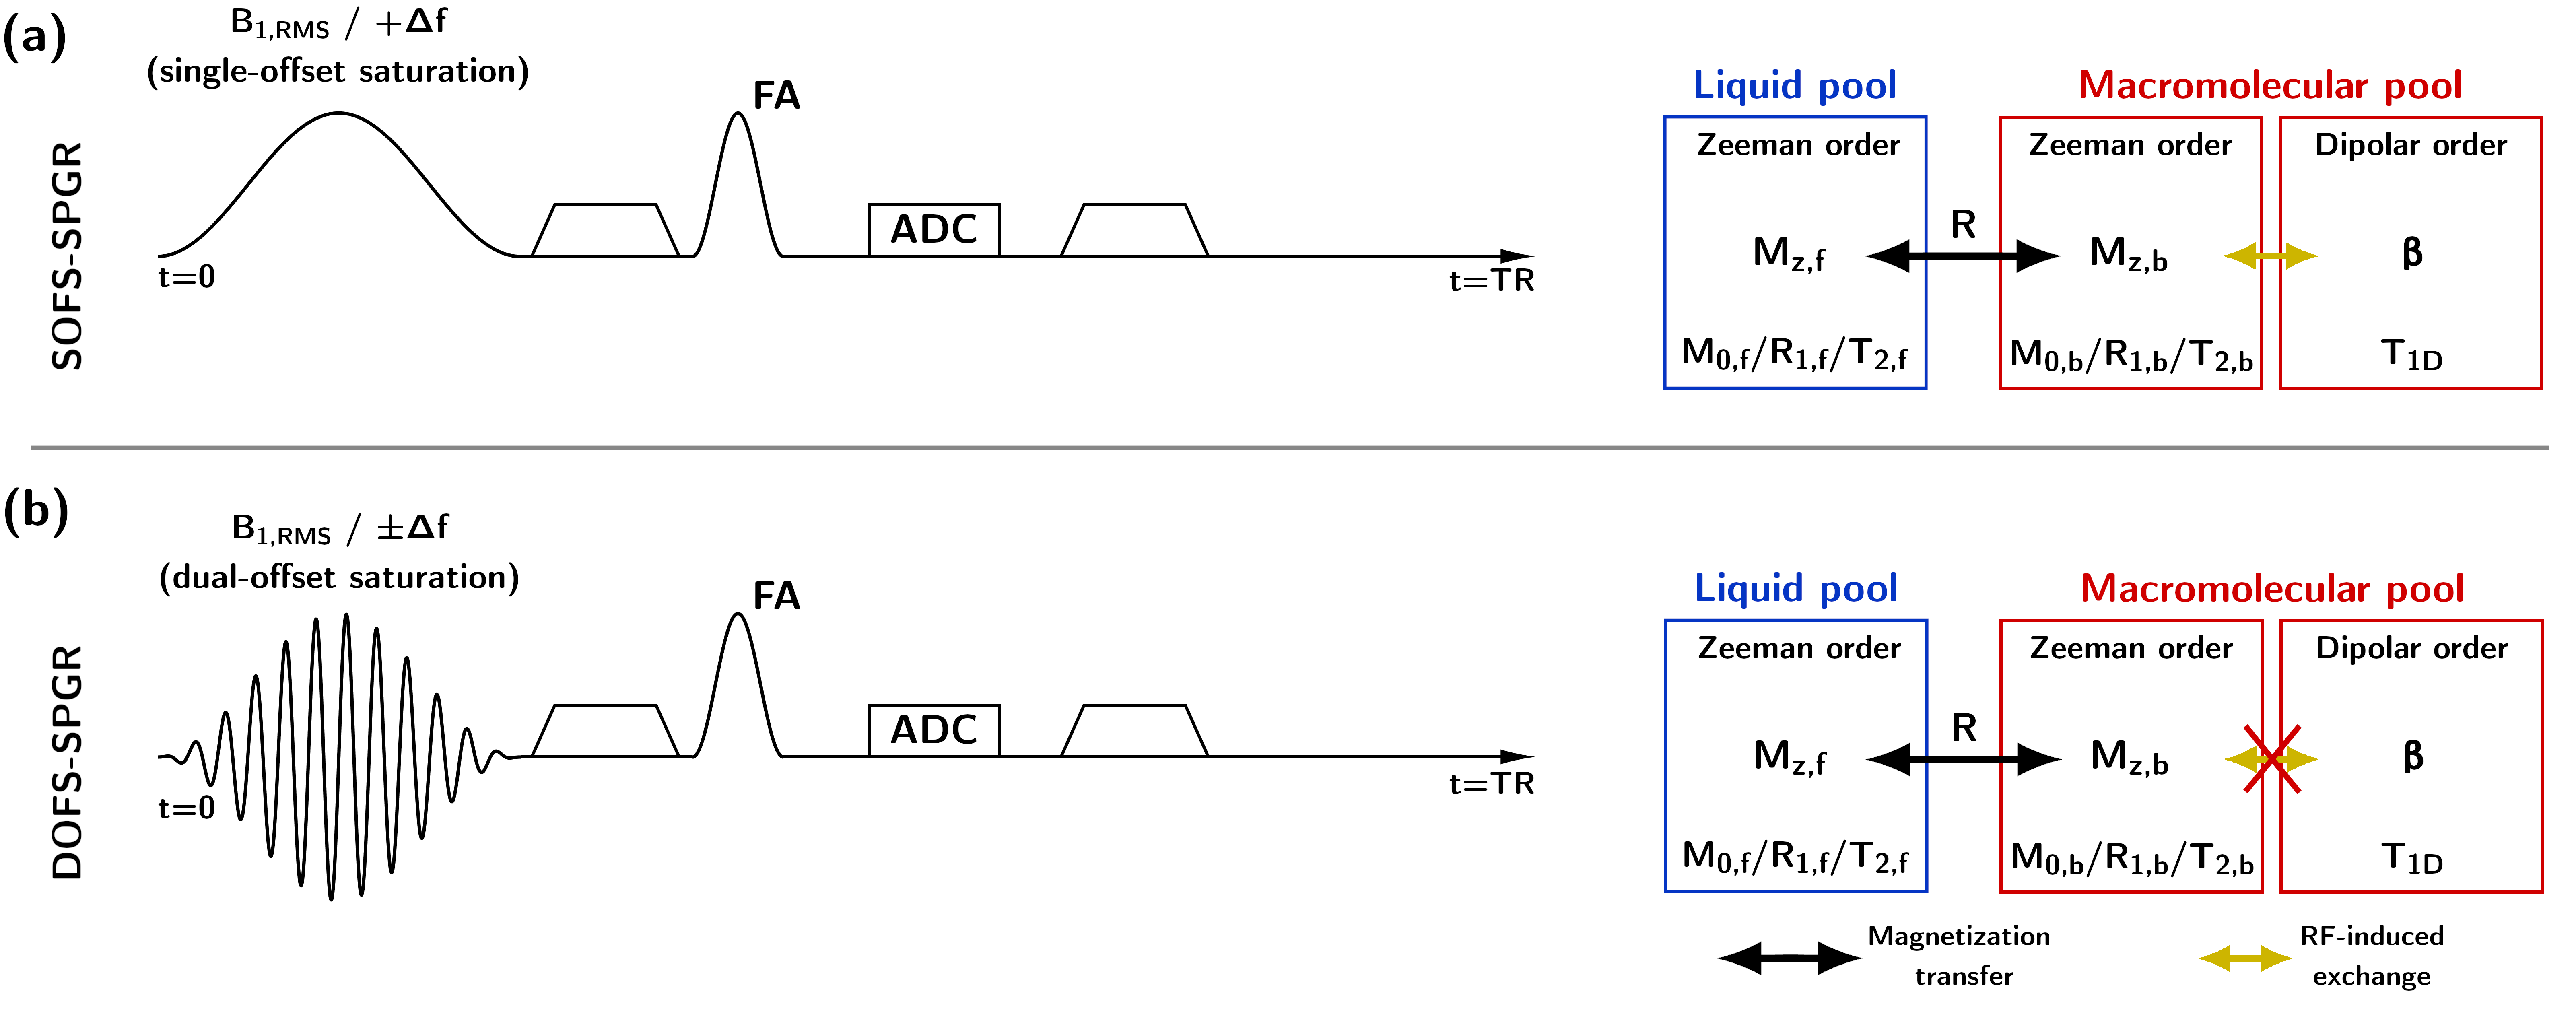
Figure 1: MT-prepared SPGR sequences with a single-offset (+Δf)
saturation pulse (SOFS) (a), and with a simultaneous symmetric dual-offset (±Δf)
saturation pulse (DOFS) (b). The use of a simultaneous DOFS pulse effectively decouples
the macromolecular Zeeman order from its associated dipolar order12,13. Conversely, SOFS couples dipolar order and Zeeman order. The
classical two-pool qMT model, which does not include a dipolar order reservoir,
is more accurately adapted to the DOFS-SPGR conditions.
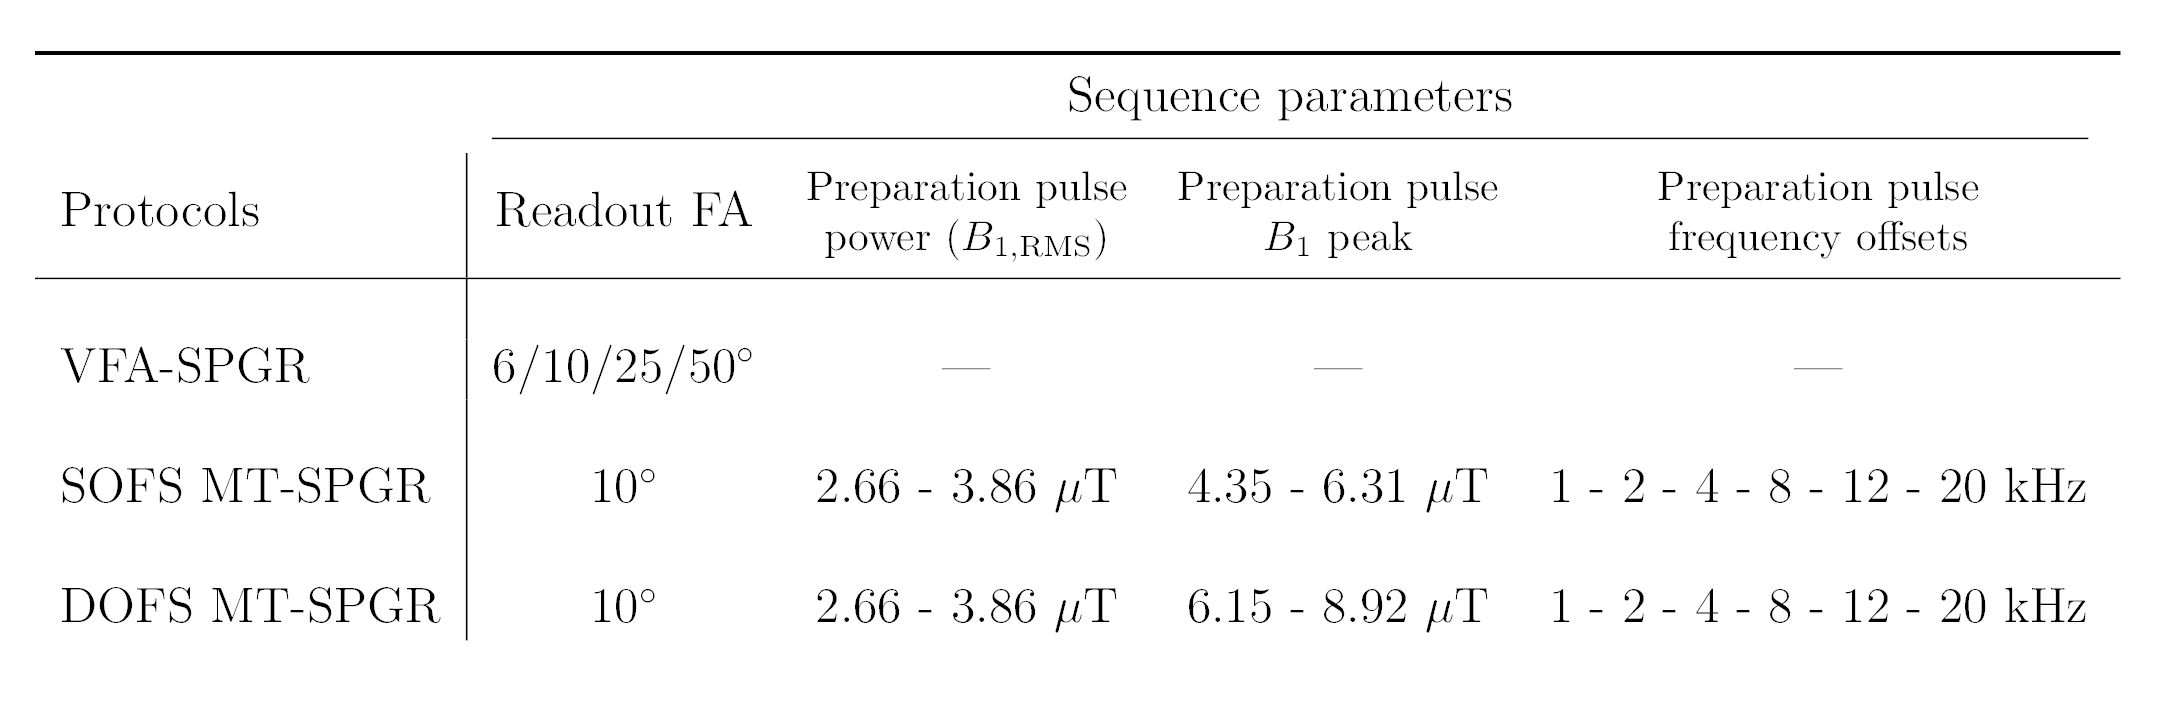
Table 1: Summary of
sequence parameters. Common parameters were: TR/TE=30.0/2.3 ms, readout pulse
duration of 1 ms (Hann-shaped), MT-preparation pulse duration of 12 ms
(Hann-shaped), resolution of 2-mm isotropic. Note
the √2 upscaling in peak B1 of DOFS pulses to compensate for the amplitude sine-modulation
that halves the energy deposition of the basic saturation pulse.
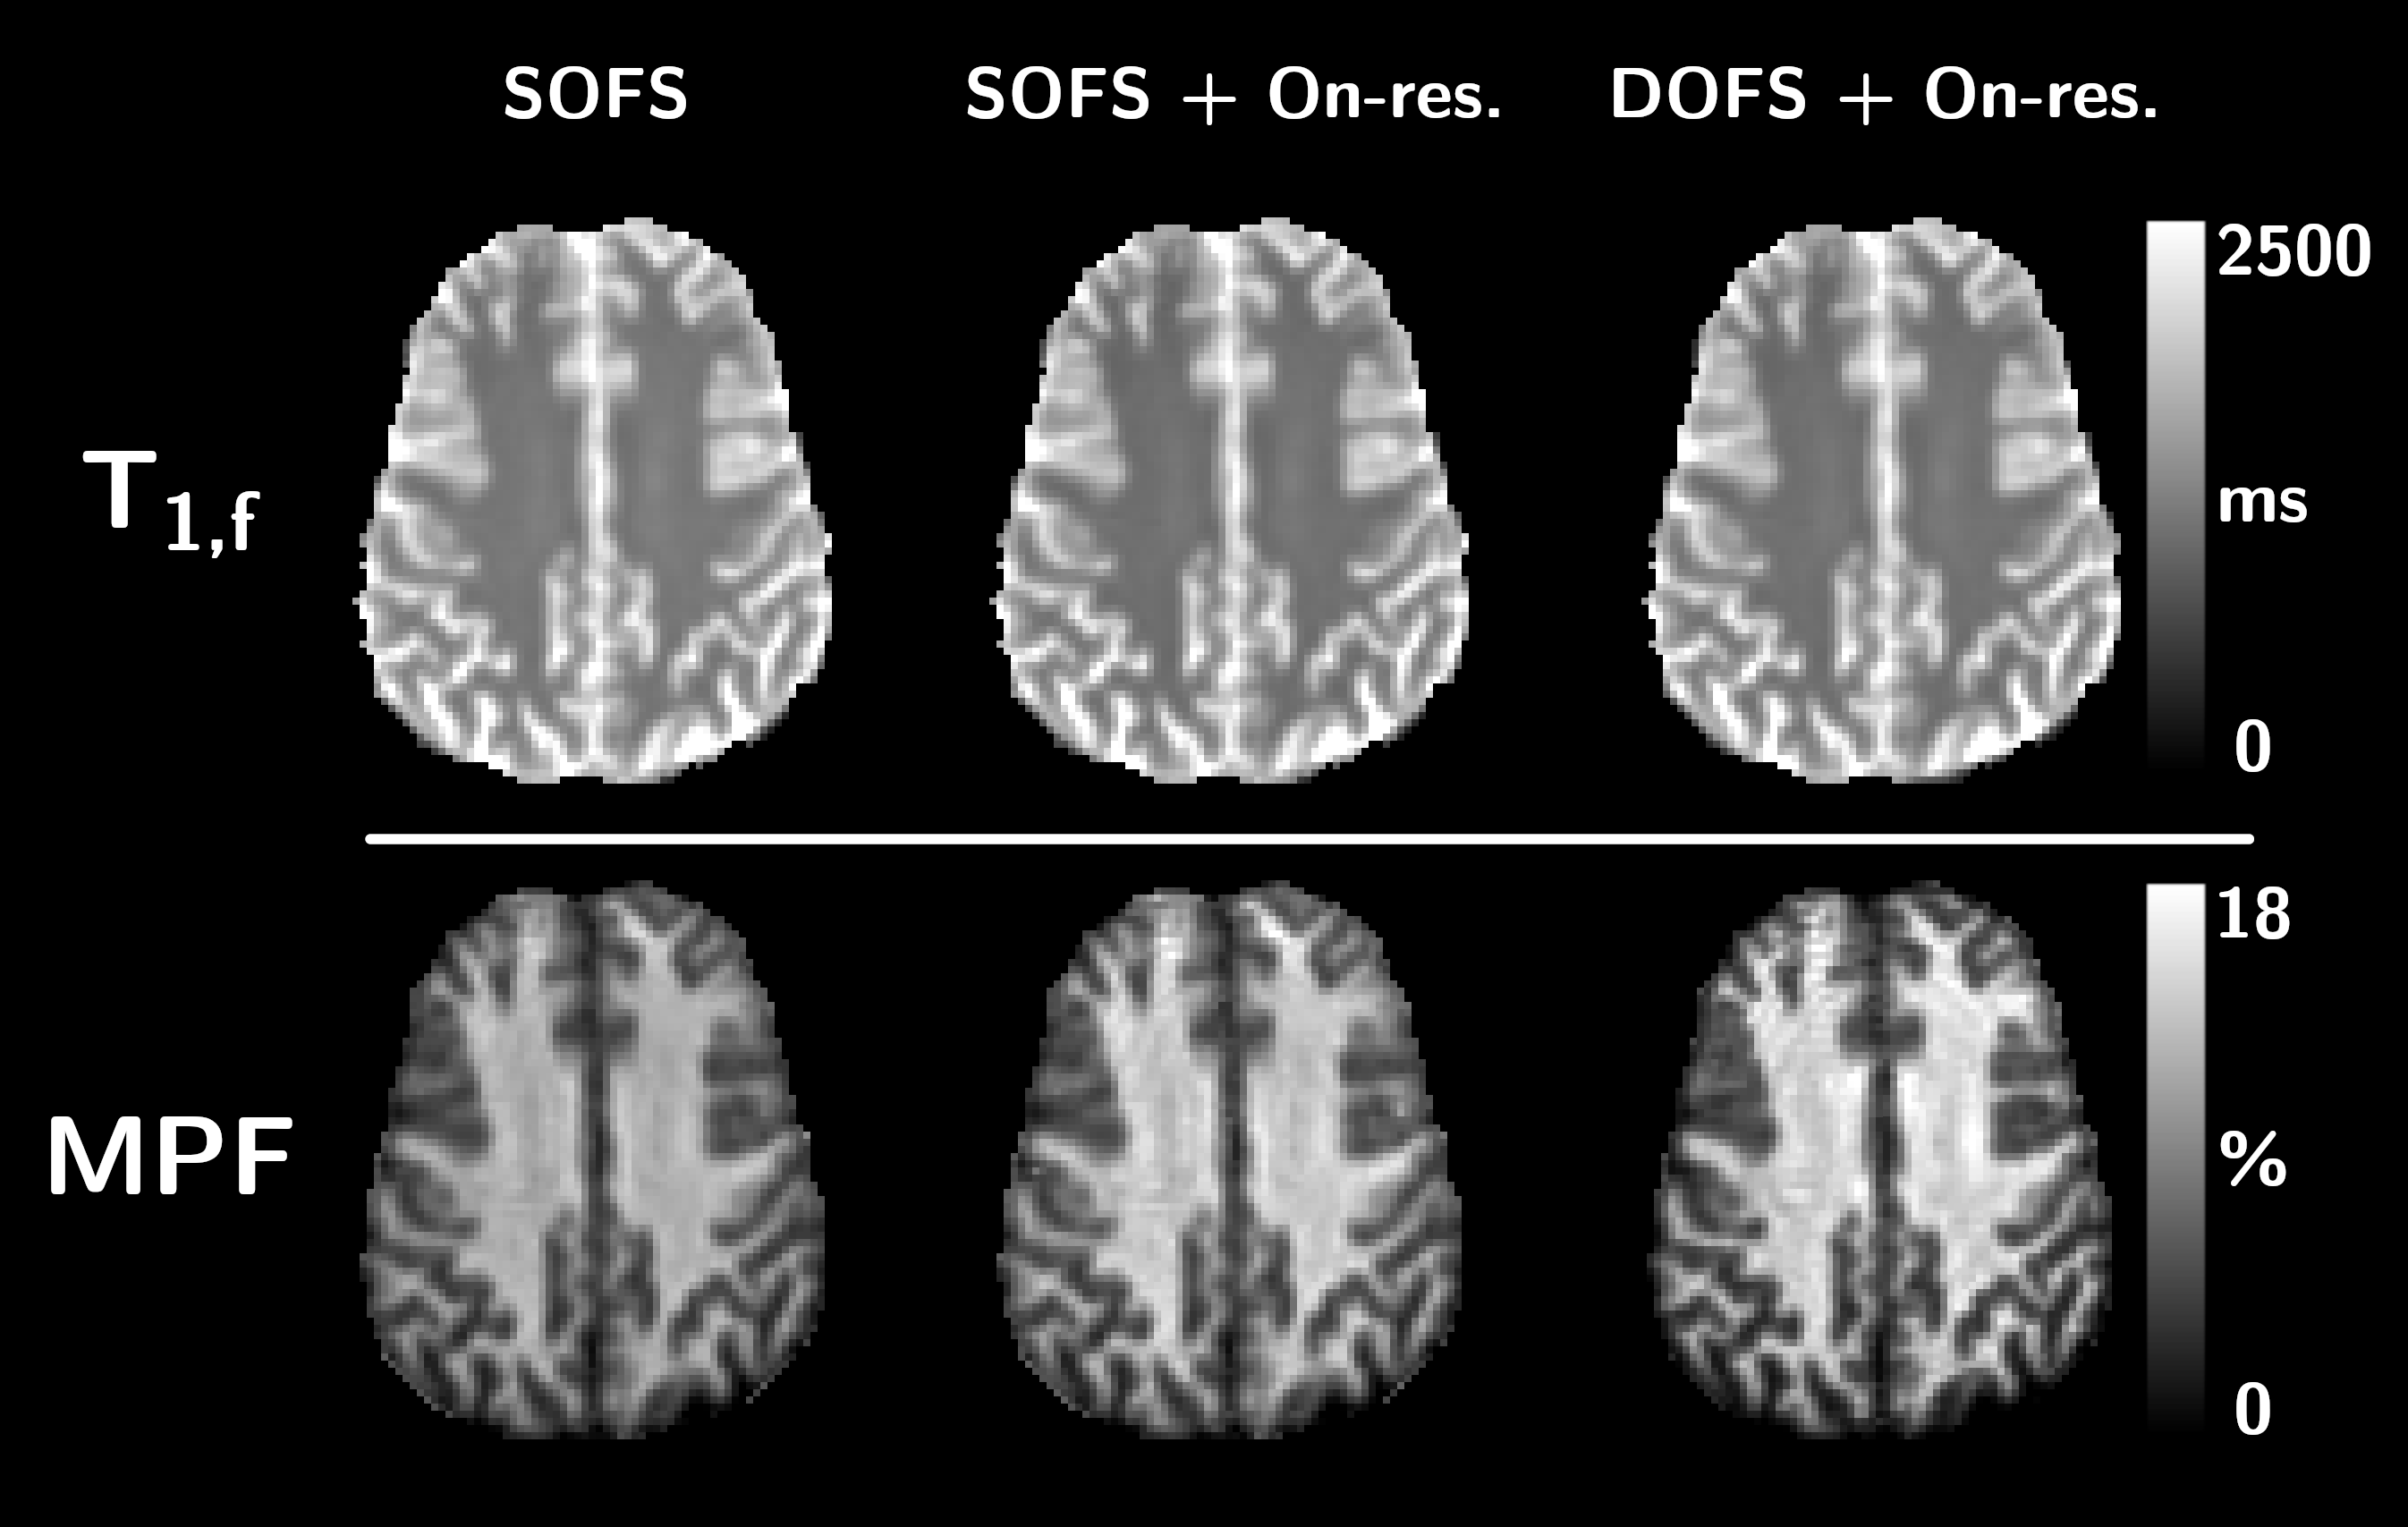
Figure 2: Representative axial views of T1,f (top) and MPF (bottom)
estimated from SOFS, SOFS+On-resonance saturation and DOFS+On-resonance
saturation frameworks.
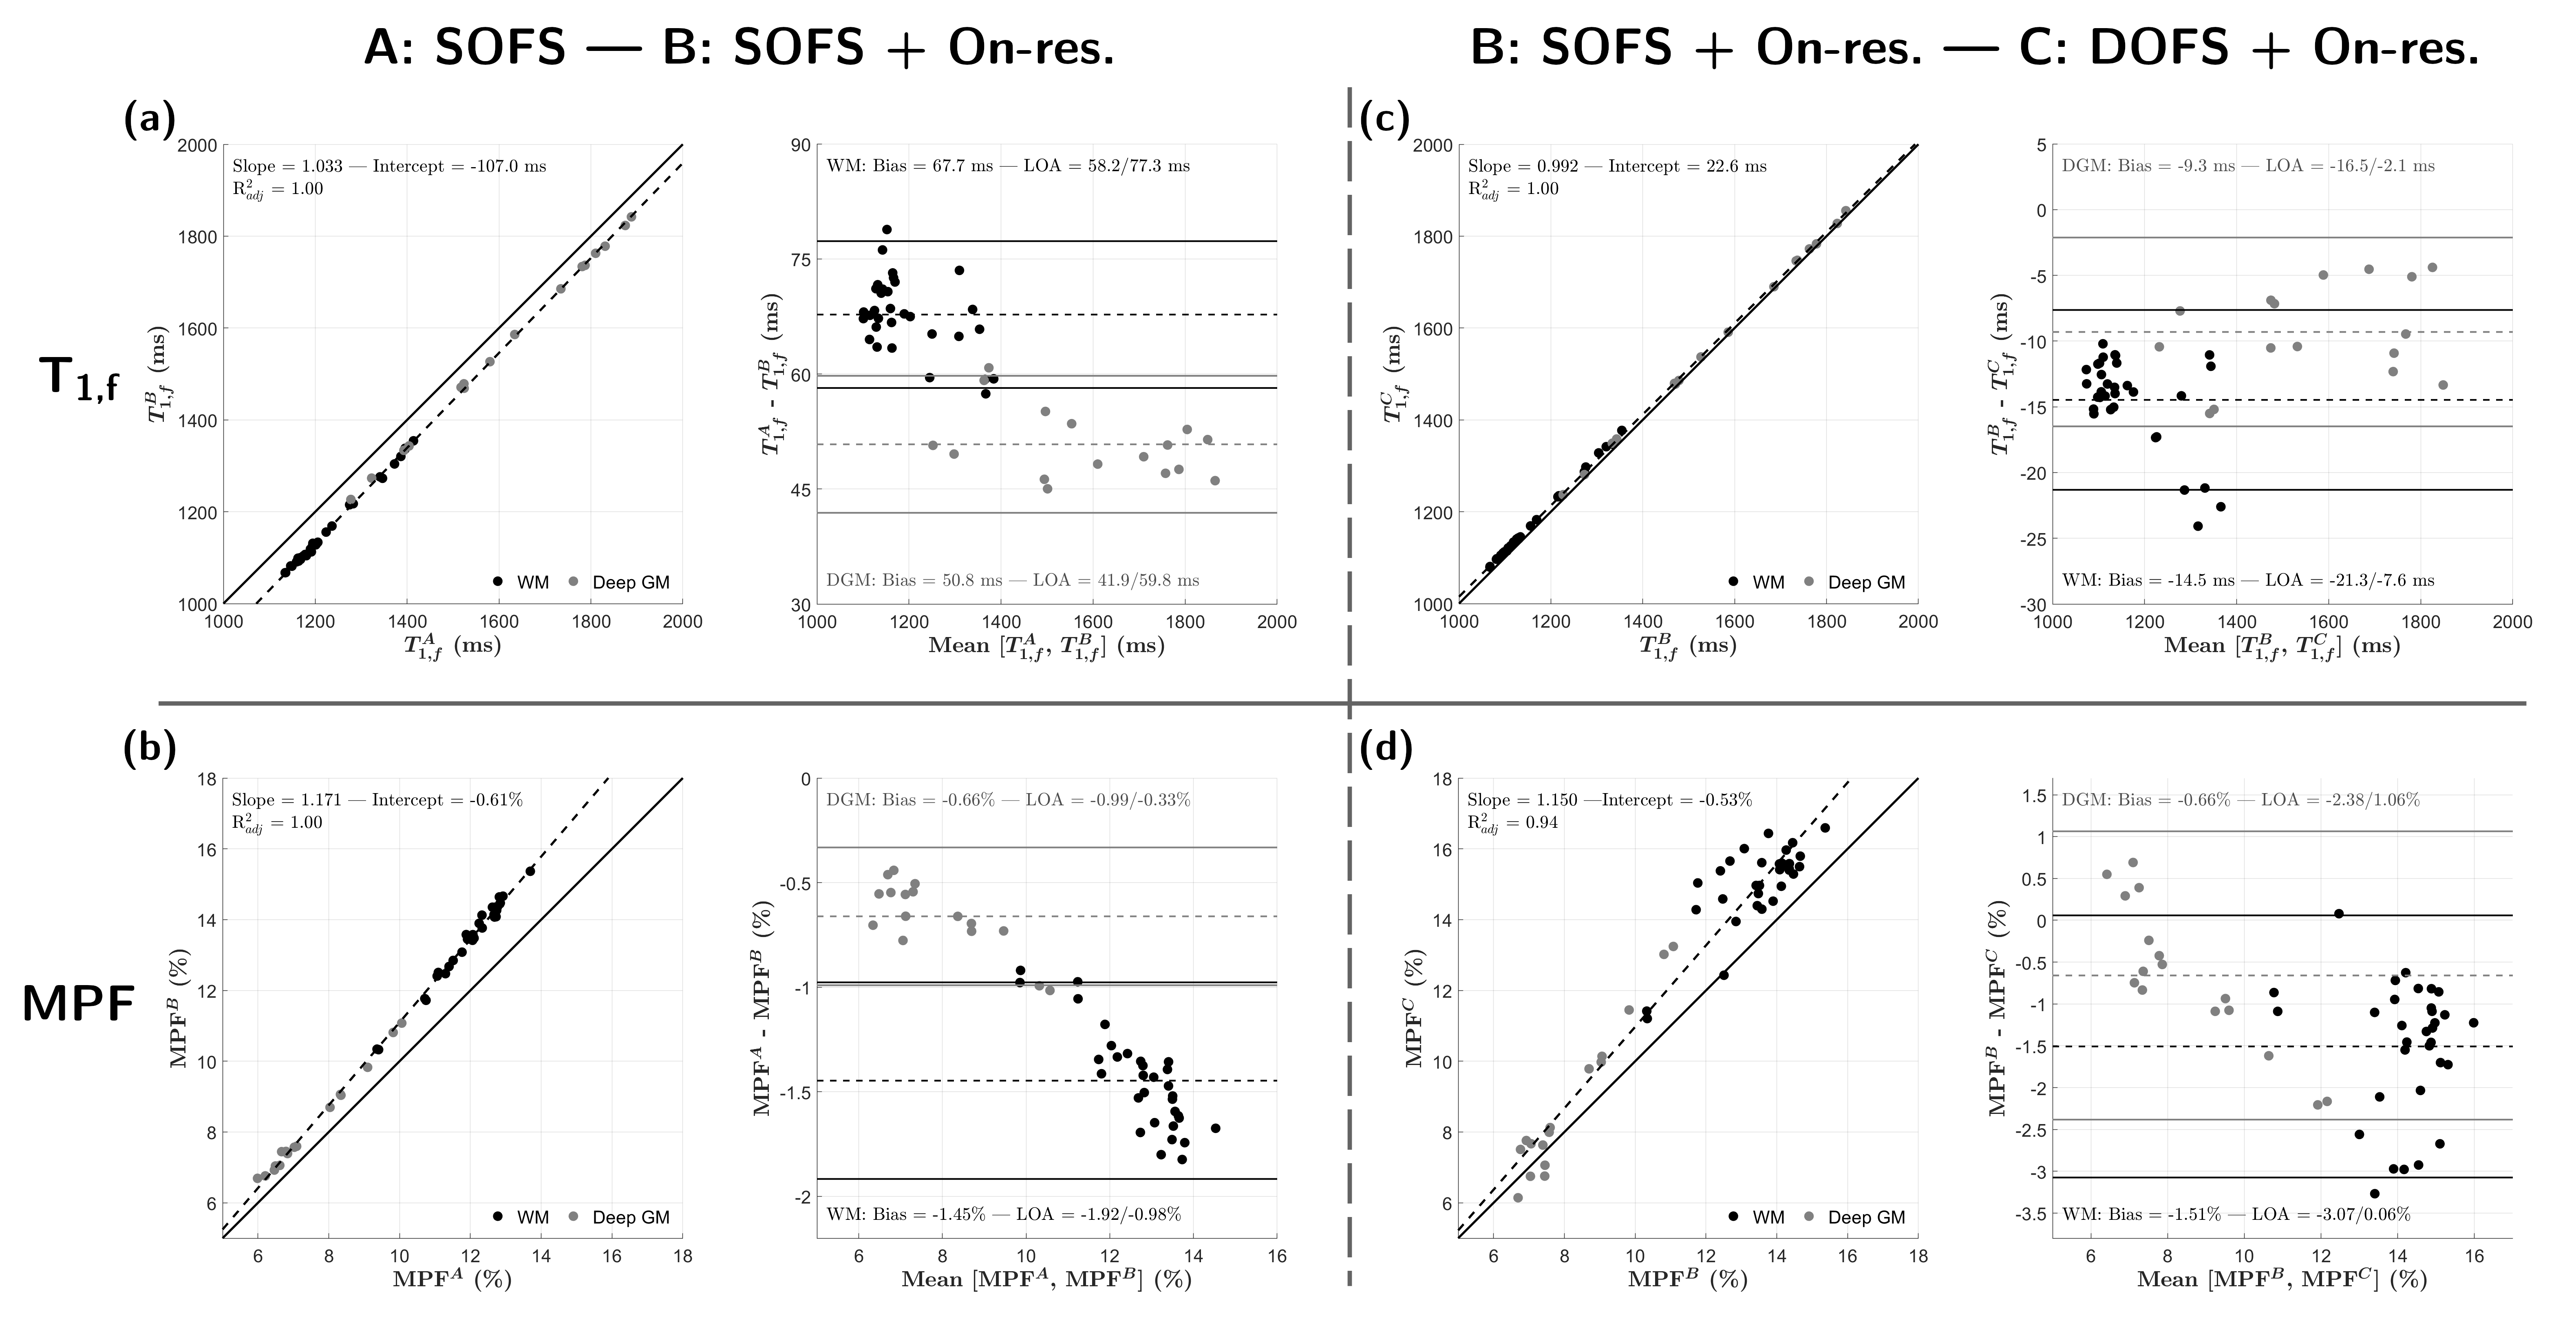
Figure 3: Agreement and Bland-Altman plots of T1,f and MPF from
ROI-averaged values in WM (black) and DGM (grey), between SOFS and
SOFS+On-resonance frameworks (a, b) and between SOFS+On-resonance and
DOFS+On-resonance frameworks (c, d). Regressions were performed on the joint
distribution of WM and DGM values (solid: line of unity; dashed: line of
regression), while biases (dashed line) and limits of agreement (LOA; solid
line) in Bland-Altman plots are reported each for WM and DGM distributions.
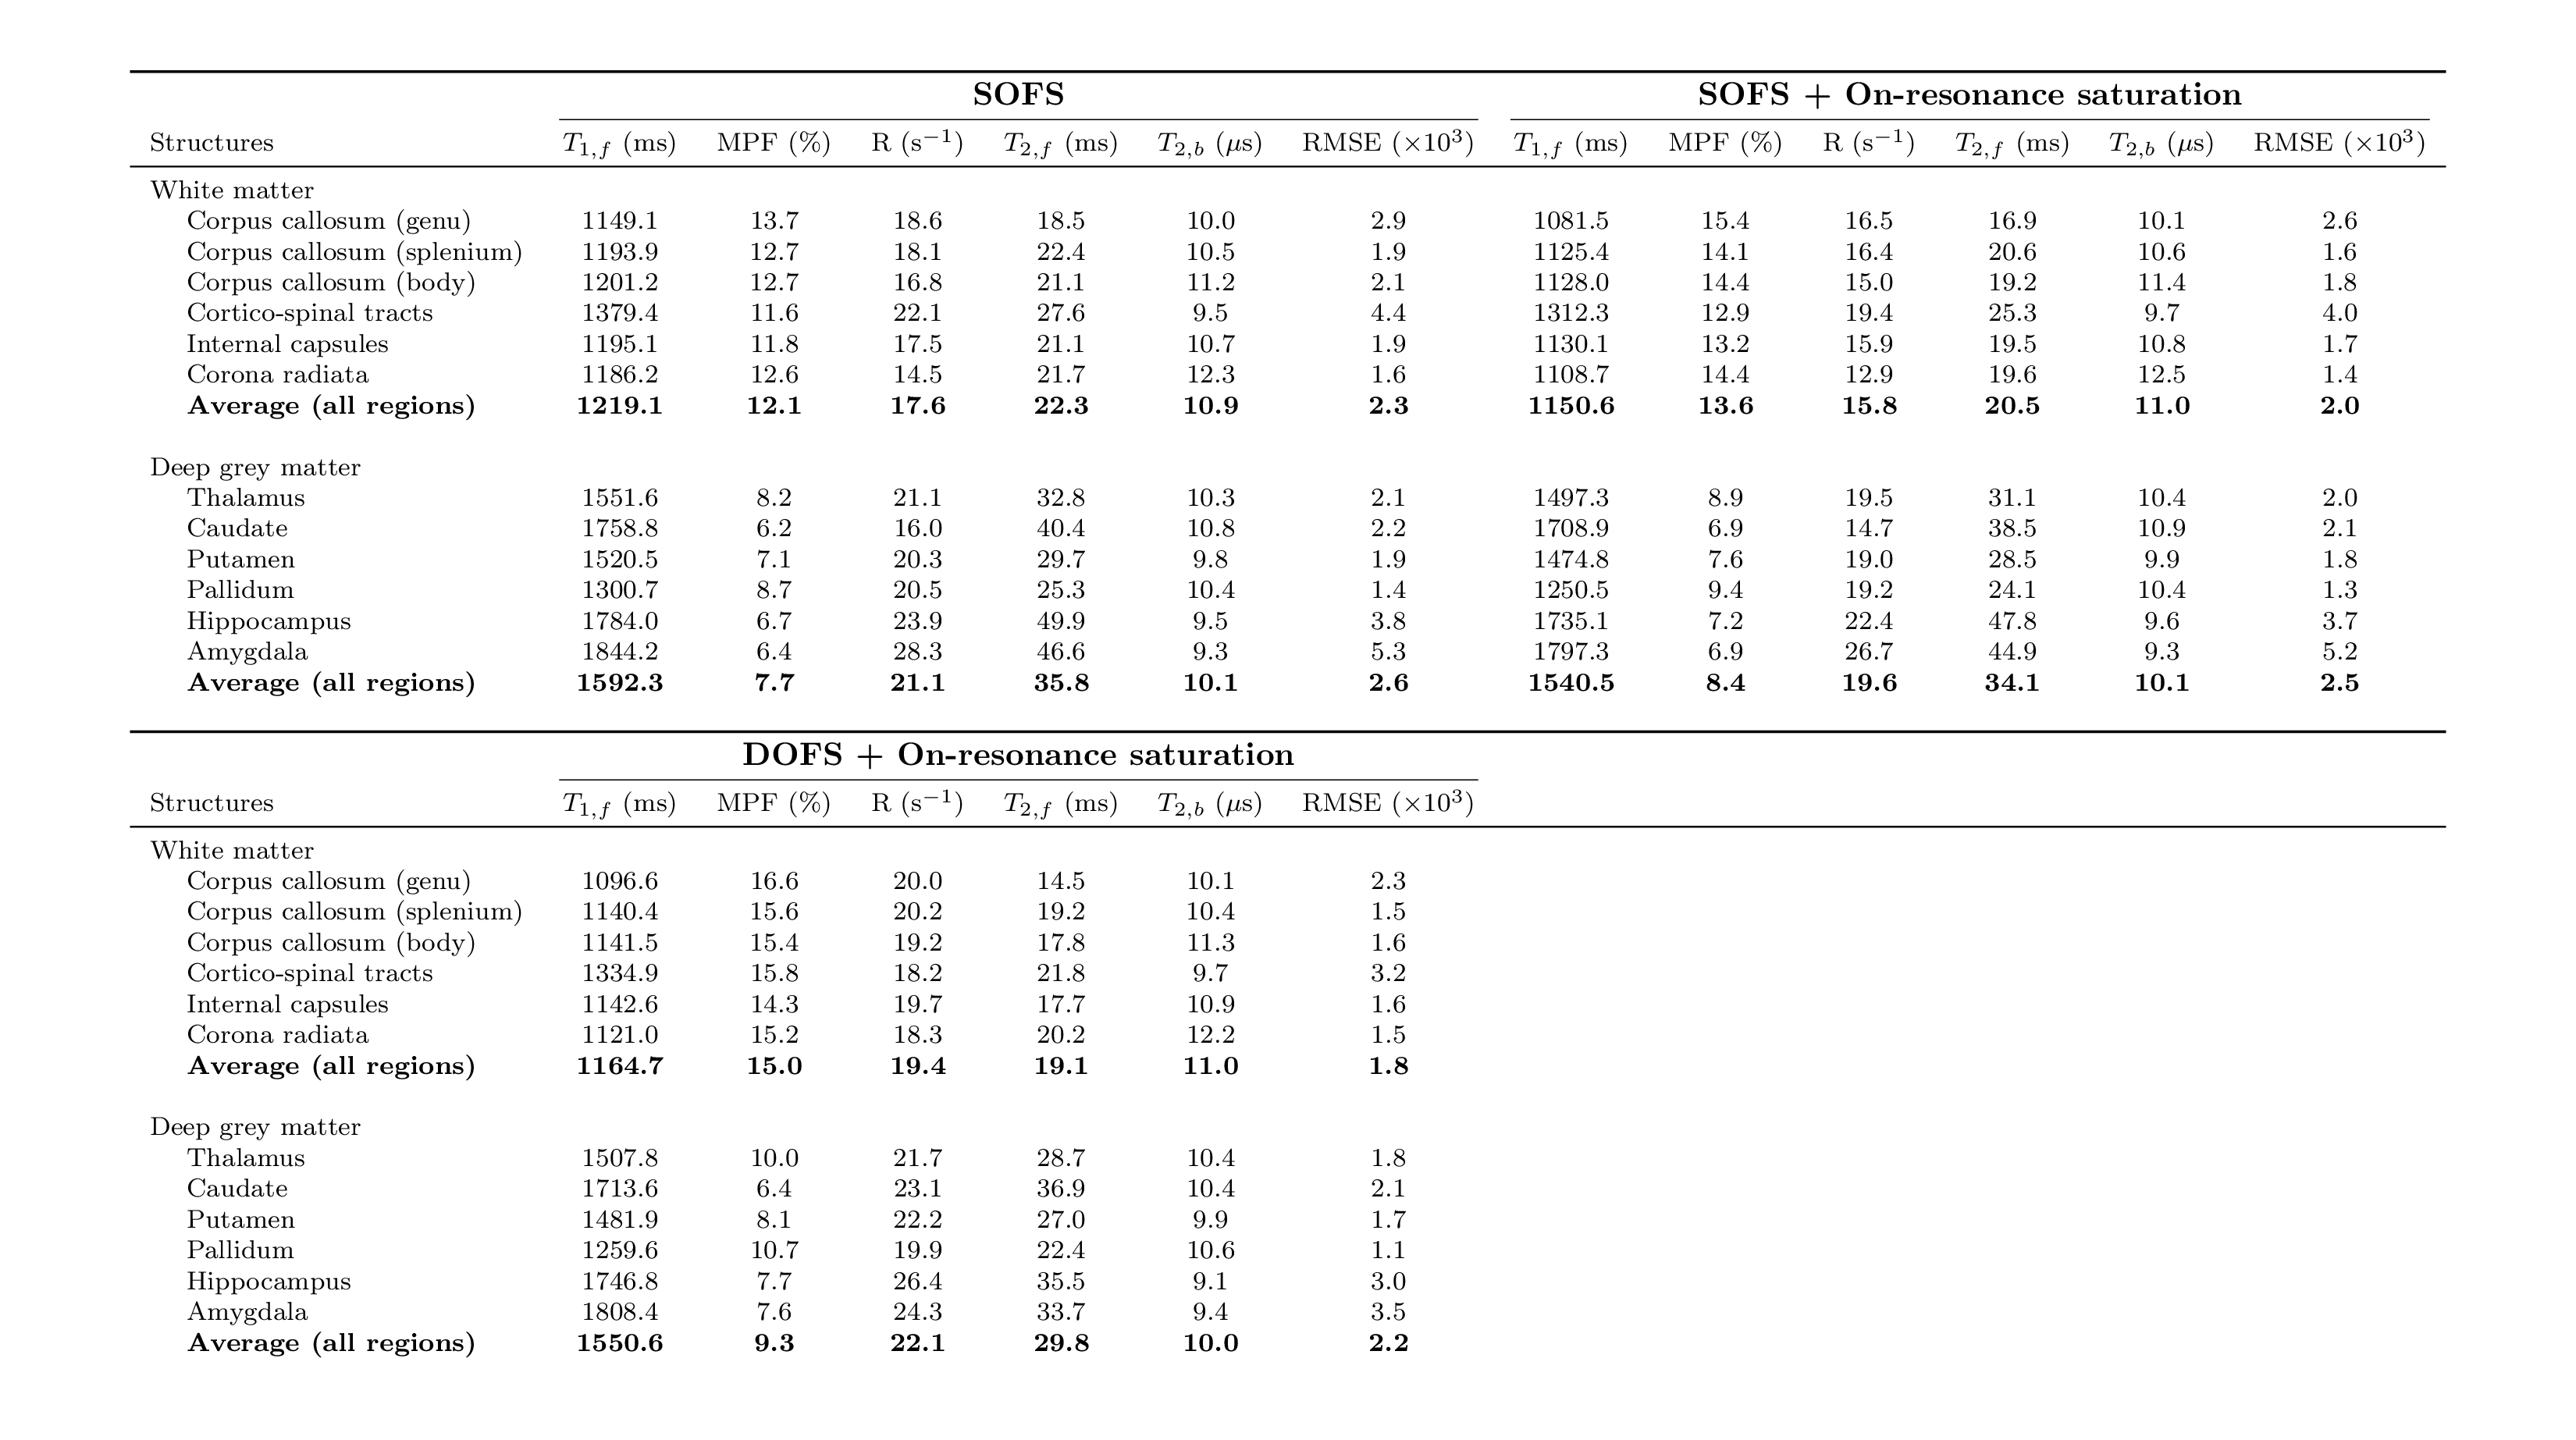
Table 2: Summary of average qMT-derived metrics and root-mean-square
error (RMSE) of the fit from SOFS, SOFS+On-resonance saturation and DOFS+On-resonance
saturation frameworks in WM and Deep GM structures.
DOI: https://doi.org/10.58530/2022/2709