2704
Validation of semi-automated analysis of pancreas MRI-PDFF using a scan re-scan cohort from the Long COVID-19 study (COVERSCAN)
Alexandre Triay Bagur1, Michael Brady2, Arun Jandor2, Paul Aljabar2, and Daniel Bulte1
1Department of Engineering Science, University of Oxford, Oxford, United Kingdom, 2Perspectum Ltd, Oxford, United Kingdom
1Department of Engineering Science, University of Oxford, Oxford, United Kingdom, 2Perspectum Ltd, Oxford, United Kingdom
Synopsis
Impairment of the pancreas has been shown in initial findings of the Long COVID-19 study (COVERSCAN), that uses quantitative MRI and expert manual analysis of the pancreas. Quantitative MRI analysis in such large-scale studies benefits from the decision support made possible by advanced image analysis methods. In this work, we validate a semi-automated pancreas processing pipeline that involves manual slice selection and automated segmentation and MRI-PDFF quantification. We show good agreement of the semi-automatic method with the reference manual processing by experts, as well as repeatable quantification in a scan re-scan subset of healthy subjects within COVERSCAN (n=35).
Introduction
Though image analysis research on COVID-19 initially focused on lung imaging, it has become increasingly clear that long COVID-19 also has substantial effects on other organs, including the heart, aorta, liver, pancreas, spleen, and kidneys. Increasing evidence of multiorgan impairment motivated the COVERSCAN study, which measures medium-term organ impairment in symptomatic individuals following recovery from acute SARS-CoV-2 infection (www.coverscan.com). Initial findings from the baseline study noted mild impairment of the pancreas, defined by PDFF ≥ 4.6% and/or T1 ≥ 803ms, in 40% of subjects, significantly different from healthy controls1. Hospitalisation was associated with pancreatic fibro-inflammation (p<0.01) and liver and pancreatic fat accumulation (p<0.01)1.The COVERSCAN study is ongoing and will generate a very large dataset of MR scans for multiple organs. The large scale of such studies both necessitates efficient MR analysis pipelines and benefits from increased decision support using advanced image analysis. Recently, we presented methods for increased automation in the quantification of pancreas MRI biomarkers, including fat (proton density fat fraction, PDFF) and fibro-inflammation (T1), using segmentation and registration techniques2,3. However, our methods needed validation against expert operators. Within COVERSCAN, a cohort of healthy controls was scanned twice within the same imaging session as part of a repeatability assessment. This work compares a semi-automated pipeline for the quantification of MRI-PDFF in the pancreas with the pre-existing fully manual analysis pipeline, using the COVERSCAN repeatability cohort.
Methods
Liver and pancreas imaging used the LiverMultiScan acquisition protocol (Perspectum, Oxford, UK), which comprises 2-D slice breath-hold acquisitions that are sensitive to fat content (proton density fat fraction, PDFF), and a Shortened MoLLI acquisition providing a measurement of T1, sensitive to fibro-inflammation. The slice was obliqued to follow the pancreas. Additionally, a volumetric fat-water scan was acquired, covering the entire liver, spleen, pancreas, and kidneys. A repeat scan was acquired after the subject left and then re-entered the scanner.Pancreas PDFF and T1 images were analysed by trained image analysts who are all experienced using the LiverMultiScan software. A number of (typically 3) regions of interest (ROIs) of 10 mm diameter were placed on pancreatic parenchyma, targeting the head, body, and tail where possible and avoiding the pancreatic duct. We refer to this as the fully manual method. The pooled ROI median was reported, yielding a global estimate of PDFF and T1 for each subject’s pancreas.
Our semi-automated method uses the same quantitative slice chosen by the image analysts for manual ROI placement and creates a pancreas segmentation by means of the volumetric fat-water scan. A 3-D pancreas segmentation was obtained from the volumetric scan, using an implementation of Attention U-Net presented previously3. The 3-D segmentation was resliced onto the 2-D PDFF quantitative slice to generate a 2-D pancreas segmentation on the PDFF map. Thresholding was used to remove non-pancreatic tissue, for instance visceral adipose tissue, prior to quantification (PDFF pixels >70% were excluded). Regions of high PDFF variability were assumed artefactual and were also excluded from quantification (regions with local standard deviation ≤ 6 using a 3-by-3 neighbourhood were kept). Image opening with a disk of 3 pixels diameter was used to smooth the mask.
We first assessed the agreement between the fully manual and our semi-automated method, to validate accuracy of the semi-automated method. Then, we compared the scan re-scan variability of both methods separately, to validate precision of the semi-automated method.
Results
Figure 1 shows the agreement between fully manual and semi-automated quantification of PDFF for Scan 1 and Scan 2. Good agreement was observed in Scan 1 and Scan 2 (bias=-0.1 and limits of agreement [-2.7, 2.5] for Scan 1 and Scan 2 combined). Figure 2 shows the scan-rescan repeatability of the semi-automated method, using Bland-Altman analysis4. Good repeatability of the semi-automated method was observed, with limits of agreement [-1.7, 2.7] and small bias of 0.5. Figure 3 shows an example subject processed by both methods.Discussion
No slice-to-volume registration was used since the volumetric scan and the quantitative maps were all well aligned, and therefore it would not have considerably changed derived quantification. The semi-automated method yielded results that were close to those from the fully manual method, demonstrating the potential of increased decision support in pancreas MRI analysis. Evidently, a semi-automated approach would increase efficiency and reduce inter-operator variation. Furthermore, our semi-automated method generates a 3-D pancreas segmentation which can be used for pancreas volume and morphology assessment, both clinically useful biomarkers in diabetes5. The 2-D segmentation also gives us the ability to report novel metrics beyond the currently reported whole-pancreas median, for example dispersion metrics such as interquartile range (IQR).Future work will assess the feasibility of applying the semi-automated method to the COVID-19 cohort of COVERSCAN, both the baseline and the follow-up acquisitions. While the method has shown good performance under these scanning settings on healthy volunteers, a downgrade in performance might be experienced when applying the method to a more heterogeneous disease cohort. This might necessitate a quality control pipeline to detect cases that would lead to poor semi-automated quantification.
Conclusion
The proposed semi-automated method for pancreas MRI analysis offers accurate and precise quantification of MRI-PDFF that can be used for robust assessment of pancreatic disease.Acknowledgements
We thank Perspectum Ltd for funding and computational resources, and the Engineering and Physical Sciences Research Council (EPSRC) for funding.References
- Dennis, A. et al. Multiorgan impairment in low-risk individuals with post-COVID-19 syndrome: A prospective, community-based study. BMJ Open 11, 2–7 (2021).
- Owler, J. et al. Pancreas Volumetry in UK Biobank: Comparison of Models and Inference at Scale. Lecture Notes in Computer Science (including subseries Lecture Notes in Artificial Intelligence and Lecture Notes in Bioinformatics) vol. 12722 LNCS (Springer International Publishing, 2021).
- Bagur, A. T. et al. Slice-to-Volume Registration Enables Automated Pancreas MRI Quantification in UK Biobank. vol. 2 (Springer International Publishing, 2021).
- Bland, J. M. & Altman, D. STATISTICAL METHODS FOR ASSESSING AGREEMENT BETWEEN TWO METHODS OF CLINICAL MEASUREMENT. Lancet 327, 307–310 (1986).
- Al-Mrabeh, A. et al. 2-year remission of type 2 diabetes and pancreas morphology: a post-hoc analysis of the DiRECT open-label, cluster-randomised trial. Lancet Diabetes Endocrinol. 8, 939–948 (2020).
Figures
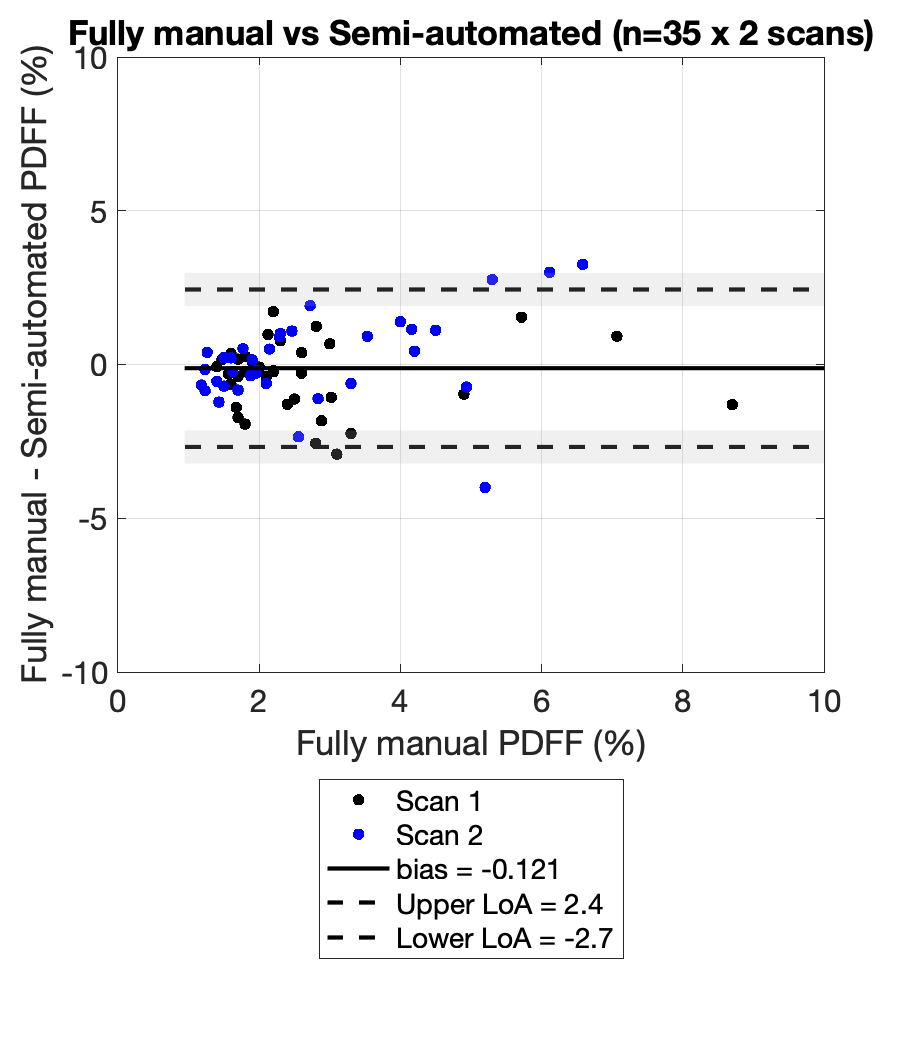
PDFF agreement of the fully manual method and the semi-automated method quantification.
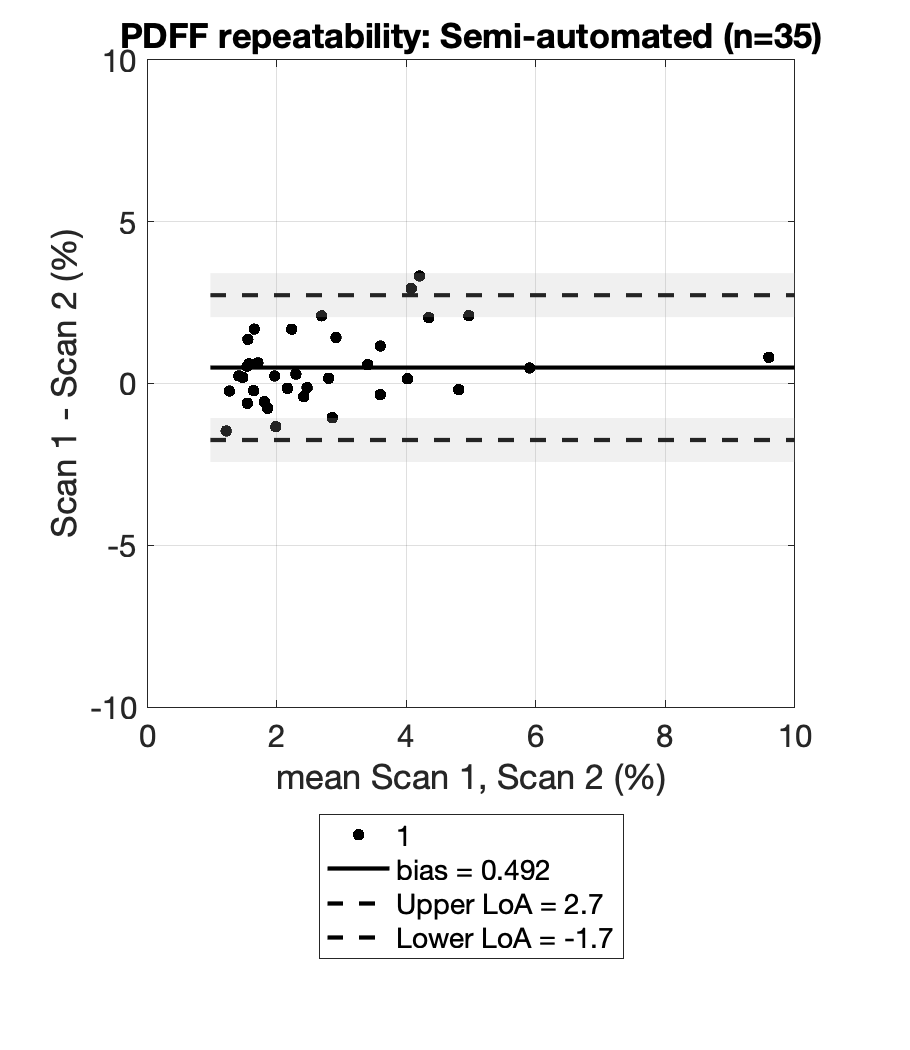
PDFF repeatability of the semi-automated method quantification.
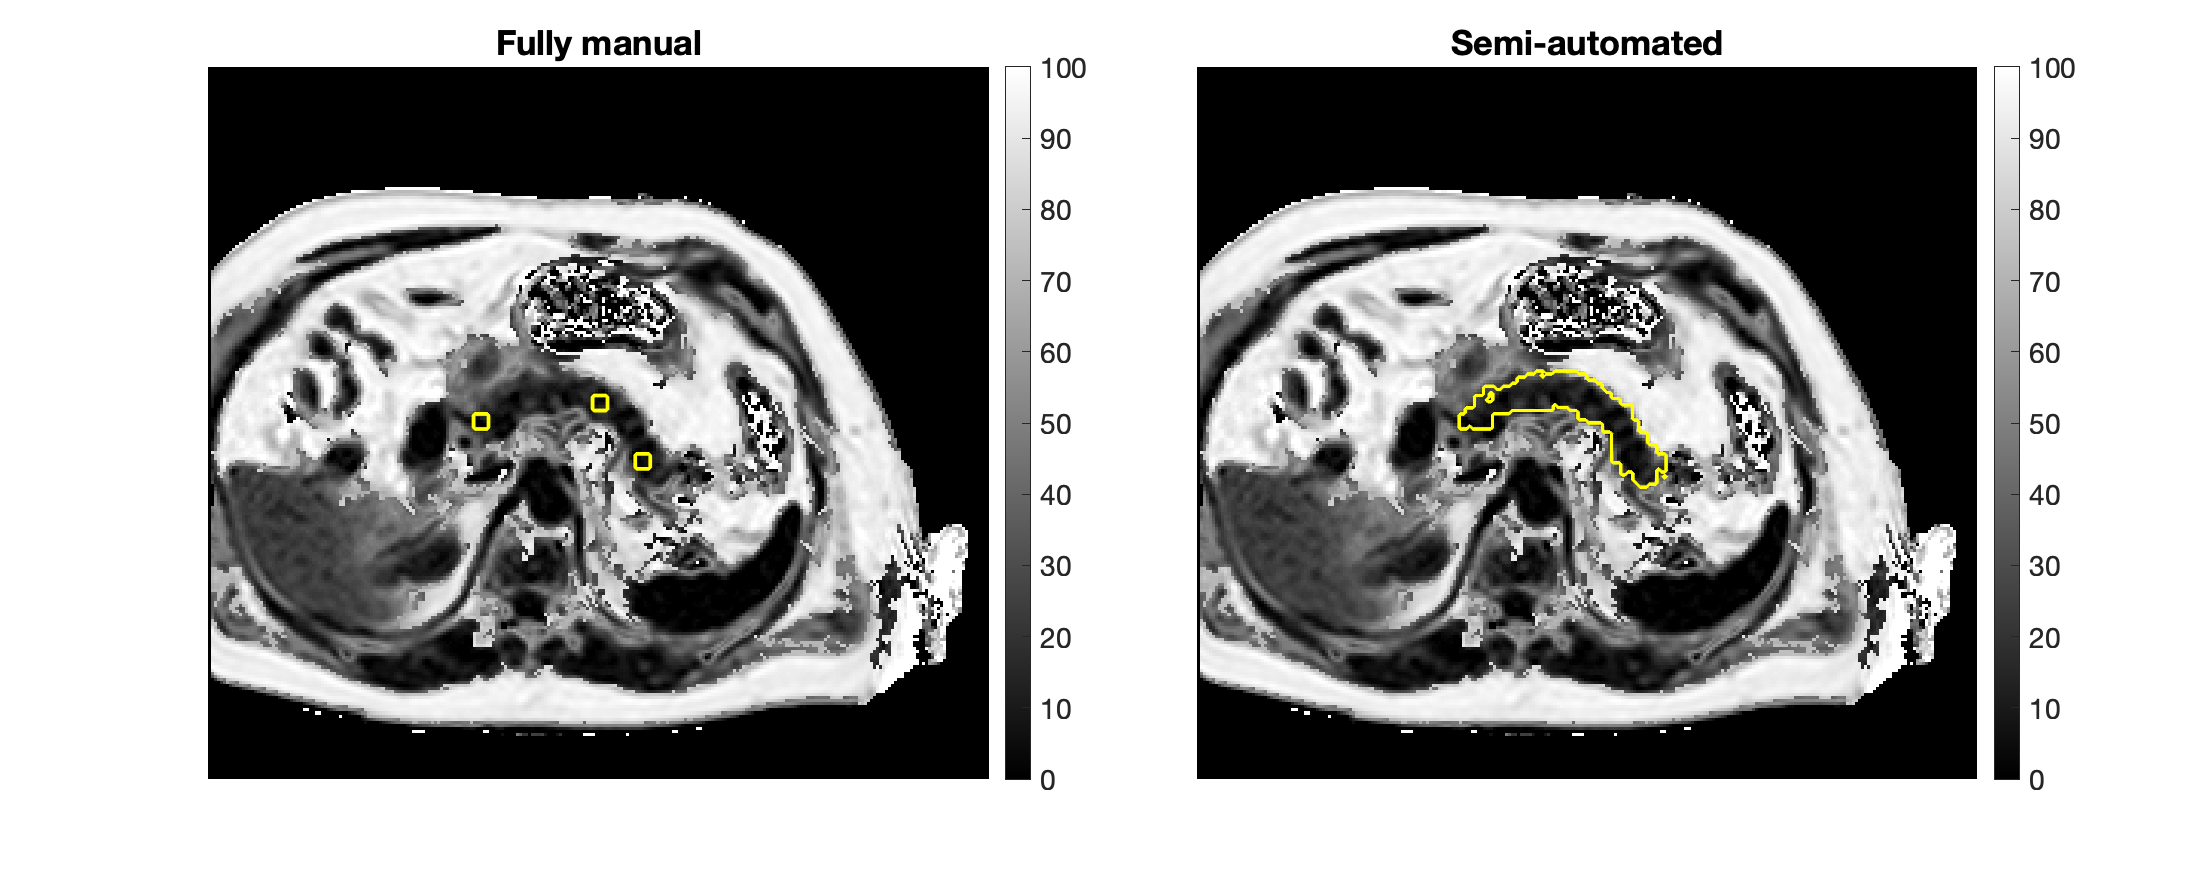
Example of ROI-based fully manual analysis and segmentation-based semi-automated analysis.
DOI: https://doi.org/10.58530/2022/2704