2703
Identifying perfused tissue regions through IVIM and ADC model comparison: technical validation1Christie Medical Physics and Engineering, The Christie NHS Foundation Trust, Manchester, United Kingdom, 2Division of Cancer Sciences, The University of Manchester, Manchester, United Kingdom, 3Department of Clinical Oncology, The Christie NHS Foundation Trust, Manchester, United Kingdom, 4Biomedical Imaging, University of Leeds, Leeds, United Kingdom, 5Department of Radiology, The Christie NHS Foundation Trust, Manchester, United Kingdom, 6Division of Radiotherapy and Imaging, The Institute of Cancer Research, London, United Kingdom
Synopsis
Intravoxel incoherent motion (IVIM) can provide information about tissue perfusion in tumours and organs at risk, but the model may not be applicable in all voxels in a region of interest. Here, a model comparison framework is developed, based on comparing IVIM and apparent diffusion coefficient model fits, aiming to identify perfused voxels and quantify the proportion of tissue containing a perfusion component, pIVIM. Technical validation of the framework is performed, with simulations and phantom data showing that SNR and diffusion properties can bias pIVIM, while in vivo parotid gland data show that pIVIM exhibits good repeatability.
Introduction
As intravoxel incoherent motion (IVIM)1 can provide information about tissue perfusion without the use of contrast agents, there is interest in using it repeatedly to assess longitudinal changes in head and neck (H&N) tumours and organs at risk (OARs) during radiotherapy2,3. Previous work has shown how different diffusion-weighted MRI models are favoured in different regions of soft tissue sarcomas4 and prostate cancer bone metastases5. This work introduces a framework for comparing IVIM and apparent diffusion coefficient (ADC) models, with the hypothesis that IVIM-favoured voxels reflect perfused regions. Technical validation6 is performed through simulations, phantom experiments, and repeated pre-treatment scans of patients with H&N cancer.Methods
Simulations: Signals were generated according to IVIM (S = S0[fexp(-bD*) + (1-f)exp(-bD)] ) and ADC ( S = S0exp(-bADC) ) models, where f is the perfusion signal fraction, D* is the pseudo-diffusion coefficient, D is the tissue diffusion coefficient; two sets of model parameter values were used, taken from literature values for the parotid glands2. b-values of 0, 20, 40, 60, 80, 100, 150, 200, 300, 400, 500, 800 s/mm2 were used, matching those used experimentally (see below). Noise was added to the signals, with all resulting noisy signals fitted using both IVIM and ADC expressions. Fits were compared using the corrected Akaike information criterion (AICc), taking the model with the lowest AICc as the preferred model. The ability to correctly identify the model from which the data were generated was evaluated for synthetic ‘tissues’ with a range of ground truth proportions of IVIM-favoured voxels, pIVIM.Phantom experiments: An ice-water phantom (High Precision Devices) with 13 ADC values (0.1 – 1.1 μm2/ms) was scanned on a 1.5 T Philips Ingenia using a single-shot EPI diffusion sequence (12 b-values as above, TR = 3000 ms, TE = 65 ms, voxel size = 3x3x5 mm3), and the model comparison framework was applied. The ADC model is predicted to be preferred throughout, as the phantom has no perfusion component.
Patient scans: Eight patients with H&N tumours were scanned using the same scanner and sequence as the phantom experiments. Patients were recruited to the imaging sub-study of the TORPEdO trial6, and provided written informed consent. Patients had two repeated scans pre-treatment (5±2 days apart) to assess imaging biomarker repeatability, before starting radiotherapy. Patients were scanned in their radiotherapy treatment planning position, with a thermoplastic shell. The model comparison framework was applied to the pre-treatment datasets, to evaluate pIVIM in the parotid glands.
Results
Simulations: Figure 1 plots estimated values of the proportion of IVIM-favoured voxels against the ground truth. At realistic noise levels there is a tendency to misclassify IVIM voxels as ADC voxels, resulting in an underestimation of pIVIM; the magnitude of the underestimation tends to increase as pIVIM increases. The degree of underestimation also depends on model parameter values, with higher D* and f values aiding the distinction between ADC and IVIM voxels (Figure 1, comparing left and right plots).Phantom experiments: Figure 2 shows model preference maps for three central slices of the phantom, along with b = 0 s/mm2 images and ADC maps. As expected, the ADC model (blue) tends to be preferred throughout the 13 vials. For the vials with the lowest ADCs (<~0.4 μm2/ms), a number of voxels show preference for the IVIM model. Spurious IVIM-favoured voxels are also observed at vial edges and in ice water surrounding the vials.
Patient scans: Figure 3 shows plots of signal against b-value for three voxels in the parotid gland, illustrating that ADC and IVIM models may be preferred in different regions. Figure 4 shows model preference maps overlaid on a b = 0 s/mm2 image, again showing the presence of ADC-favoured and IVIM-favoured voxels across both parotids. Figure 5 plots pIVIM for both pre-treatment scans. Across all patients and visits, pIVIM = 0.79 ± 0.05, with a within-subject coefficient of variation of 5.4%.
Discussion
Taken together, the simulations and phantom data highlight different factors which can lead to bias in quantifying the proportion of voxels where IVIM is preferred. Low SNR can lead to an underestimation of pIVIM, with genuine IVIM voxels misclassified as favouring ADC, likely due to noisy data being unable to support the increased complexity of the IVIM model. The phantom data indicate that in low ADC regions, voxels may be incorrectly identified as favouring the IVIM model; however, for clinically-relevant ADC values (>0.4 μm2/ms), areas genuinely lacking a perfusion component are reliably identified as such. In the parotid glands there is evidence of both models being preferred, indicating that applying a single model to all voxels may not be appropriate. Despite the potential biases indicated by the simulations and phantom data, the proportion of voxels favouring IVIM, and hypothesised to include a perfusion component, exhibits good repeatability in vivo.Conclusion
The combination of simulations and phantom data highlights how SNR and diffusion properties can bias pIVIM, while patient scans show it is repeatable in the parotid glands. This technical validation aids interpretation of attempts to identify perfused tissue regions through ADC and IVIM model comparison. Future work will aim to quantify uncertainties in the model comparison framework using the magnitude of the difference in AICc values.Acknowledgements
This work was supported by funding from Cancer Research UK (CRUK/18/010) and The Taylor Family Foundation. The authors acknowledge The Institute of Cancer Research as the sponsor of the TORPEdO trial.References
[1] Le Bihan. NeuroImage, 2019;187:56–67. [2] Zhou et al. BMC Cancer, 2016;16:865. [3] Marzi et al. Radiat Oncol, 2018;13:189. [4] Manikis et al. Eur J Radiol, 2021;138:109660. [5] Reischauer et al. Sci Rep, 2017;7:5809. [6] O'Connor et al. Nat Rev Clin Oncol, 2017;14:169-186. [7] Price et al. Clin Oncol, 2020;32:84-88.Figures
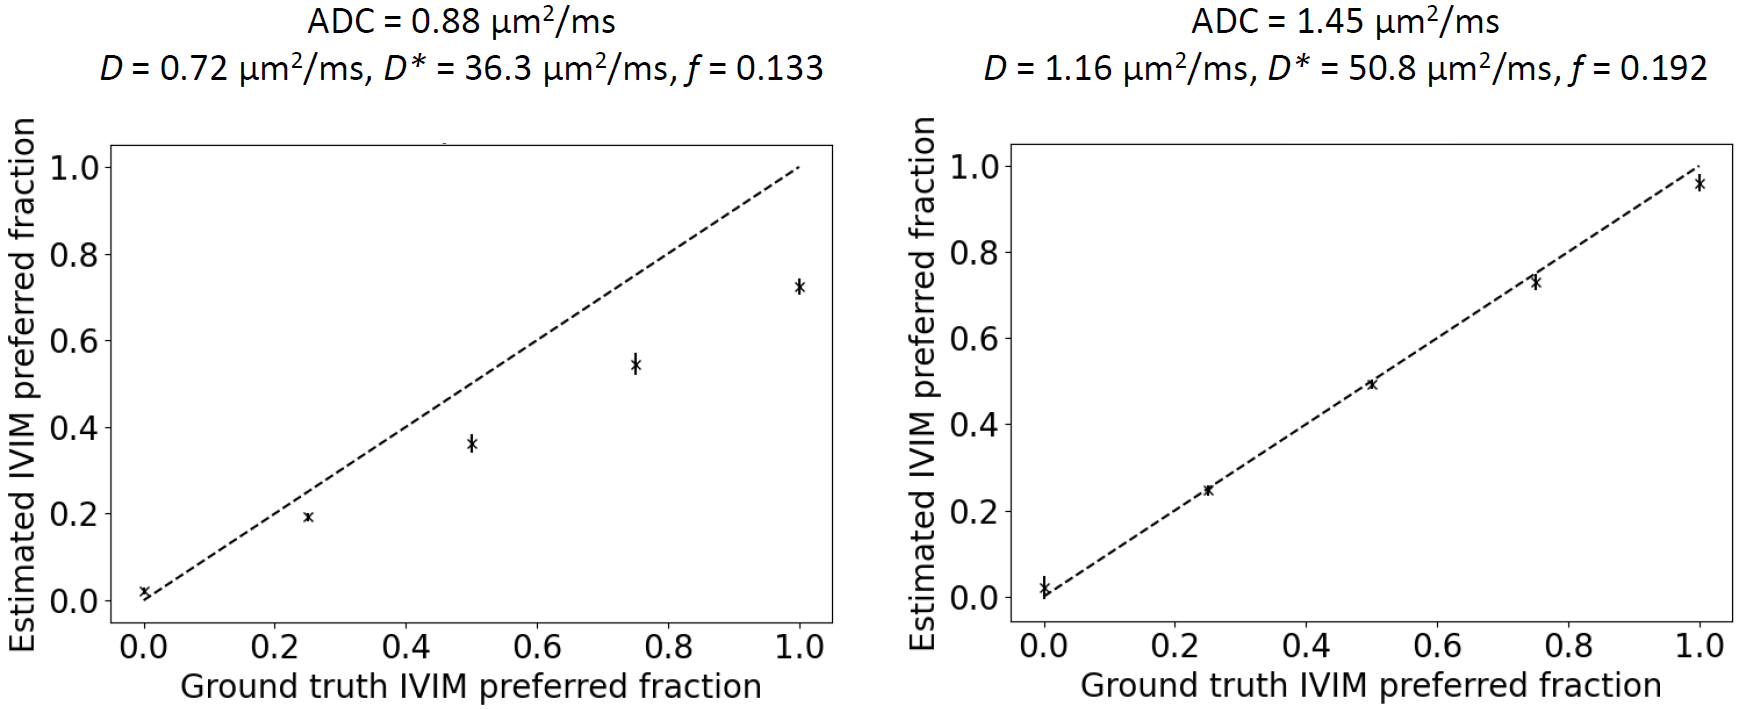
Figure 1. Simulation results. Plots show the estimated fraction of IVIM-favoured voxels as a function of the ground truth. The dashed line represents the results with noise-free data, where the ground truth is estimated perfectly. The crosses show the results with SNR = 30, plotting mean ± SD over 5 repetitions, for synthetic ‘tissues’ with 196 voxels. Left and right plots were generated using different ground truth ADC and IVIM parameters values [2]: ADC = 0.88 μm2/ms, D = 0.72 μm2/ms, D* = 36.3 μm2/ms, f = 0.133 (left); ADC = 1.45 μm2/ms, D = 1.16 μm2/ms, D* = 50.8 μm2/ms, f = 0.192 (right).
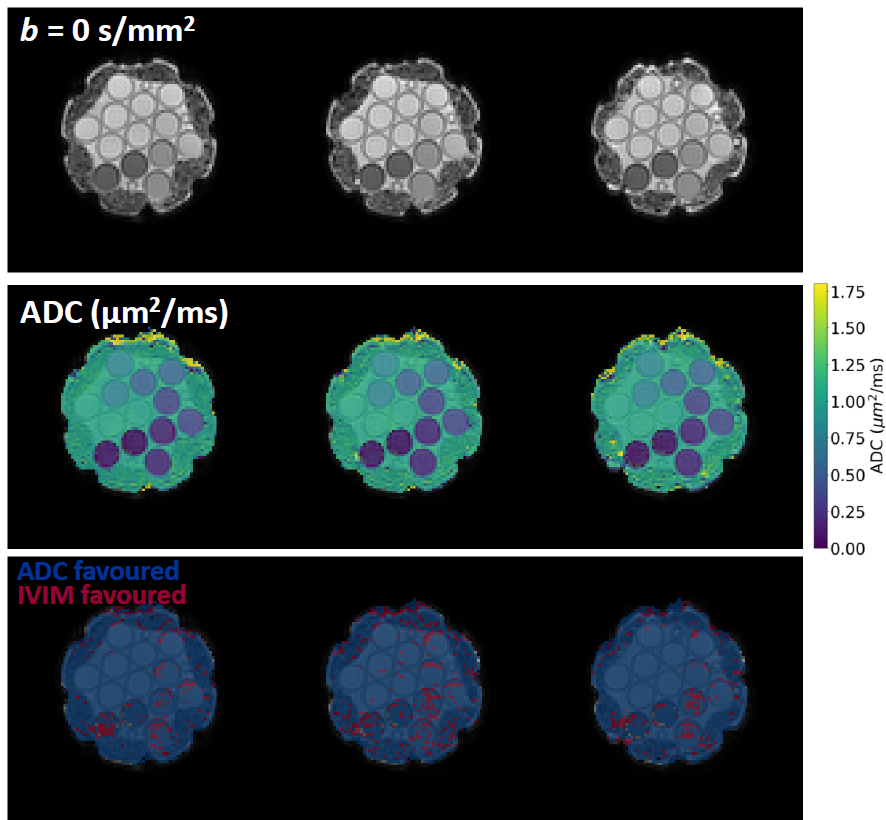
Figure 2. Phantom experiments. b = 0 s/mm2 images, ADC maps, and model preference maps are shown for three central slices in the ice-water phantom. ADC and IVIM models are preferred in the blue and red voxels, respectively.
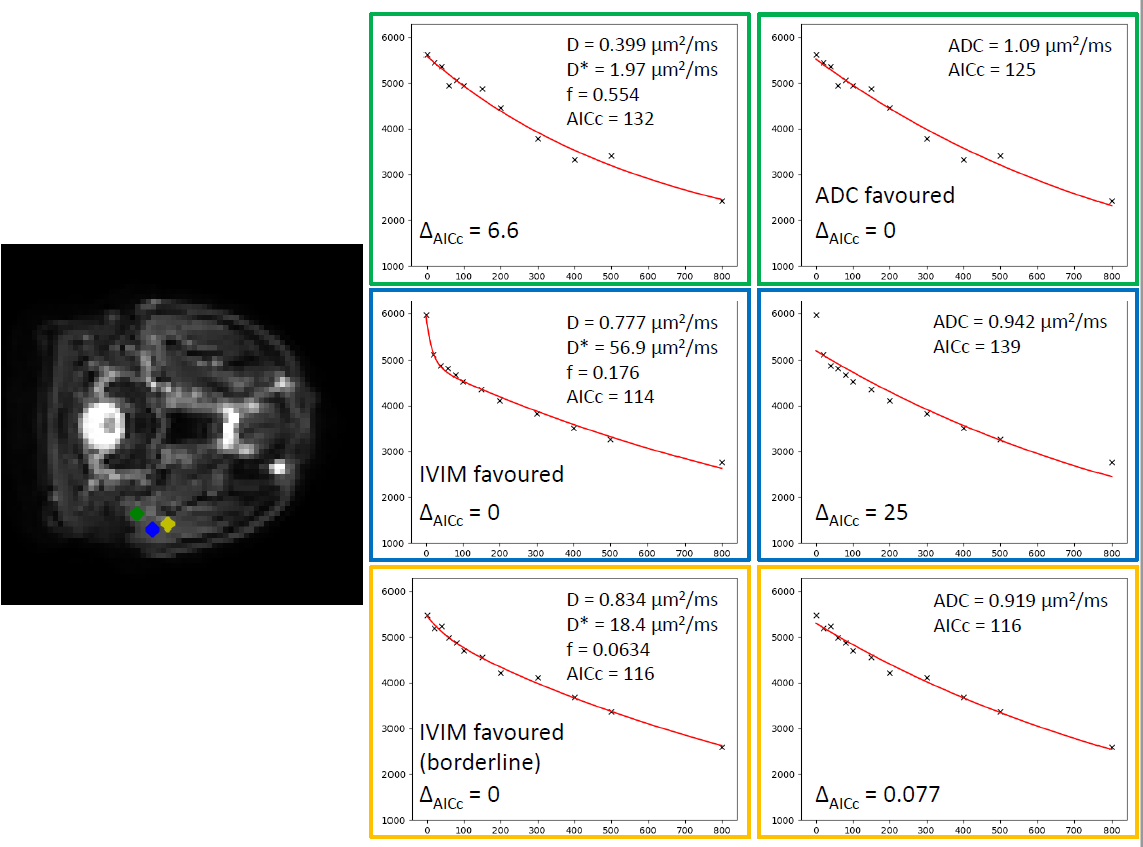
Figure 3. Signal vs. b-value (s/mm2) plots for three example voxels in the parotid gland of one patient. Plots show that ADC (green) and IVIM (blue) models may be favoured in different voxels, with other voxels (yellow) showing that both models can fit essentially equally well. ΔAICc is the difference between a given model’s AICc and the minimum of both models’ AICc, with large positive values indicating a model that is inappropriate for a given voxel.
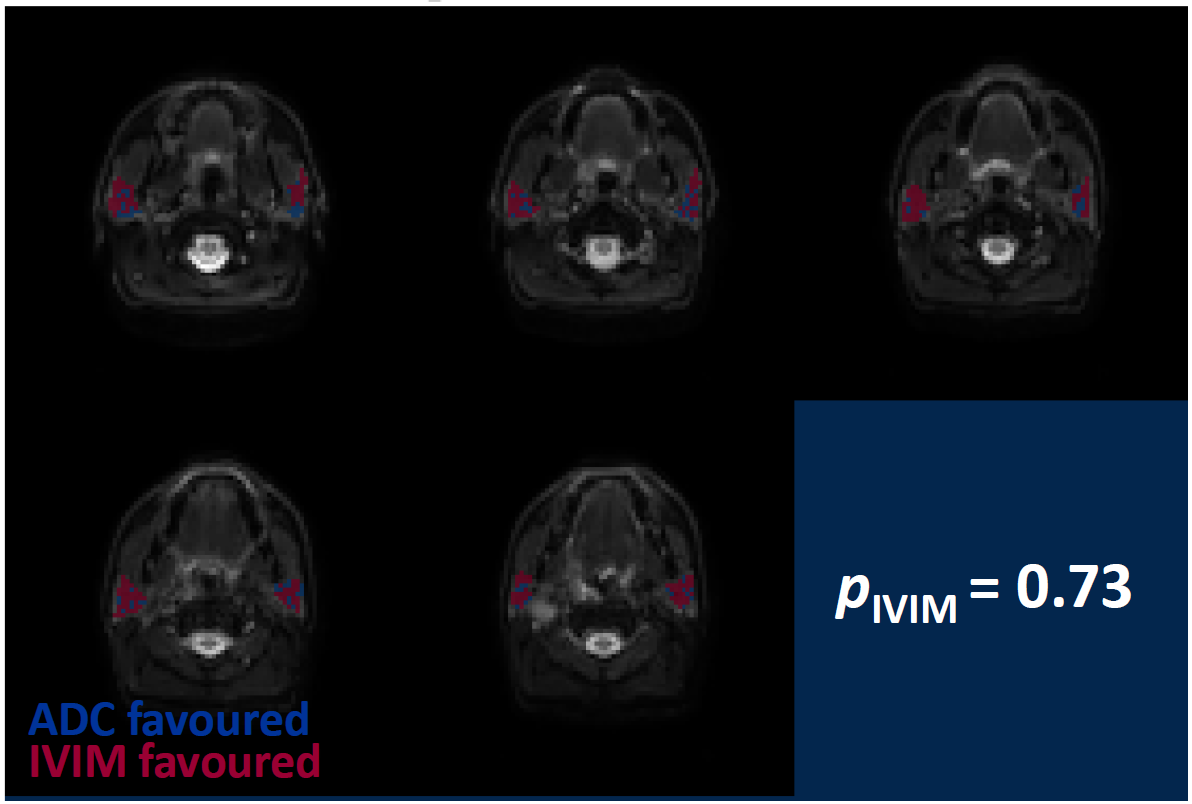
Figure 4. Model preference maps in the parotid glands, overlaid on b = 0 s/mm2 images. ADC and IVIM models are preferred in the blue and red voxels, respectively. Across the parotid glands in this patient, the IVIM model is preferred in 73% of voxels.
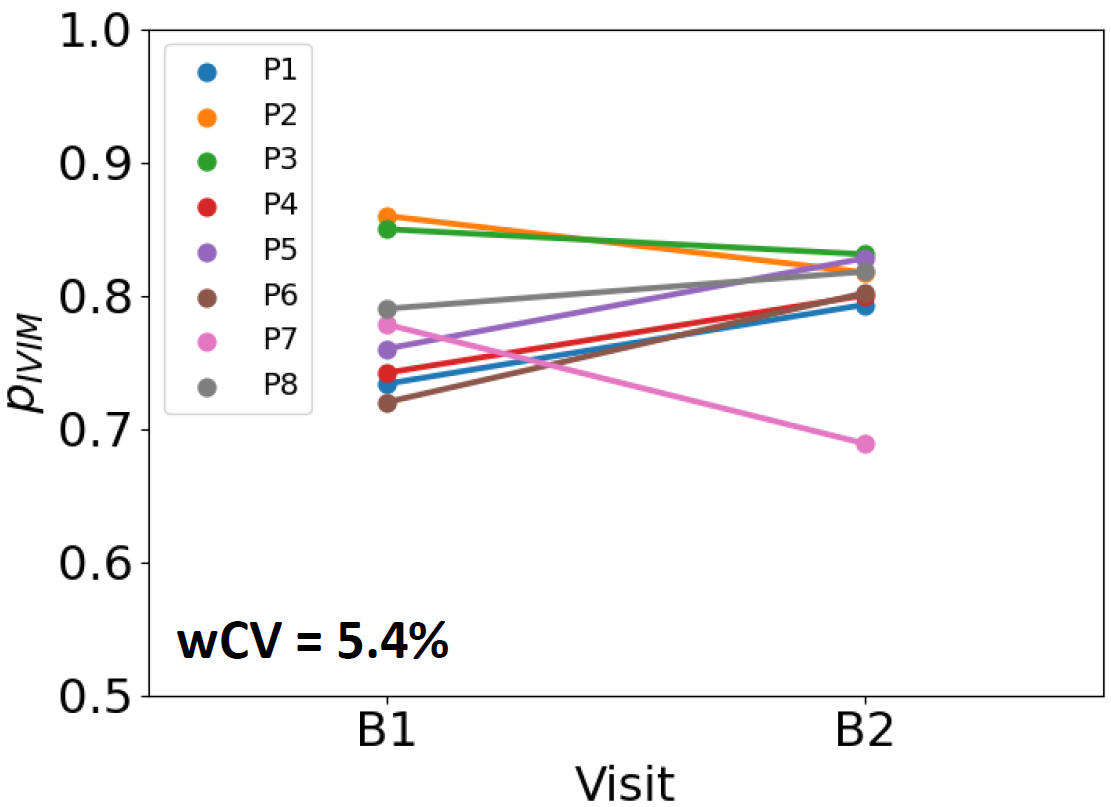
Figure 5. Repeatability of the proportion of parotid voxels where the IVIM model is favoured. Values are plotted for eight patients, for two baseline pre-treatment scans (B1 and B2), showing a within-subject coefficient of variation (wCV) of 5.4%.