2701
T2 mapping for contiguous multi-slice 3D volume: A new EMC-based technique taking into account slice cross-talk effects1School of Physics and Engineering, ITMO University, Saint-Petersburg, Russian Federation, 2National Higher French Institute of Aeronautics and Space, Toulouse, France, 3Aix-Marseille Universite, CNRS, Centre de Résonance Magnétique Biologique et Médicale, Marseille, France, 4Siemens Healthcare SAS, Saint-Denis, France
Synopsis
Previously, an elegant method based on the generation of echo modulation curves (EMC) demonstrated a very high accuracy of T2 measurements. However, the original approach considered EMC dictionary modelling only for a single slice mode of multi-echo spin echo (MESE) sequence. For some applications, such as T2 mapping of cartilage in small joints, contiguous MRI is required. As a result, slice cross-talk effect may affect the accuracy of T2 estimation. In this work, we report a modified version of the EMC technique, which can be used to quantify T2 values for zero-gap multi-slice MESE acquisitions in tissues with long T1.
Introduction
T2 relaxation time mapping is a useful technique allowing, for example, the evaluation of inflammatory status and hydration in multiple tissues. A very elegant method based on the generation of a dictionary of echo modulation curves (EMC), has been recently proposed1. A dictionary is generated for a particular pulse sequence and considers radiofrequency pulse properties, T2 values, and B1+ inhomogeneities. On a pixel basis, experimentally obtained EMC curves can be compared to the dictionary curves in order to select the best matching curve and the corresponding T2 value. This genuine method was developed for a single slice and did not take into account cross-talk effects between slices, occurring for multi-slice acquisitions. In general, the cross-talk effect can be minimized by using a large inter-slice gap (100% or even larger) but this option is not useable for thin structures such as cartilage of small joints2. In the present work, we report a modified version of the EMC technique, which can be used to quantify T2 values for zero-gap multi-slice MSME acquisitions.Methods
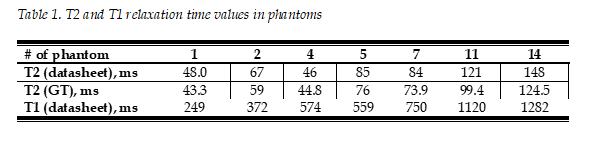
Measurements were conducted at 3T (MAGNETOM Vida, Siemens Healthcare, Erlangen, Germany). Parameters of the MESE (TR=4s, first TE=11 ms, inter echo time = 11ms, # of echo signals – 8) were similar to those previously used for EMC-based T2 mapping of cartilage3. Additionally, we used the MSME sequence with a shorter TR=2 s in order to exaggerate the slice cross-talk effect. Slice thickness was set to 2 mm, a number of slices – to 5 with 0% interslice gap. Images were acquired for a set of 7 calibrated phantoms (Diagnostic Sonar, Livingston, UK) (Table 1 in Fig.1). T2 maps were also obtained with a “Gold Standard” single-echo SE method (TR= 5.5 ms, TE=11/22/33/44/55/66/88 ms) in a single slice. B1+ and slice selection gradient amplitudes arrays of the corresponding MSME pulse sequence were provided by the manufacturer. Magnetic resonance response of the sequence was simulated using Bloch equation simulator4, resulting in a home-built Matlab script, taking into account a multi-slice excitation in an interleaved order (for 5 slices the order was 1-3-5-2-4). For this purpose, TR was divided into 5 equal intervals. Within each interval, the sequence contained 1 excitation, 8 refocusing RF pulses, and corresponding slice-selection gradient pulses. The magnetization distribution in a slice selection direction (slice profile) was calculated for each of the echo signals and for the last point of the TR/5 interval. The latter distribution was then shifted and became the initial magnetization for the excitation of the next slice. Using this script, single-slice and multi-slice dictionaries were generated for the pulse sequences used in the experimental part. The parameters of the dictionaries were as follows: T2=[10:1:160]ms, B1+=[80:1:120]%, T1=T1s of 7 phantoms. Then, the experimental data was “fitted” with a dedicated dictionary (slice # and T1 values were imposed). Finally, for each TR, 2 variants of estimated T2 values were obtained from fitting with single slice dictionary and multi-slice dictionary.Results and Discussion
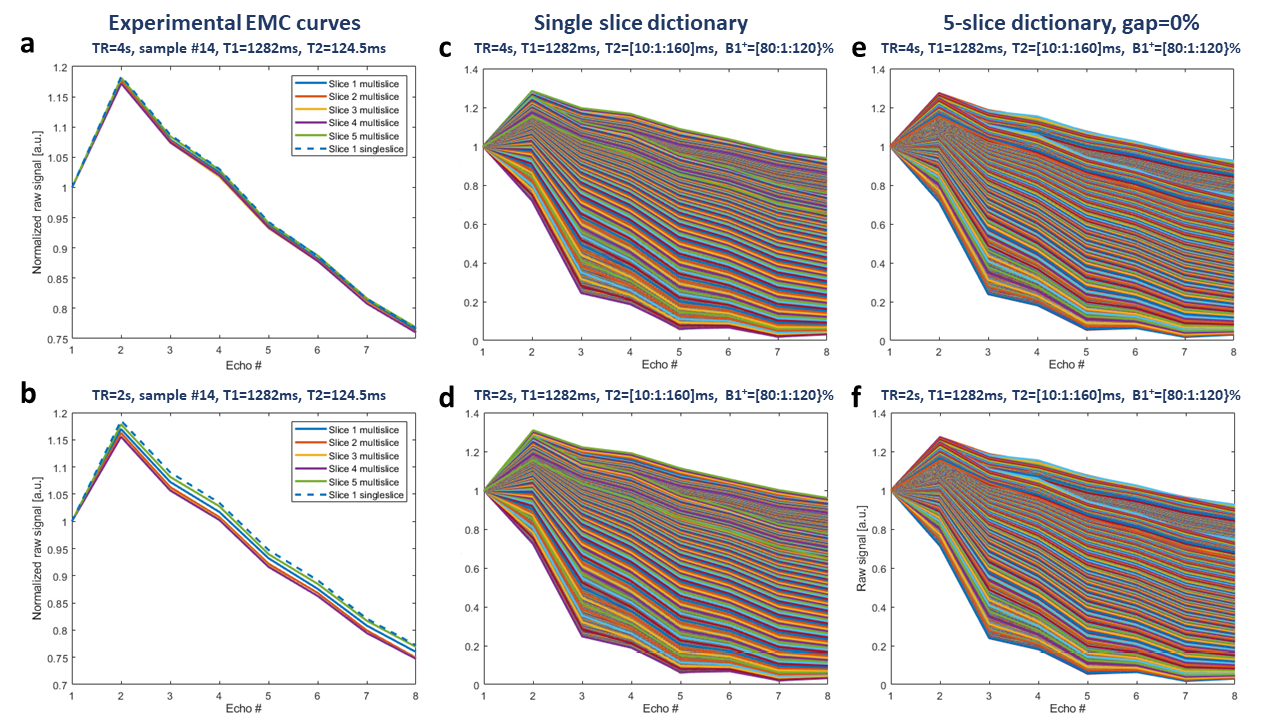
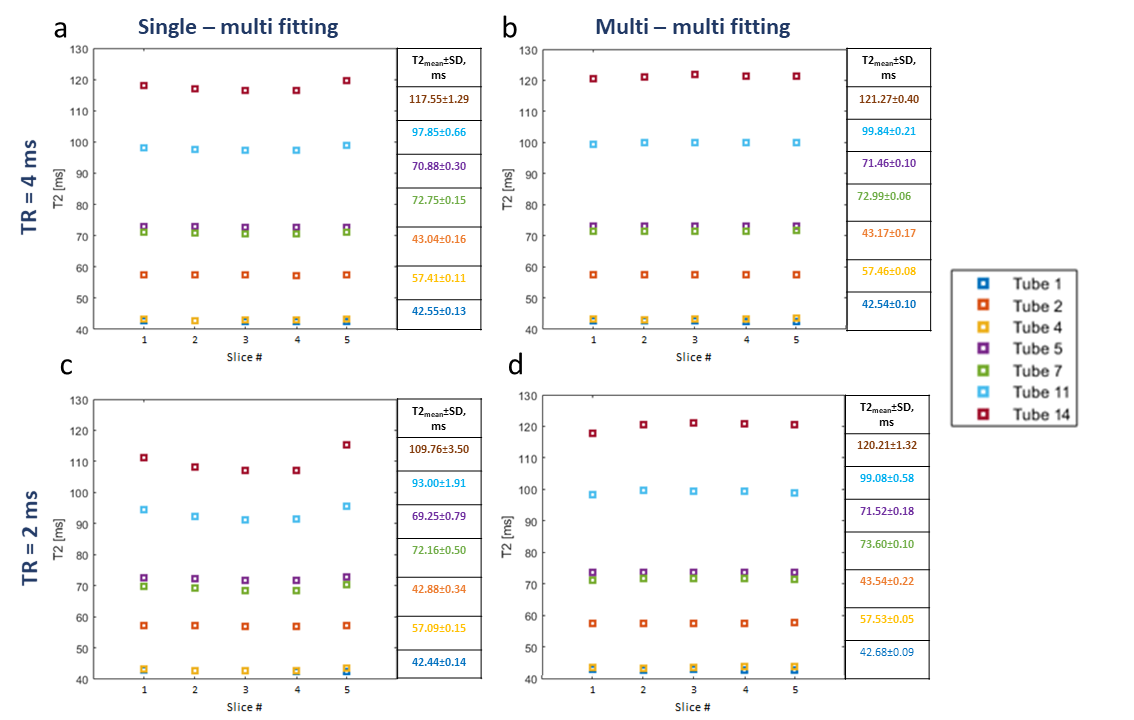
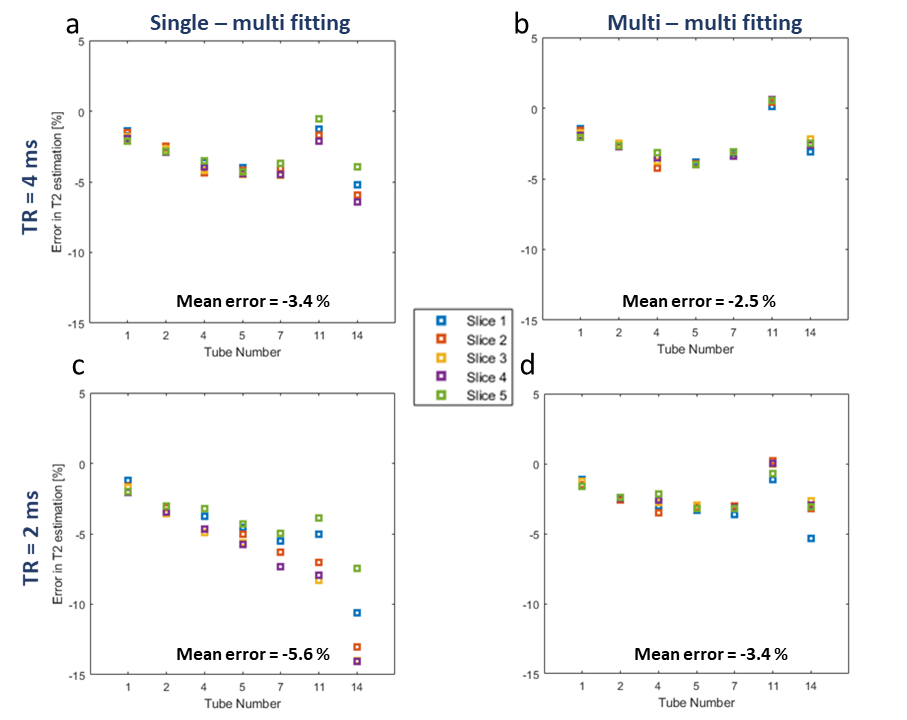
The multi-slice effect is actually illustrated in Fig.2 (a,b) showing the measured EMC curves in phantom #14 with the longest T1 value. These curves in multi-slice mode are clearly different than those resulting from the single slice mode, especially for TR = 2 s. Examples of subdictionaries of EMC curves generated for phantom #14 are depicted in Fig 2 (c,d,e,f). T2 values obtained with the “Golden Standard” technique were different from the data provided by the phantom manufacturer (GT in Table 1 in Fig.1). The corresponding results of EMC fitting are summarized in Fig.3. Variations of T2 times between consecutive slices were smaller when the data were fitted with multi-slice as compared to single-slice dictionaries and so for both TRs. Interestingly, T2 values computed from multi-slice dictionaries were similar for both TRs, whereas using single slice dictionaries provided different values. One can conclude that EMC-based T2 estimation is insensitive to TR values when taking into account the slice cross-talk effect. The averaged for all slices in all phantoms T2 estimation error (-2.5% for TR = 4s and -3.4% for TR = 2 ms) in comparison to GT (Fig. 4) was larger than the 1.5% previously reported for experimental data acquired with a 100% slice gap and fitted with a single slice dictionary1. One needs to mention that phantoms used in our study contained agarose and that magnetization transfer effects, not considered in our simulations, could affect signal intensity in multi-slice scanning5. The second possible source of error might be related to erroneous T1 values used for dictionaries generation and which critically influence the rate of slice cross-talk effects. Future studies might include multiple T1 values as part of the creation of dictionaries.Conclusion
In the present study, we have demonstrated that using an extension of the EMC technique that takes into account the slice cross-talk effect in contiguous multi-slice MESE allowed a robust estimate of T2 values among the slices. Our computing approach indicated that acquisition schemes with reduced TR could be with almost no effect on T2 values accuracy. The latter result may be useful when a moderate number of slices is required for scanning (to acquire all the slices during one TR), for example, when scanning fingers.Acknowledgements
This work was supported by the Ministry of Education and Science of the Russian Federation (075-15-2021-592).References
1Ben-Eliezer, N et al., Magn. Reson. Med., 73: 809-817 (2015)
2Johnson D. Magn Reson Imaging Clin N Am., 23(3):355-366 (2015)
3Ben-Eliezer, N et al., Cartilage., 1947603519870852 (2019)
4Hargreaves B A, et al. Magn Reson Med., 46(1):149-158 (2001)
5Radunsky D, et al. Magn Reson Med., 82: 145– 158 (2019)
Figures