2700
Performance Analysis of Undersampling Strategies for Multi-Shell Diffusion MRI1Department of Electrical and Electronics Engineering, Bilkent University, Ankara, Turkey, 2National Magnetic Resonance Research Center (UMRAM), Bilkent University, Ankara, Turkey, 3Neuroscience Graduate Program, Bilkent University, Ankara, Turkey
Synopsis
Multi-shell dMRI metrics quantify information on micro-properties of neural tissue and can be used as markers for neurological diseases. The protocols used to acquire dMRI data often have prolonged acquisition times. In this work, we propose different undersampling strategies that reduce the acquisition time to half, and evaluate how the performances of multi-shell dMRI metrics change under these strategies. The results show that, while the best performing strategy changes for each metric, 3-shell gradient schemes with small variance of b-vector density on consecutive shells demonstrate improved performance. Additionally, more complex dMRI metrics exhibit relatively increased sensitivity to undersampling.
Introduction
Multi-shell diffusion MRI (dMRI) measures the diffusion of water molecules within neural tissue and infers the underlying microscopic properties1. Sampling the q-space extensively allows resolving complex fiber structures and computing metrics that can be used as markers for neurological diseases2,3, with the downside of prolonged acquisition times. In this work, we compare the performances of multi-shell dMRI metrics under different undersampling strategies with the goal of accelerating these protocols.Methods
DatasetWe used five subjects randomly chosen from Human Connectome Project 1200 Subjects Release4. The images were acquired with a multiband dMRI sequence on a Siemens 3T MRI scanner, with FOV = 210x180 mm2, 1.25 mm isotropic resolution, TR/TE = 5520/89.5 ms, and 20 minute total acquisition time. The gradient table contained 6 b=0 measurements and 89 diffusion weighting directions over 3-shells of b=1000, 2000, and 3000 s/mm2. For each q-space point, echo planar imaging (EPI) data were acquired in reversed phase-encoding (PE) directions for correcting susceptibility-induced artifacts. Before analysis, each image was corrected using the TOPUP tool of FLS5,6 and masked with the BET tool of FSL7.
Undersampling Strategies
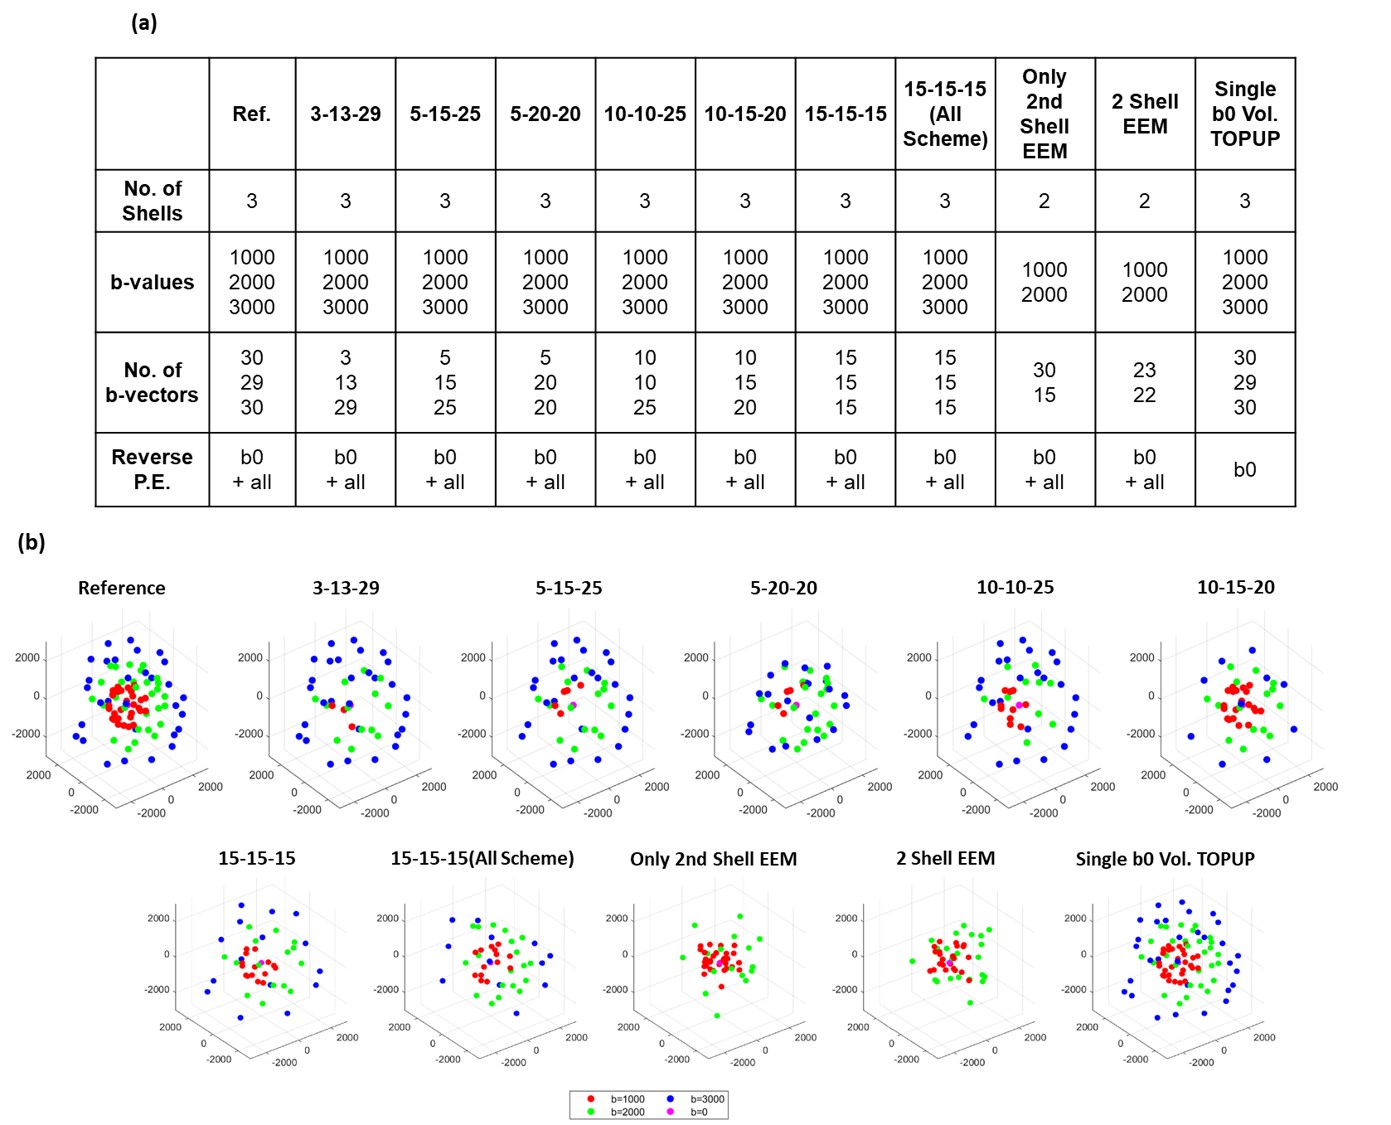
The goal was to reduce the acquisition time to half and to evaluate how different undersampling strategies (see Fig.1) affect the performances of multi-shell dMRI metrics. The gradient schemes contained either 3 or 2 shells. For all strategies, the original 6 b0 measurements were kept. To select the optimum b-vectors, the undersampling schemes were obtained with Electrostatic Energy Minimization (EEM) using subsetpoints tool of Camino Toolbox8,9. Three-shell EEM schemes were obtained by undersampling each shell separately. Gradient tables contained varying number of b-vectors in each shell, the total number reduced from 89 to 45. For comparison, another scheme was designed with 15 b-vectors in each shell, where EEM was applied for all shells combined. For comparison purposes, alternative undersampling approaches were evaluated: First, the first shell was kept and the third shell was completely removed, and EEM was applied to undersample the second shell alone. Second, for the same case, EEM was applied to the first and the second shells together. Lastly, the gradient table was kept as it is. Instead, only a single b0 volume was acquired with reversed PE directions, which was then utilized to correct the susceptibility-induced distortions in all volumes. Figure 1 summarizes the undersampling strategies and the resulting gradient schemes.
Multi Shell Diffusion Imaging Metrics
Neurite Orientation Dispersion and Density Imaging (NODDI)10, HARDI Multi-Shell Multi-Tissue Constrained Spherical Deconvolution (CSD)11, and Diffusion Tensor Imaging (DTI)12 were used for quantitative analysis of dMRI data. HARDI signal allows computing complex metrics that highlight different properties of the neural tissue. We considered six different metrics: Neurite Density Index (NDI) and Orientation Dispersion Index (ODI) for NODDI, Apparent Fiber Density (AFD) and Number of Fiber Orientations (nuFO) for CSD, and Fractional Anisotropy (FA) and Mean Diffusivity (MD) for DTI. AMICO toolbox13 was used for NODDI analysis, and the DIPY toolbox14 was used for CSD and DTI analysis. All dMRI metrics computed under the different undersampling strategies were evaluated through visual inspection, and Peak Signal-to-Noise Ratio (PSNR) and Structural Similarity Index Measure (SSIM) metrics were computed after masking out the cerebrospinal fluid (CSF) regions.
Results
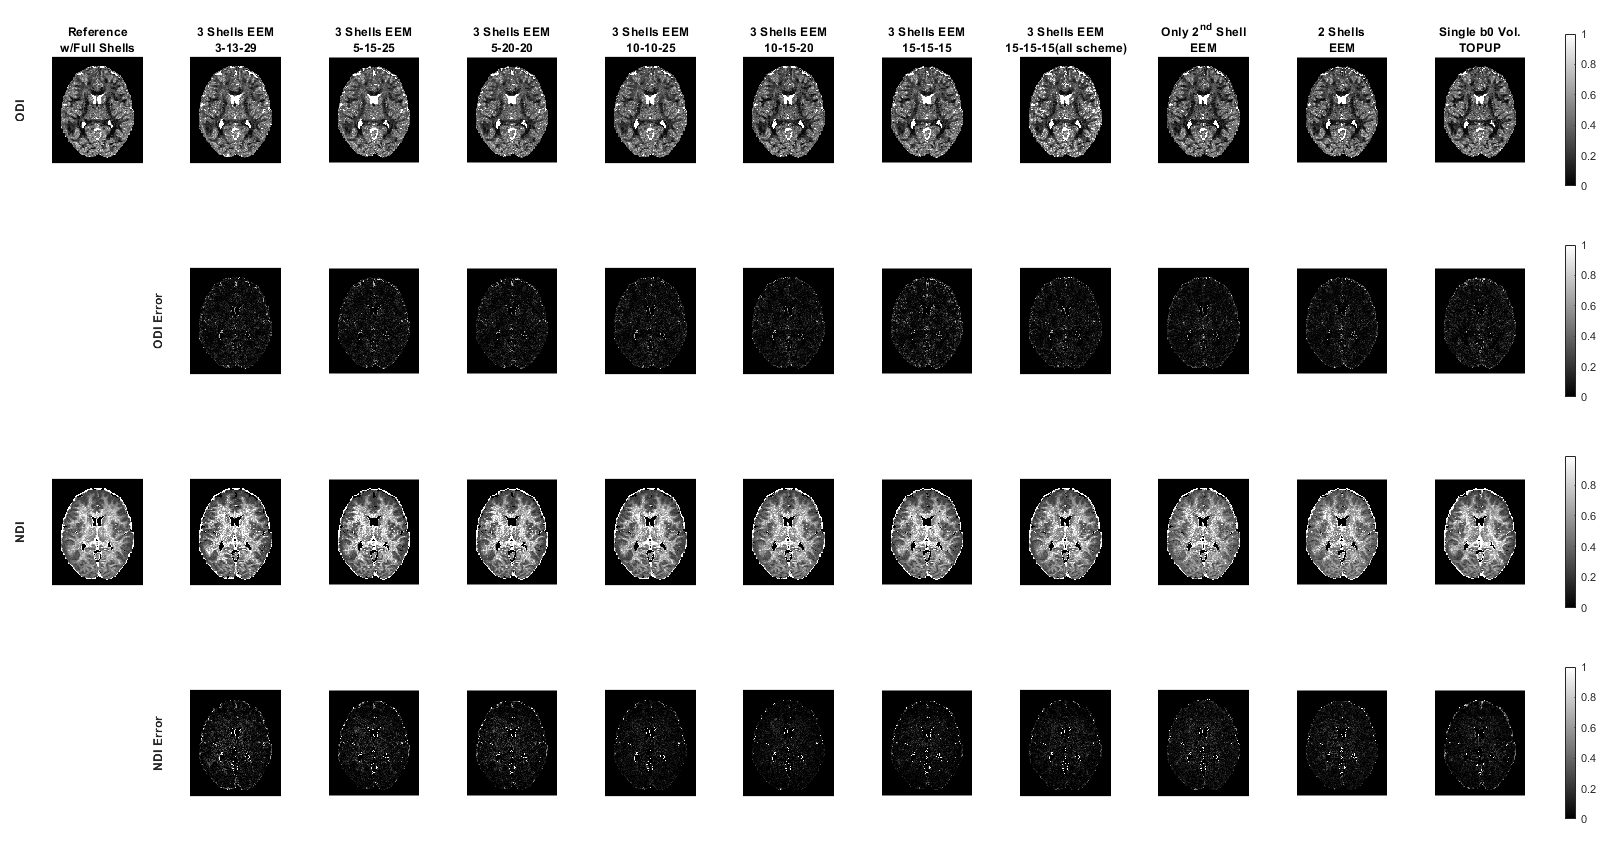
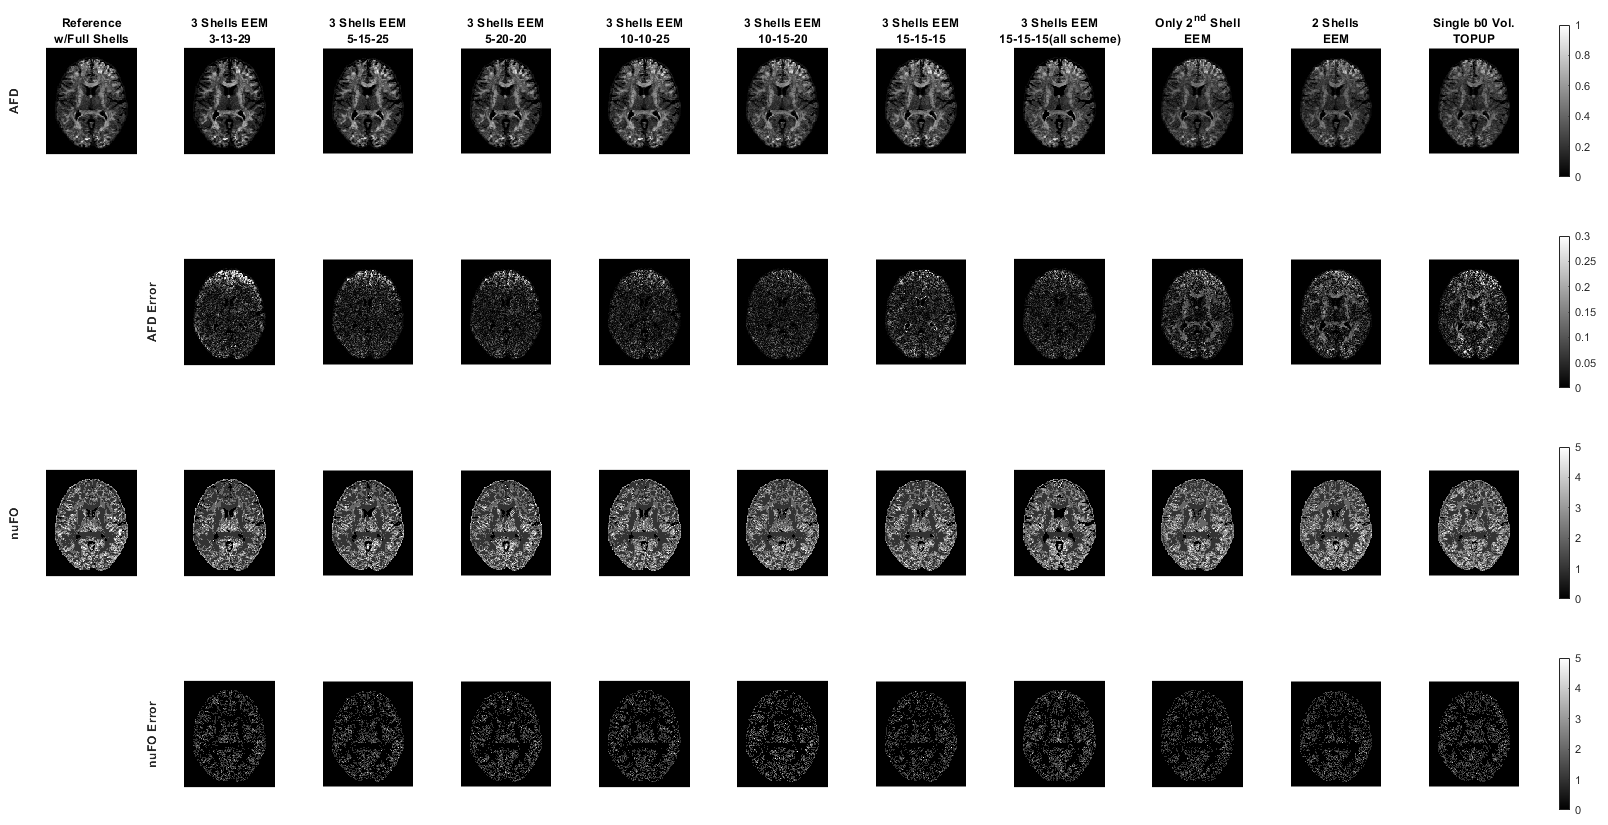
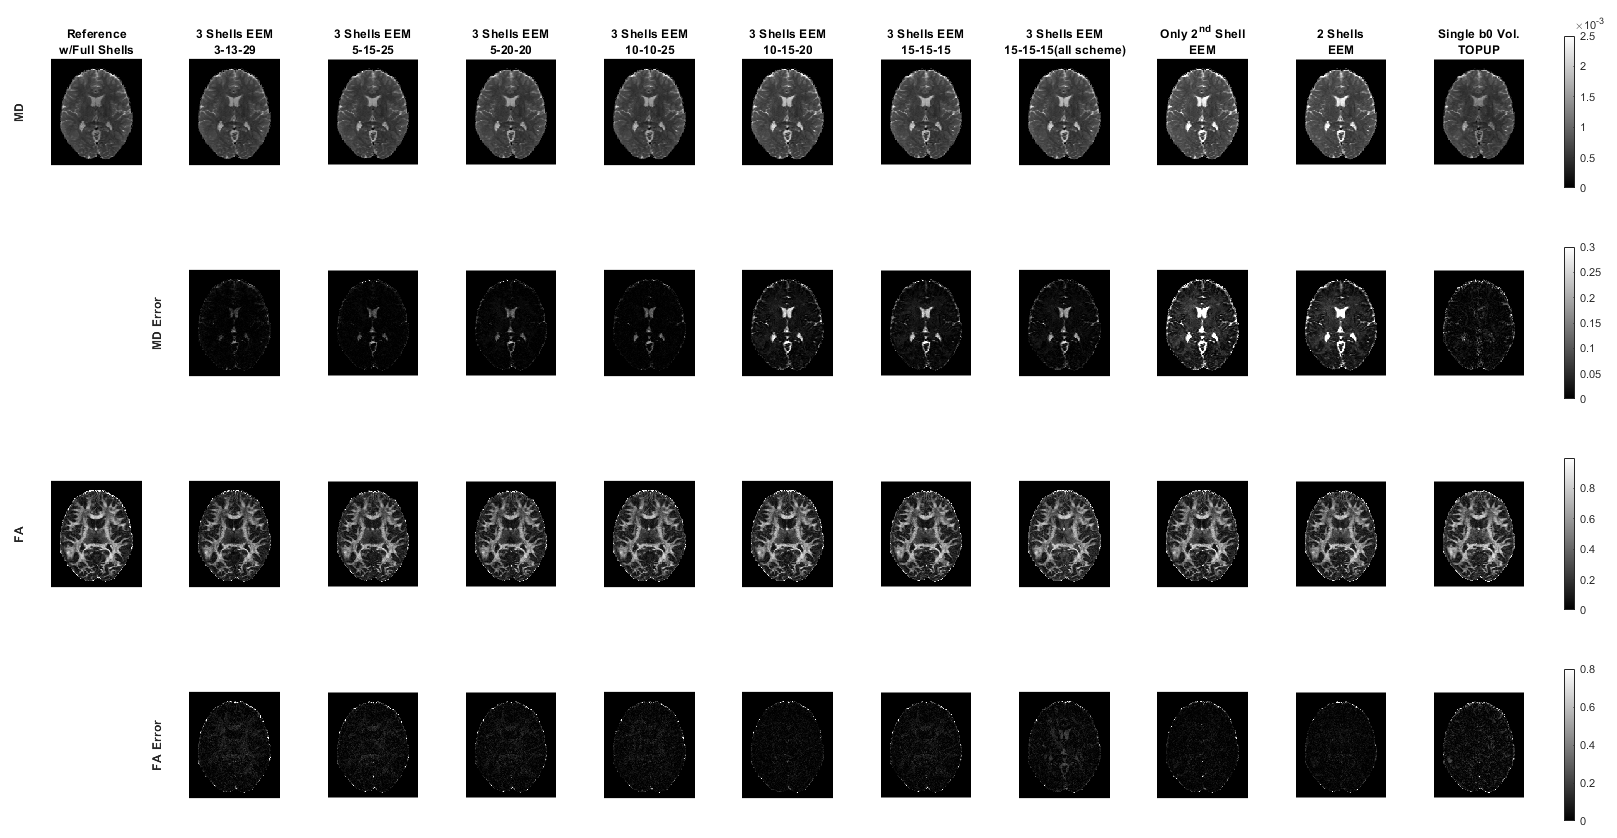
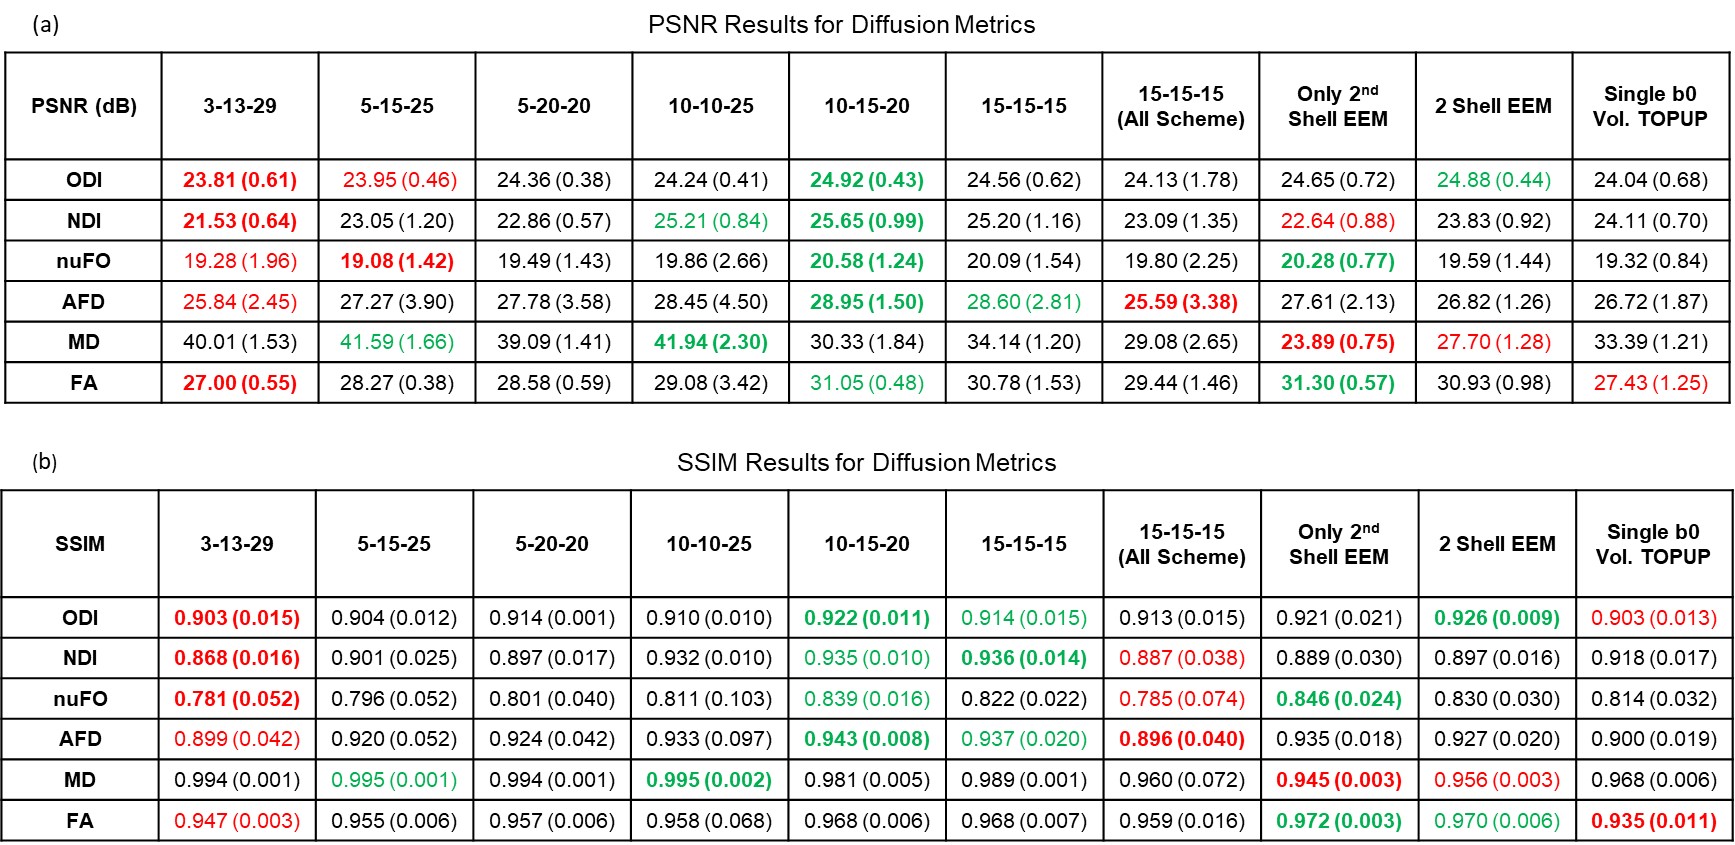
For a single subject, NODDI, CSD, and DTI metric maps and error images are presented in Figures 2, 3 and 4, respectively. These results show that all the undersampling strategies preserve the necessary information about the neurological properties and structural characteristics of the brain. Except for the CSF regions, the error is homogenously dispersed over the brain tissue.The median (IQR) values for PSNR and SSIM across 5 subjects are given in Fig. 5. The results indicate that the undersampling strategy should be chosen based on the metric targeted as the neurological marker. 3-shell strategies perform better than the alternative approaches. The best performance is achieved by the scheme labeled as 10-15-20. The scheme where 45 b-vectors were dispersed isotropically over the 3-shells (15-15-15) and the scheme labeled as 10-10-25 also have good performance overall. Hence, the gradient tables with a relatively small variance between the number of b-vectors on the consecutive shells perform better.
Interestingly, the highest performing 10-15-20 undersampling strategy performs poorly in MD. Comparing different strategies, MD seems to prefer more b-vectors to be allocated to the outer shells.
The results in Fig. 5 also indicate that some of the multi-shell dMRI metrics are more robust against undersampling. For example, MD, a relatively low-dimensional metric, reaches excellent PSNR levels of 40 dB for multiple undersampling schemes. In contrast, nuFO, which resolves complex white matter bundles, has mediocre PSNR levels of 20 dB even under the best undersampling strategy. The rest of the metrics have moderate robustness against undersampling.
Conclusion
In this work, we compared the performances of multi-shell dMRI metrics under different undersampling strategies that effectively halve the total acquisition time. 3-shell schemes with relatively small variance between the number of b-vectors on the consecutive shells demonstrate improved performance. The dMRI metrics that aim to resolve complex fiber characteristics are relatively more sensitive against undersampling.Acknowledgements
This work was supported by the Scientific and Technological Research Council of Turkey (TUBITAK 117E116).
Data were provided by the Human Connectome Project, WU-Minn Consortium (Principal Investigators: David Van Essen and Kamil Ugurbil; 1U54MH091657) funded by the 16 NIH Institutes and Centers that support the NIH Blueprint for Neuroscience Research; and by the McDonnell Center for Systems Neuroscience at Washington University.
References
- J. G. Webster and M. Descoteaux, “High Angular Resolution Diffusion Imaging (HARDI),” Wiley Encycl. Electr. Electron. Eng., pp. 1–25, 2015, doi: 10.1002/047134608x.w8258.
- G. P. Winston, C. Micallef, M. R. Symms, D. C. Alexander, J. S. Duncan, and H. Zhang, “Advanced diffusion imaging sequences could aid assessing patients with focal cortical dysplasia and epilepsy,” Epilepsy Res., vol. 108, no. 2, pp. 336–339, 2014, doi: 10.1016/j.eplepsyres.2013.11.004.
- T. Schneider, W. Brownlee, H. Zhang, O. Ciccarelli, D. H. Miller, and C. G. Wheeler-Kingshott, “Sensitivity of multi-shell NODDI to multiple sclerosis white matter changes: A pilot study,” Funct. Neurol., vol. 32, no. 2, pp. 97–101, 2017, doi: 10.11138/FNeur/2017.32.2.097.
- D. C. Van Essen, S. M. Smith, D. M. Barch, T. E. J. Behrens, E. Yacoub, and K. Ugurbil, “The WU-Minn Human Connectome Project: An overview,” Neuroimage, vol. 80, pp. 62–79, 2013, doi: 10.1016/j.neuroimage.2013.05.041.
- J. L. R. Andersson, S. Skare, and J. Ashburner, “How to correct susceptibility distortions in spin-echo echo-planar images: Application to diffusion tensor imaging,” Neuroimage, vol. 20, no. 2, pp. 870–888, 2003, doi: 10.1016/S1053-8119(03)00336-7.
- S. M. Smith et al., “Advances in functional and structural MR image analysis and implementation as FSL,” Neuroimage, vol. 23, no. SUPPL. 1, pp. 208–219, 2004, doi: 10.1016/j.neuroimage.2004.07.051.
- S.M. Smith. Fast robust automated brain extraction. Human Brain Mapping, 17(3):143-155, November 2002.
- D. K. Jones, M. A. Horsfield, and A. Simmons, “Optimal strategies for measuring diffusion in anisotropic systems by magnetic resonance imaging,” Magn. Reson. Med., vol. 42, no. 3, pp. 515–525, 1999.
- P. A. Cook, M. Symms, P. A. Boulby, and D. C. Alexander, “Optimal acquisition orders of diffusion-weighted MRI measurements,” J. Magn. Reson. Imaging, vol. 25, no. 5, pp. 1051–1058, 2007.
- H. Zhang, T. Schneider, C. A. Wheeler-Kingshott, and D. C. Alexander, “NODDI: Practical in vivo neurite orientation dispersion and density imaging of the human brain,” Neuroimage, vol. 61, no. 4, pp. 1000–1016, 2012, doi: 10.1016/j.neuroimage.2012.03.072.
- B. Jeurissen, J. D. Tournier, T. Dhollander, A. Connelly, and J. Sijbers, “Multi-tissue constrained spherical deconvolution for improved analysis of multi-shell diffusion MRI data,” Neuroimage, vol. 103, pp. 411–426, 2014, doi: 10.1016/j.neuroimage.2014.07.061.
- J.-D. Tournier, S. Mori, and A. Leemans, “Diffusion tensor imaging and beyond,” Magn. Reson. Med., vol. 65, no. 6, pp. 1532–1556, Jun. 2011, doi: 10.1002/mrm.22924.
- A. Daducci, E. J. Canales-Rodríguez, H. Zhang, T. B. Dyrby, D. C. Alexander, and J. P. Thiran, “Accelerated Microstructure Imaging via Convex Optimization (AMICO) from diffusion MRI data,” Neuroimage, vol. 105, pp. 32–44, 2015, doi: 10.1016/j.neuroimage.2014.10.026.
- E. Garyfallidis et al., “Dipy, a library for the analysis of diffusion MRI data,” Front. Neuroinform., vol. 8, no. FEB, pp. 1–17, 2014, doi: 10.3389/fninf.2014.00008.
Figures